Related articles by
Research Article
Other versions:


- ContentsContents
- Article InfoArticle Info
- CiteCite
- MetricsMetrics
- CommentComment
- RelatedRelated
- FigsFigs
- TabsTabs
- MapMap
- TaxaTaxa
- RefsRefs
- CitedCited
- NanopubsNanopubs
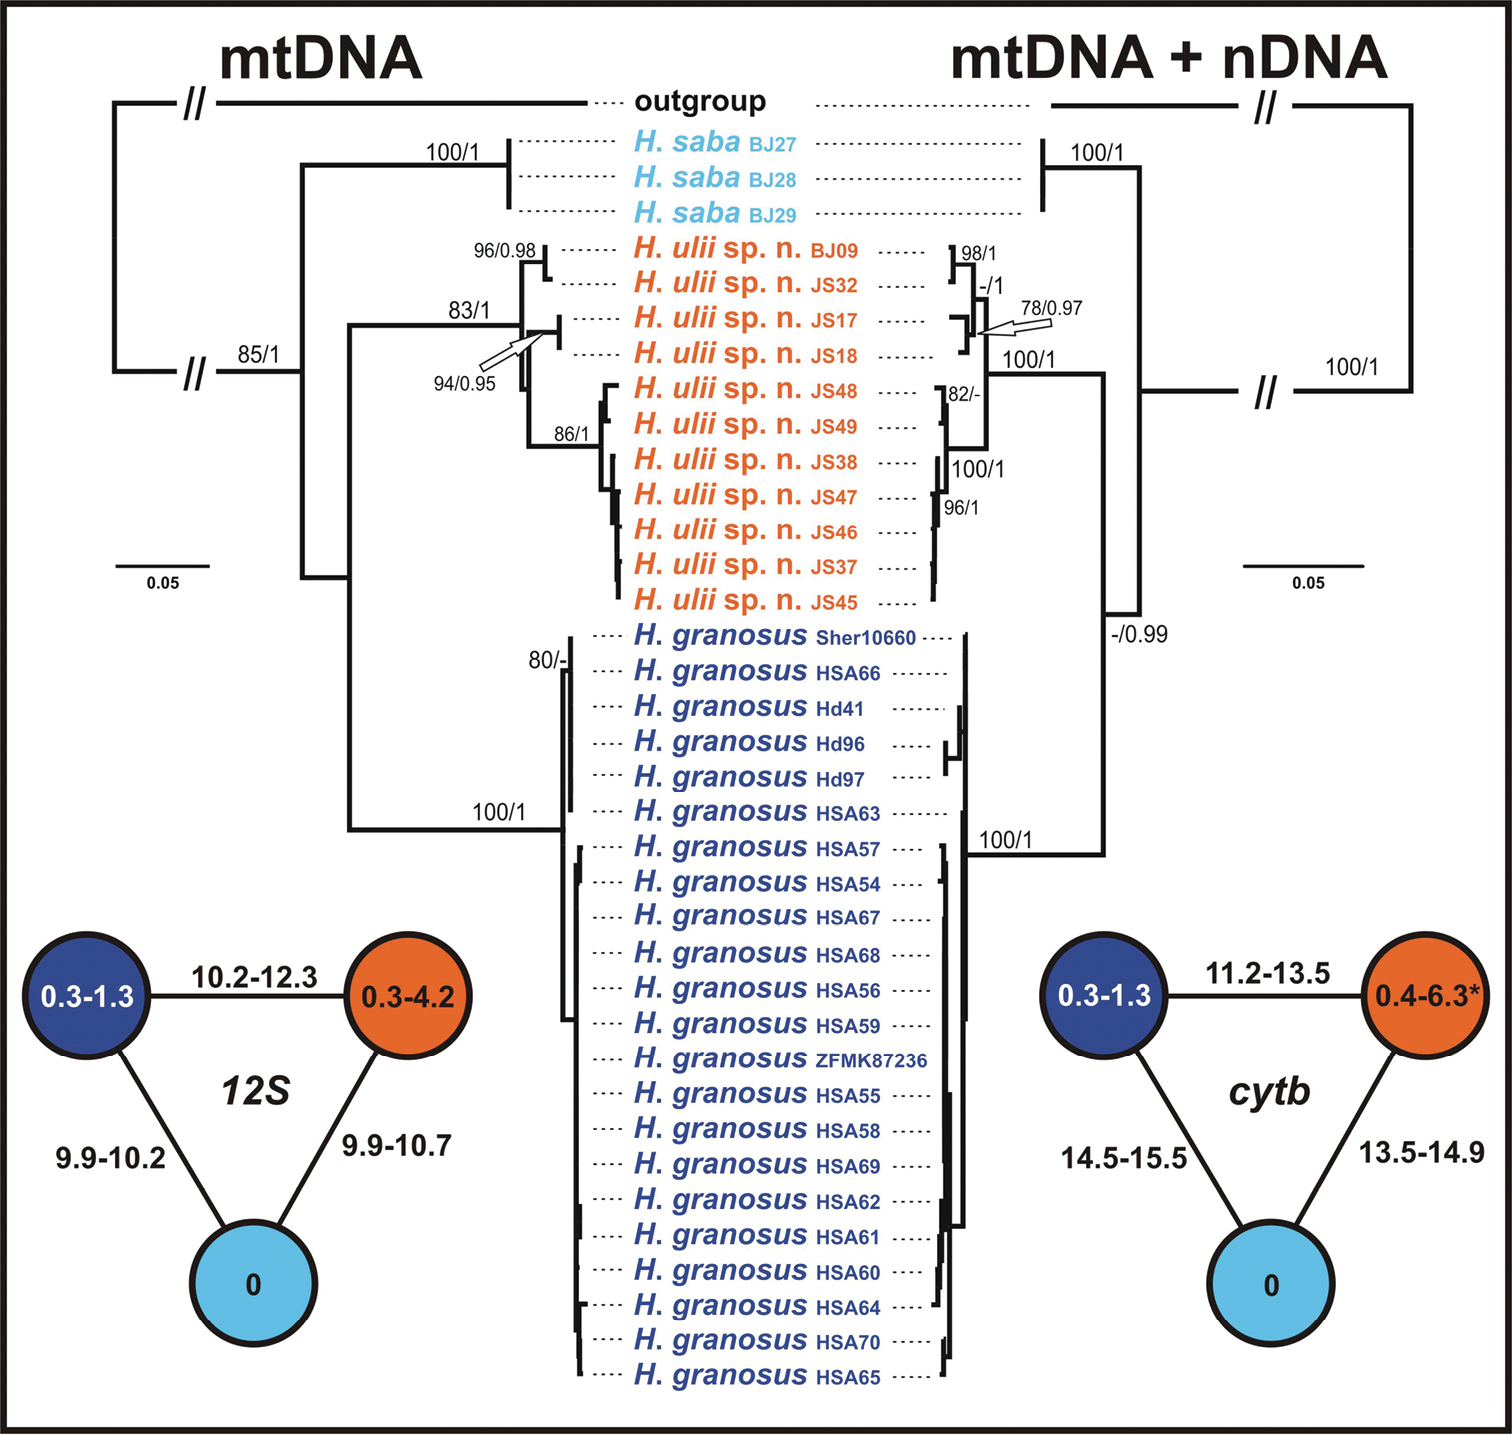
Figure 2.
Maximum likelihood trees of mtDNA and mtDNA + nDNA datasets of the ‘Hemidactylus saba species group’. ML bootstrap values/Bayesian posterior probabilities are indicated by the nodes. Hemidactylus flaviviridis and Hemidactylus angulatus were used as outgroups. At the sides, schematic networks showing intra- and interspecific uncorrected p distances (in %) in the sequences of 12S and cytb. * intraspecific distances within Hemidactylus ulii sp. n. are based on an alignment of 1127 bp, all other values for cytb are calculated for an alignment of 307 bp.
Subscribe to email alerts for current Article's categories