


Citation: Allegrucci G, Rampini M, Di Russo C, Lana E, Cocchi S, Sbordoni V (2014) Phylogeography and systematics of the westernmost Italian Dolichopoda species (Orthoptera, Rhaphidophoridae). ZooKeys 437: 1–23. doi: 10.3897/zookeys.437.7917
The genus Dolichopoda (Orthoptera; Rhaphidopohoridae) is present in Italy with 9 species distributed from northwestern Italy (Piedmont and Liguria) to the southernmost Apennines (Calabria), occurring also in the Tyrrhenian coastal areas and in Sardinia. Three morphologically very close taxa have been described in Piedmont and Liguria, i.e., D. ligustica ligustica, D. ligustica septentrionalis and D. azami azami.
To investigate the delimitation of the northwestern species of Dolichopoda, we performed both morphological and molecular analyses. Morphological analysis was carried out by considering diagnostic characters generally used to distinguish different taxa, as the shape of epiphallus in males and the subgenital fig in females. Molecular analysis was performed by sequencing three mitochondrial genes, 12S rRNA, 16S rRNA, partially sequenced and the entire gene of COI.
Results from both morphological and molecular analyses highlighted a very homogeneous group of populations, although genetically structured. Three haplogroups geographically distributed could be distinguished and based on these results we suggest a new taxonomic arrangement. All populations, due to the priority of description, should be assigned to D. azami azami Saulcy, 1893 and to preserve the names ligustica and septentrionalis, corresponding to different genetic haplogroups, we assign them to D. azami ligustica stat. n. Baccetti & Capra, 1959 and to D. azami septentrionalis stat. n. Baccetti & Capra, 1959.
Westernmost Dolichopoda species , barcoding, systematics
Dolichopoda is a Mediterranean genus, consisting of more than fifty species distributed throughout the North Mediterranean regions from the Pyrenees to Transcaucasia and north Iran (
Based on morphology three subgenera have been described in Italy: Dolichopoda (Dolichopoda), Dolichopoda (Chopardina) and Dolichopoda (Capraiacris) (
Based on molecular phylogenetic reconstruction (
The most western Italian species are represented by Dolichopoda ligustica, and Dolichopoda azami. Two subspecies are attributed to Dolichopoda ligustica, i.e., Dolichopoda ligustica ligustica and Dolichopoda ligustica septentrionalis. The first one is widespread in the Southern Piedmont (Maritime Alps) and in the north-western Liguria while the range of Dolichopoda ligustica septentrionalis is northernmost and limited to a small area in Val di Lanzo valley, close to Turin, and in some easternmost caves, close to Bergamo. Dolichopoda azami Saulcy, 1893 is widespread in the south eastern France and observed also in Piedmont in a cave in Grana Valley (
Dolichopoda ligustica and Dolichopoda azami have very similar morphologies with little variation in the characters on which the systematics are based. To better understand the differentiation between these two species and the limits of the ranges occupied by each of them, we carried out a study on several populations of Dolichopoda ligustica and Dolichopoda azami, both at morphological and molecular levels. The main aims of this study are: i) to infer the phylogenetic relationships of these two species, using molecular markers; ii) to compare their differentiation with the differentiation of all other species belonging to genus Dolichopoda previously analyzed (
A total of 26 populations from Piedmont and Liguria (Maritime Alps, and western Liguria Apennines in northwest Italy), were analyzed in this study (Fig. 1, Table 1).
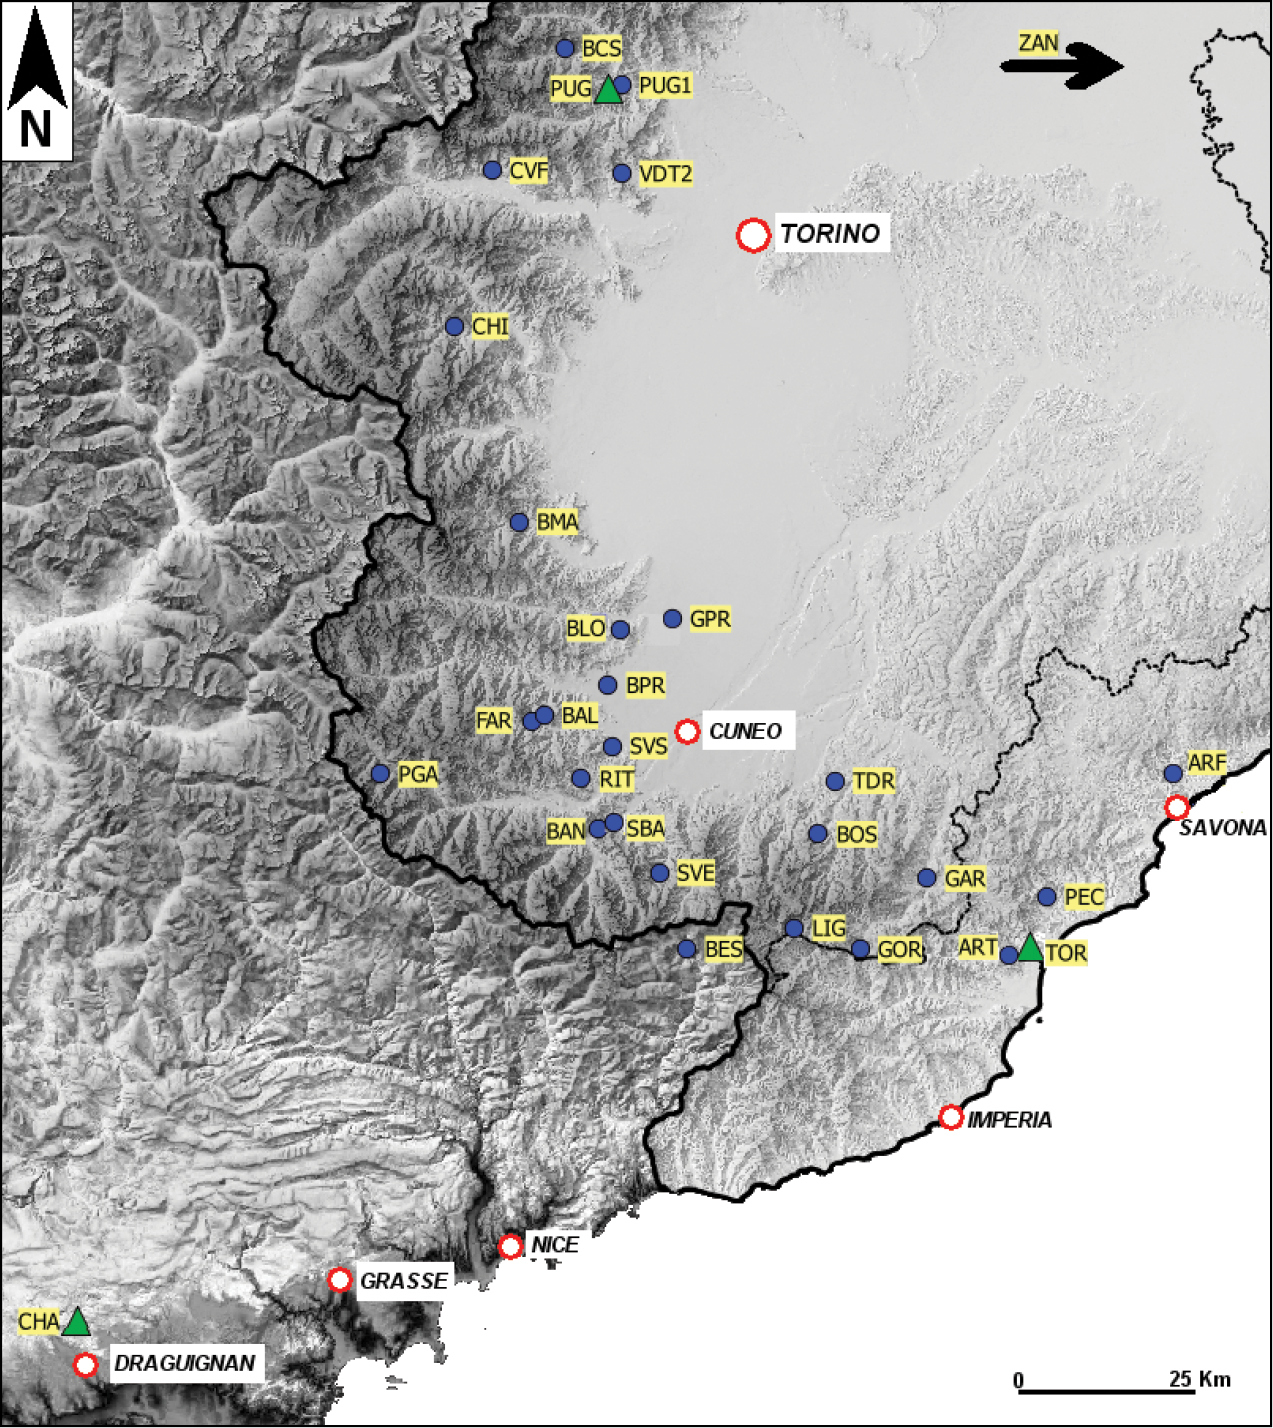
Sampling sites of Dolichopoda populations considered in this study (see also Table 1). Triangles indicate the type locality of the three considered taxa (CHA: Dolichopoda azami, TOR: Dolichopoda ligustica ligustica, PUG: Dolichopoda ligustica septentrionalis).
North Western Italian Dolichopoda sampled in this study. All populations were analyzed at molecular level, while only the populations in which adults were present, were analyzed also at morphological level.
| Taxon | Localities and sample size | Code | Morphology | GenBank Accession No. |
|---|---|---|---|---|
| Dolichopoda azami | Mine close to Chauves-souris Cave, Chateaudouble, Var, France, type locality, 525 m asl; Sampled individuals: 3 | CHA | X | 12S: KM086460; 16S: KM086485; COI: KM086535; 28S: KM086510 |
| Dolichopoda ligustica ligustica | Taragnina Cave, Balestrino, SV, Liguria, close to Santa Lucia Inferiore Cave, 310 m asl; Sampled individuals: 5 | ART | 12S: KM086464; 16S: KM086489; COI: KM086539; 28S: KM086514 | |
| Santa Lucia Inferiore Cave, Toirano, SV, Liguria, type locality, 194 m asl | TOR | X | ||
| Dolichopoda ligustica septentrionalis | Borna Maggiore del Pugnetto Cave, Mezzenile, Lanzo Valley, TO, Piedmont, type locality, 820 m asl; Sampled individuals: 8 | PUG | X | 12S: KM086474; 16S: KM086499; COI: KM086549; 28S: KM086524 |
| Dolichopoda sp. | Tana del Peccetto Cave, Magliolo, SV | PEC | X | |
| Besta Cave, Vievola, Tenda, France, 910 m asl; Sampled individuals: 2 | BES | X | 12S: KM086459; 16S: KM086484; COI: KM086534; 28S: KM086509 | |
| Falconiere Cave, Garessio, CN, Piedmont, 1000 m asl | GAR | X | ||
| Orso Cave, Ponte di Nava, Ormea, CN, Piedmont, 808 m asl; Sampled individuals: 3 | GOR | 12S: KM086472; 16S: KM086497; COI: KM086547; 28S: KM086522 | ||
| Viozene, Ormea, upper Tanaro Valley, CN, Piedmont (epigean), 1250 m asl; Sampled individuals: 2 | LIG | 12S: KM086470; 16S: KM086495; COI: KM086545; 28S: KM086520 | ||
| Vernante hypogeum, Vernante, Vermenagna Valley, CN, Piedmont, 800 m asl; Sampled individuals: 5 | SVE | X | 12S: KM086458; 16S: KM086483; COI: KM086533; 28S: KM086508 | |
| Bossea Cave, Frabosa Soprana, Corsaglia Valley, CN, Piedmont, 836 m asl; Sampled individuals: 2 | BOS | X | 12S: KM086465; 16S: KM086490; COI: KM086540; 28S: KM086515 | |
| Arma de Faie Cave, Albissola, Sansobbia Valley, SV, Liguria, 624 m asl | ARF | X | ||
| Bandito Cave, Valdieri, Gesso Valley, CN, Piedmont, 726 m asl; Sampled individuals: 2 | BAN | X | 12S: KM086471; 16S: KM086496; COI: KM086546; 28S: KM086521 | |
| Bandito hypogeum, Roaschia, Gesso Valley, CN, Piedmont, 730 m asl; Sampled individuals: 7 | SBA | X | 12S: KM086463; 16S: KM086488; COI: KM086538; 28S: KM086513 | |
| Dronera Cave, Vicoforte Mondovì, Ermetta Valley, CN, Piedmont, 525 m asl; Sampled individuals: 6 | TDR | X | 12S: KM086468; 16S: KM086493; COI: KM086543; 28S: KM086518 | |
| Rittana Cave, Rittana, Stura di Demonte Valley, CN, Piedmont, 1000 m asl; Sampled individuals: 3 | RIT | X | 12S: KM086467; 16S: KM086492; COI: KM086542; 28S: KM086517 | |
| Vallone Saben eastern hypogeum, Valdieri, Gesso Valley, CN, Piedmont, 750 m asl; Sampled individuals: 6 | SVS | X | 12S: KM086462; 16S: KM086487; COI: KM086537; 28S: KM086512 | |
| Gaiola Cave, Gaiola, Stura di Demonte Valley, CN, Piedmont, 1020 m asl; Sampled individuals: 3 | PGA | X | 12S: KM086457; 16S: KM086482; COI: KM086532; 28S: KM086507 | |
| Farout Cave, Pradleves, Grana Valley, CN, Piedmont, 1050 m asl; Sampled individuals: 3 | FAR | X | 12S: KM086461; 16S: KM086486; COI: KM086536; 28S: KM086511 | |
| Balmarossa Cave, Pradleves, Grana Valley, CN, Piedmont, 1180 m asl; Sampled individuals: 2 | BAL | X | 12S: KM086452; 16S: KM086477; COI: KM086527; 28S: KM086502 | |
| Buco del Partigiano Cave, Roccabruna, Maira Valley, CN, Piedmont, 1100 m asl; Sampled individuals: 7 | BPR | 12S: KM086455; 16S: KM086480; COI: KM086530; 28S: KM086505; | ||
| Partigiani Cave, Rossana, Varaita Valley, CN, Piedmont, 615 m asl; Sampled individuals: 8 | GPR | X | 12S: KM086469; 16S: KM086494; COI: KM086544; 28S: KM086519 | |
| Buco delle Locuste Cave, Pagliano, Varaita Valley, CN, Piedmont, 595 m asl; Sampled individuals: 2 | BLO | X | 12S: KM086466; 16S: KM086491; COI: KM086541; 28S: KM086516 | |
| Buco del Maestro Cave, Paesana, Po Valley, CN, Piedmont, 750 m asl; Sampled individuals: 6 | BMA | 12S: KM086453; 16S: KM086478; COI: KM086528; 28S: KM086503; | ||
| Chiabrano Cave, Perrano, Germanasca Valley, TO, Piedmont, 1080 m asl; Sampled individuals: 6 | CHI | X | 12S: KM086456; 16S: KM086481; COI: KM086531; 28S: KM086506 | |
| Villar Focchiardo Cave, Villar Focchiardo, Susa Valley, TO, Piedmont, 460 m asl; Sampled individuals: 6 | CVF | 12S: KM086473; 16S: KM086498; COI: KM086548; 28S: KM086523 | ||
| Val della Torre Mine, Val della Torre, Casternone Valley, TO, Piedmont, 840 m asl; Sampled individuals: 5 | VDT2 | 12S: KM086475; 16S: KM086500; COI: KM086550; 28S: KM086525 | ||
| Wolf Cave, Mezzenile, Lanzo Valley TO, Piedmont, 813 m asl; Sampled individuals: 4 | PUG1 | X | Same as PUG | |
| Borna del Servais Cave, Ala di Stura, Ala Valley, TO, Piedmont, 1440 m asl; Sampled individuals: 2 | BCS | 12S: KM086454; 16S: KM086479; COI: KM086529; 28S: KM086504; | ||
| Lacca Selva Cave, Zandobbio, BG, Lombardy, 340 m asl; Sampled individuals: 2 | ZAN | X | 12S: KM086476; 16S: KM086501; COI: KM086551; 28S: KM086526 |
DNA was isolated from leg muscle of each individual, using a GenElute Mammalian Genomic DNA minipreparation Kit (Sigma-Aldrich, St. Louis, MO, USA) resuspended in 200 μl of sterile water and stored at -40 °C.
The entire Cytochrome Oxidase I gene (COI, total of 1500 bp), a 550-bp fragment of the 16S rRNA gene, a 450-bp fragment of the 12S rRNA gene and were amplified through the polymerase chain reaction (PCR) and sequenced from each individual. The large subunit of the nuclear ribosomal DNA (28S rRNA) was also included. The primers used were: LCO1490, HCO 2198 (
Each gene fragment (12S, 16S, COI and 28S) was considered separately for the alignment. Sequences of 16S, 12S and 28S were aligned using CLUSTAL_X 1.81 (
Haplotype and nucleotide diversity were calculated using DNASP 5.10 (
A Mantel test (
The hierarchical distribution of genetic variation was characterized using analysis of molecular variance (AMOVA). This method apportions genetic variation within and among groups, estimating F-statistics (
Species delimitation analysis was carried out with two methods, a) the ”classical” DNA barcoding gap analysis (
Species, populations, localities and accession numbers to GenBank for the Dolichopoda sequences included in this study and retrieved from GenBank for phylogenetic reconstruction of the western Mediterranean Dolichopoda species (Data from
| Taxon | Localities | GenBank Accession No. |
|---|---|---|
| Outgroup | ||
| Euhadenoecus insolitus | Indian Grave Point Cave (IND), De Kalb Co., TN, USA | 12S: EF216947; 16S: AY793563; COI: AY793591; 28S: EF217005 |
| Hadenoecus cumberlandicus | Bat Cave (BAT), Carter Cave State Park, Carter Co., KY, USA | 12S: EF216948; 16S: AY793562; COI: AY793592; 28S: EF217004 |
| Troglophilus cavicola | Covoli di Velo Cave (TRO), Veneto, Northern Italy | 12S: EF216946; 16S: AY793564; COI: AY793624; 28S: EF217003 |
| Ingroup | ||
| Dolichopoda bolivari | Forat negre Cave, Serra del Llerida, Pyrenees, Spain | 16S: AY507579-80, COI: AY507648-49 |
| Dolichopoda linderi | Sirach Cave (SIR) Eastern Pyrenees, Western-South France | 12S: JF826039; 16S: AY793567; COI: AY793598-99; 28S: JF826069 |
| Dolichopoda laetitiae | Poscola Cave (PSC), Veneto, Northern-East Italy | 12S: JF826054; 16S: AY793581; COI: AY793611 and 13; 28S: JF826076 |
| Piane Cave (GDP), Umbria, Central Italy | 12S: JF826053; 16S: AY793582; COI: AY793610 and 12; 28S: JF826075 | |
| Diavolo Cave (DIA), Tuscany, Central Italy | 12S: JF826052; 16S: AY793580; COI: AY793614-15; 28S: JF826074 | |
| Dolichopoda geniculata | Valmarino Cave (VAL), Latium, Central-South Italy | 12S: JF826055; 16S: AY793583; COI: AY793616-17; 28S: JF826077 |
| Fontanelle Cave (FON), Campania, Southern-West Italy | 12S: JF826057; 16S: AY793584; COI: AY793594; 28S: JF826079 | |
| Ischia cellars (ISC), Ischia Island, Campania, Southern-West Italy | 12S: JF826058; 16S: AY793585; COI: AY793595; 28S: JF826080 | |
| Roman Aqueduct (PNZ), Ponza Island, Latium, Southern-West Italy | 16S: AY793586; COI: AY793596-97 | |
| Dolichopoda capraensis | San Michele Cave (CPR), Capri Island, Campania, Southern Italy | 12S: JF826059; 16S: AY793587; COI: AY793606-7; 28S: JF826081 |
| Dolichopoda palpata | Tremusa cave (TRE), Calabria, Southern Italy | 12S: JF826060; 16S: AY793588; COI: AY793608-9; 28S: JF826082 |
| Dolichopoda baccettii | Punta degli Stretti Cave (PST), Tuscany, Central-West Italy, | 12S: JF826046; 16S: AY793571; COI: AY793639-40; 28S: JF826068 |
| Dolichopoda aegilion | Campese Mine (CAM), Giglio Island, Tuscany, Central-West Italy | 12S: JF826045; 16S: AY793570; COI: AY793600; 28S: JF826067 |
| Dolichopoda schiavazzii | Pipistrelli Cave (ORS), Tuscany, Central-West Italy | 12S: JF826044; 16S: AY793573; COI: AY793633; 28S: JF826066 |
| Marciana Cave (MRC), Elba Island, Tuscany, Central-West Italy | 12S: JF826043; 16S: AY793572; COI: AY793635; 28S: JF826065 | |
| Fichino Cave (FIC), Tuscany, Central-West Italy | 12S: JF826042; 16S: AY793574; COI: AY793634-36; 28S: JF826064 | |
| Dolichopoda bormansi | Brando Cave (BRA), Corsica Island, France | 12S: JF826047; 16S: AY793578; COI: AY793627 and 31-32; 28S: JF826069 |
| Sisco Cave (SIS), Corsica Island, France | 12S: JF826048; 16S: AY793579; COI: AY793625-26 and 28; 28S: JF826070 | |
| Dolichopoda cyrnensis | Valletto Cave (VLT), Corsica Island, France | 12S: JF826050; 16S: AY793577; COI: AY793620-21; 28S: JF826072 |
| Sabara Cave (SAB), Corsica Island, France | 12S: JF826049; 16S: AY793576; COI: AY793618-19; 28S: JF826071 | |
| Dolichopoda muceddai | Limbara Mount, Sardinia Island, Italy | 12S: JF826051; 16S: AY793575; COI: AY793629-30; 28S: JF826073 |
The ABGD method (
A phylogenetic analysis was carried out considering the four sequenced genes, by constructing a concatenated matrix, partitioned by genes. Phylogenetic analysis was performed only on the western Mediterranean Dolichopoda species, using Bayesian inferences as implemented by the software MrBayes 3.1b4 (
At least two simultaneous searches were conducted comprising four Markov chains started from a randomly chosen tree and run for 1, 000, 000 generations, with sampling every 100 generations. The following descriptors were assumed to indicate convergence on a common phylogenetic topology by separate Bayesian searches: similarity in log likelihood scores at stationarity, similarity in consensus tree topologies and PP values for supported nodes, and a final average standard deviation of split frequencies (ASDSF) for simultaneous searches approaching zero. The first 1, 000 trees were discarded as burn-in and posterior probabilities (PP) were calculated from post burn-in trees.
The most important morphological characters used in the systematics of the genus Dolichopoda are the shape of the epiphallus and of the male tergum 10. In this study, the investigation of these characters was integrated by the analysis of other morphological features as male sub-genital fig, female sub-genital fig and shape of ovipositor.
Overall, we have checked 22 populations from the northwestern Italy for a total of 64 adult individuals. All these populations are the same analyzed for the genetic variation (Table 1). Further comparisons were made using three more samples (PEC, ARF, GAR) coming from the collection of Museum of Natural History of Genoa G. Doria. The specimens were studied using a stereomicroscope Leica MZ 12.5. All the measures of the morphological parameters are in mm. Photos were taken with a digital camera, Nikon Coolpix P300. Pictures were processed using a digitiser board WACOM CTH 461 and Adobe Photoshop CS3 Extended Version 10.0.
Table 3 shows the measures of twelve morphological characters in 6 populations where a sufficient number of adults were available. In particular, we considered the total body length, the pronotum length, and the length of tarsum, femur and tibia of the fore, middle and hind legs in both males and females and the ovipositor length in females. Measurements were taken using a digital caliper (accuracy 0.01 mm). Morphometric variables were analyzed by using the non-parametric ANOVA Kruskal-Wallis test. A multiple regression analysis was carried out comparing morphometric variables with the altitude of the caves.
Measures (min and max in mm) of 12 morphological characters in six samples of northwestern Italian Dolichopoda taxa.
| CHA | BES | CHI | FAR | TOR | PEC | |||||||
|---|---|---|---|---|---|---|---|---|---|---|---|---|
| ♂ n=4 | ♀ n=3 | ♂ n=4 | ♀ n=2 | ♂ n=4 | ♀ n=4 | ♂ n=4 | ♀ n=5 | ♂ n=3 | ♀ n=4 | ♂ n=2 | ♀ n=1 | |
| Body | 16.0–16.5 | 17.0–18.0 | 14.0–16.0 | 14.0–15.0 | 15.0–16.0 | 15.0–17.0 | 14.0–15.5 | 15.0–18.0 | 17.0–21.0 | 19.0–21.0 | 16.0–17.0 | 16.0 |
| Pronotum | 4.0–5.0 | 4.0 | 3.5–4.0 | 3.5–4.0 | 3.8–4.0 | 4.0 | 4.0–4.5 | 4.0–4.5 | 4.0 | 4.0–4.5 | 4.0 | 4.0 |
| Fore tibia | 15.0–17.0 | 14.5–15.0 | 14.5–17.0 | 13.0–14.0 | 14.5–15.5 | 13.0–14.0 | 14.0–16.0 | 13.5–15 | 17.0–18.5 | 15.0–17.0 | 14.0–15.5 | 14.5 |
| Fore femur | 15.5–16.0 | 14.0 | 14.0–15.5 | 12.0–13.0 | 14.0–15.0 | 12.0–13.0 | 13.0–15.0 | 12.0–14.0 | 14.5–17.0 | 14.0–16.0 | 14.0–15.0 | 14.0 |
| Fore tarsum | 7.0–7.5 | 6.0–7.0 | 6.0–7.0 | 5.0 | 6.0–7.0 | 5.0–6.0 | 5.0–6.5 | 5.0–6.0 | 6.0–7.5 | 6.0–7.0 | 5.5–6.5 | 6.0 |
| Medium tibia | 17.0 | 14.5–16.0 | 15.0–16.5 | 13.0–14.0 | 15.0–16.0 | 13.0–14.0 | 13.0–16.0 | 13.5–15.0 | 17.0–19.0 | 16.0–17.0 | 14.0–16.0 | 15.0 |
| Medium femur | 16.0–16.5 | 14.0 | 14.5–15.5 | 12.0 | 14.0–15.0 | 12.0–13.0 | 13.0–15.0 | 12.5–14.0 | 15.0–17.0 | 14.0–16.0 | 14.0–15.0 | 13.0 |
| Medium tarsum | 6.0 | 5.0 | 5.0–6.0 | 5.0 | 5.0–5.5 | 4.5–5.0 | 5.0–6.0 | 4.5–5.0 | 6.0–6.5 | 5.0–6.0 | 5.5–6.0 | 5.0 |
| Hind tibia | 30.0–32.0 | 30.0–34.0 | 25.0–29.0 | 25.0–27.0 | 23.5–27.0 | 24.0–25.0 | 24.5–27.5 | 25.0–27.5 | 26.5–34 | 30.0–32.0 | 27.0–29.0 | 28.0 |
| Hind femur | 25.5–26.5 | 25.0–26.5 | 22.5–24.5 | 22.0–23.0 | 21.0–24.0 | 22.0–22.5 | 22.0–24.0 | 22.0–23.5 | 24.0–27.0 | 23.5–27.0 | 22.0–24.0 | 24.0 |
| Hind tarsum | 6.0–7.0 | 6.0 | 5.5–6.0 | 5.0–6.0 | 4.0–6.0 | 4.0–5.5 | 5.5–6.0 | 5.0 | 6.0–7.0 | 5.5–6.0 | 5.5–6.5 | 5.5 |
| Ovipositor | 13.0–14.0 | 11.0 | 12.0–13.0 | 10.0–13.0 | 11.0–13.0 | 12.0 | ||||||
A total of 2450 mitochondrial base pairs corresponding to the entire COI gene, to 450 bp of 12S and 550 bp of 16S were successfully sequenced and aligned in 104 specimens of Dolichopoda populations from northwestern Italy. 28S rRNA, consisting of 500 bp was also sequenced in all considered samples. Ribosomal genes were identical in all assayed samples. Therefore, the analysis was limited to the COI mitochondrial gene.
The 104 individual COI sequences comprised a total of 15 haplotypes determined by 13 segregating sites. Global haplotype diversity, h, was 0.875 and nucleotide diversity, p, was 0.00231.
Dolichopoda haplotypes were organized in three main haplogroups in which haplotypes are ordered geographically (Fig. 2). In particular, haplogroup 1 included samples from the northernmost area, haplogroup 2 samples from the westernmost area and haplogroup 3 consisted of samples from the south-eastern area (Fig. 2).
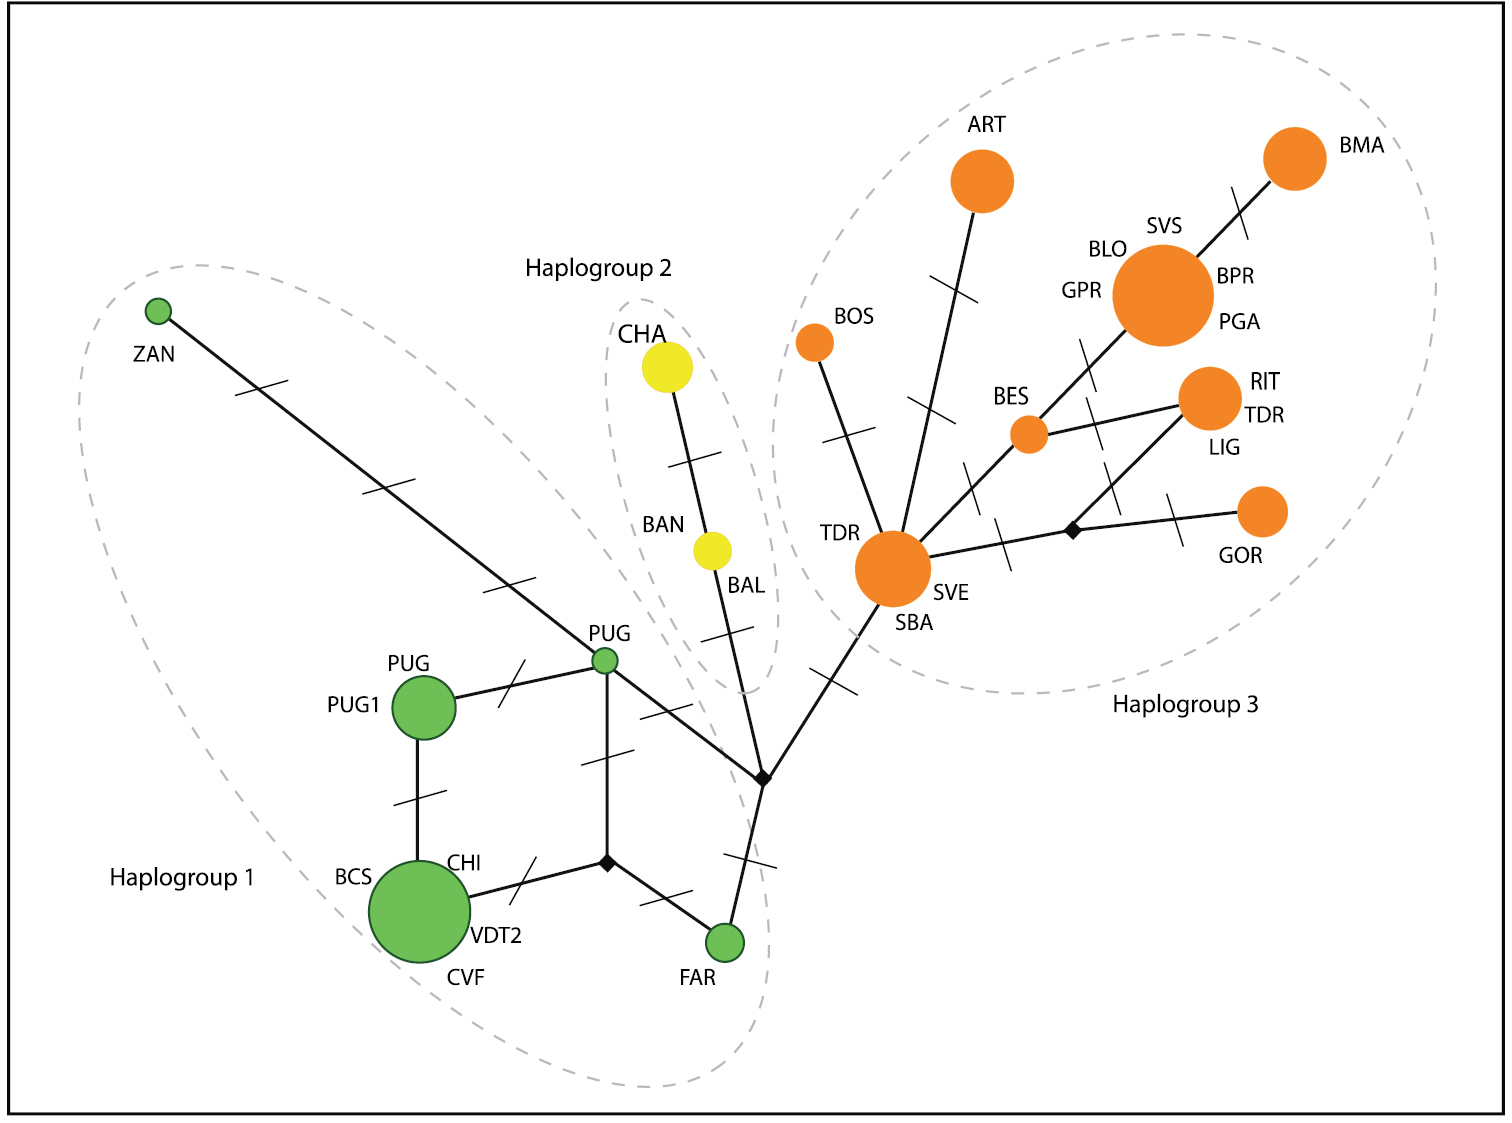
Median-joining network analysis in the populations of Dolichopoda considered in this study: circled areas are proportional to the number of individuals sharing the same haplotype; bars, along connections, indicate the number of nucleotide substitutions. Individuals from the same population can show different haplotypes. Based on number of nucleotide substitutions, three haplogroups can be distinguished, each indicated with different color.
To investigate this further we carried out a genetic distance analysis using COI gene as a barcode and p-distance between all studied Dolichopoda species (
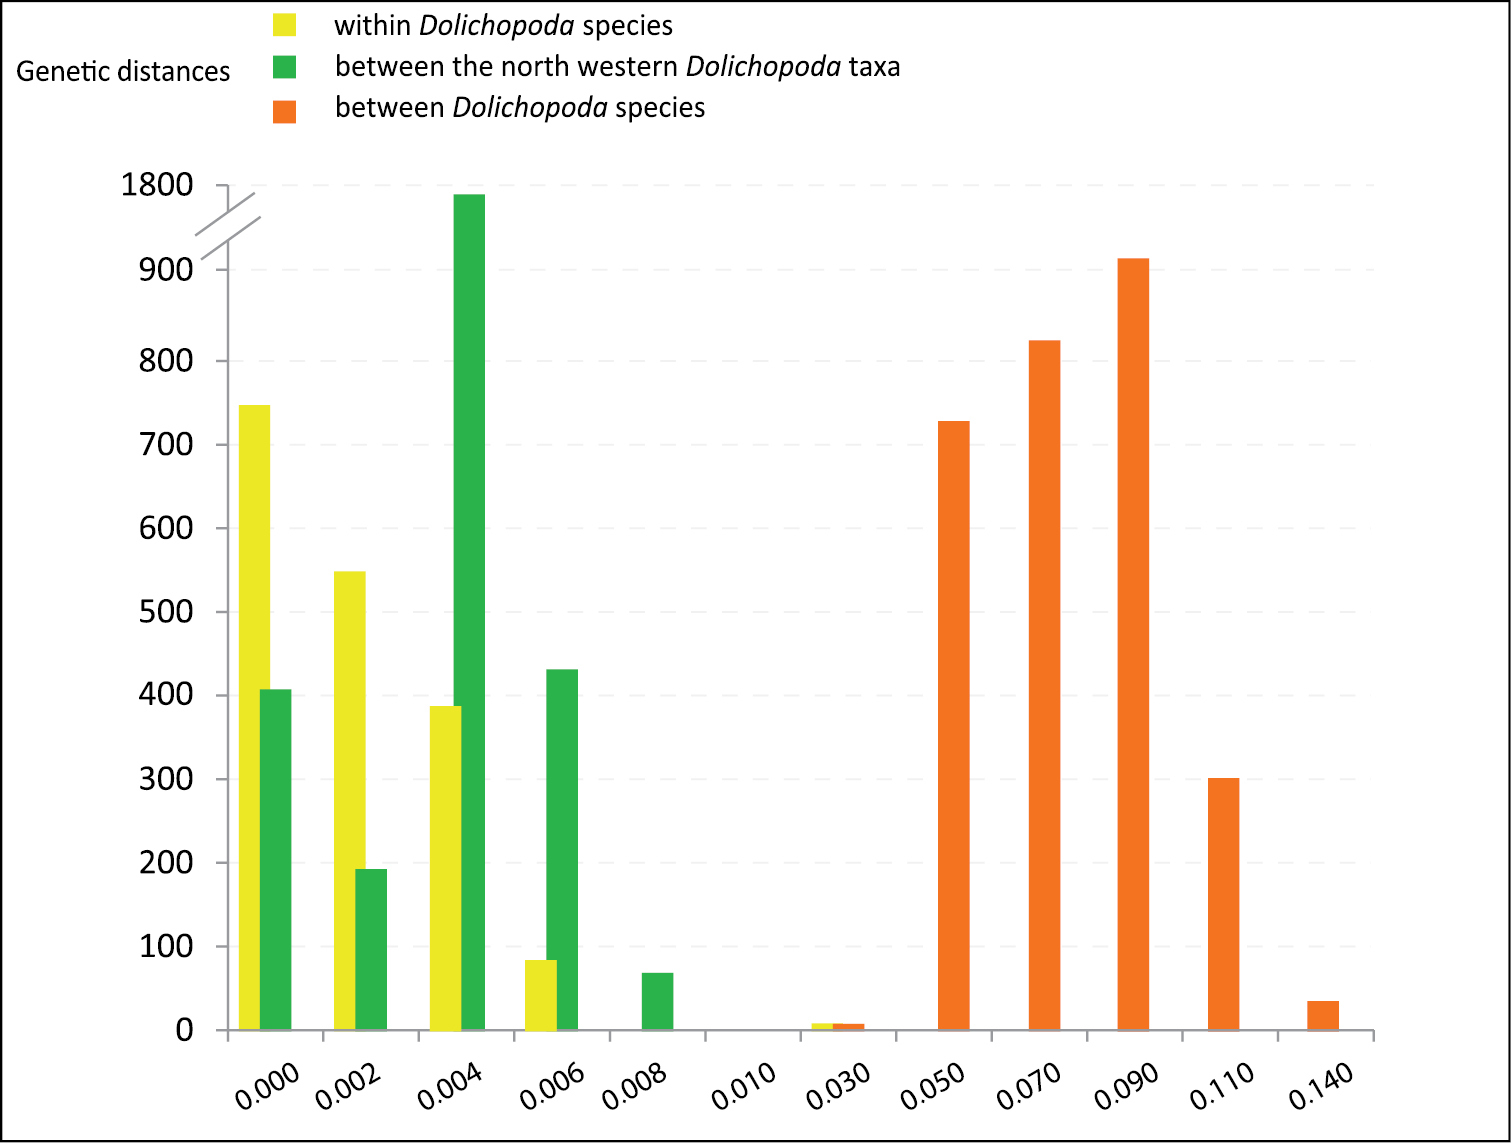
Distribution of genetic distance values (p-distances) at different taxonomic levels. Pairwise comparisons at the intra- and inter-specific level in all Dolichopoda species are reported.
ABGD analysis proposed several partitions that varied according to the different a priori thresholds. Apart from the two extreme a priori threshold values (P = 0.001 and P = 0.035), for which aberrant number of species hypotheses were obtained (almost every haplotype was considered as a different species hypothesis for P = 0.001 and, conversely, all the haplotypes were combined in a single species hypothesis for P = 0.035), all the tested a priori thresholds lead to the same splitting. The westernmost Dolichopoda taxa were grouped together, while the other groups corresponded to the nominal species.
Analysis of molecular variance (AMOVA;
MRMODELTEST (
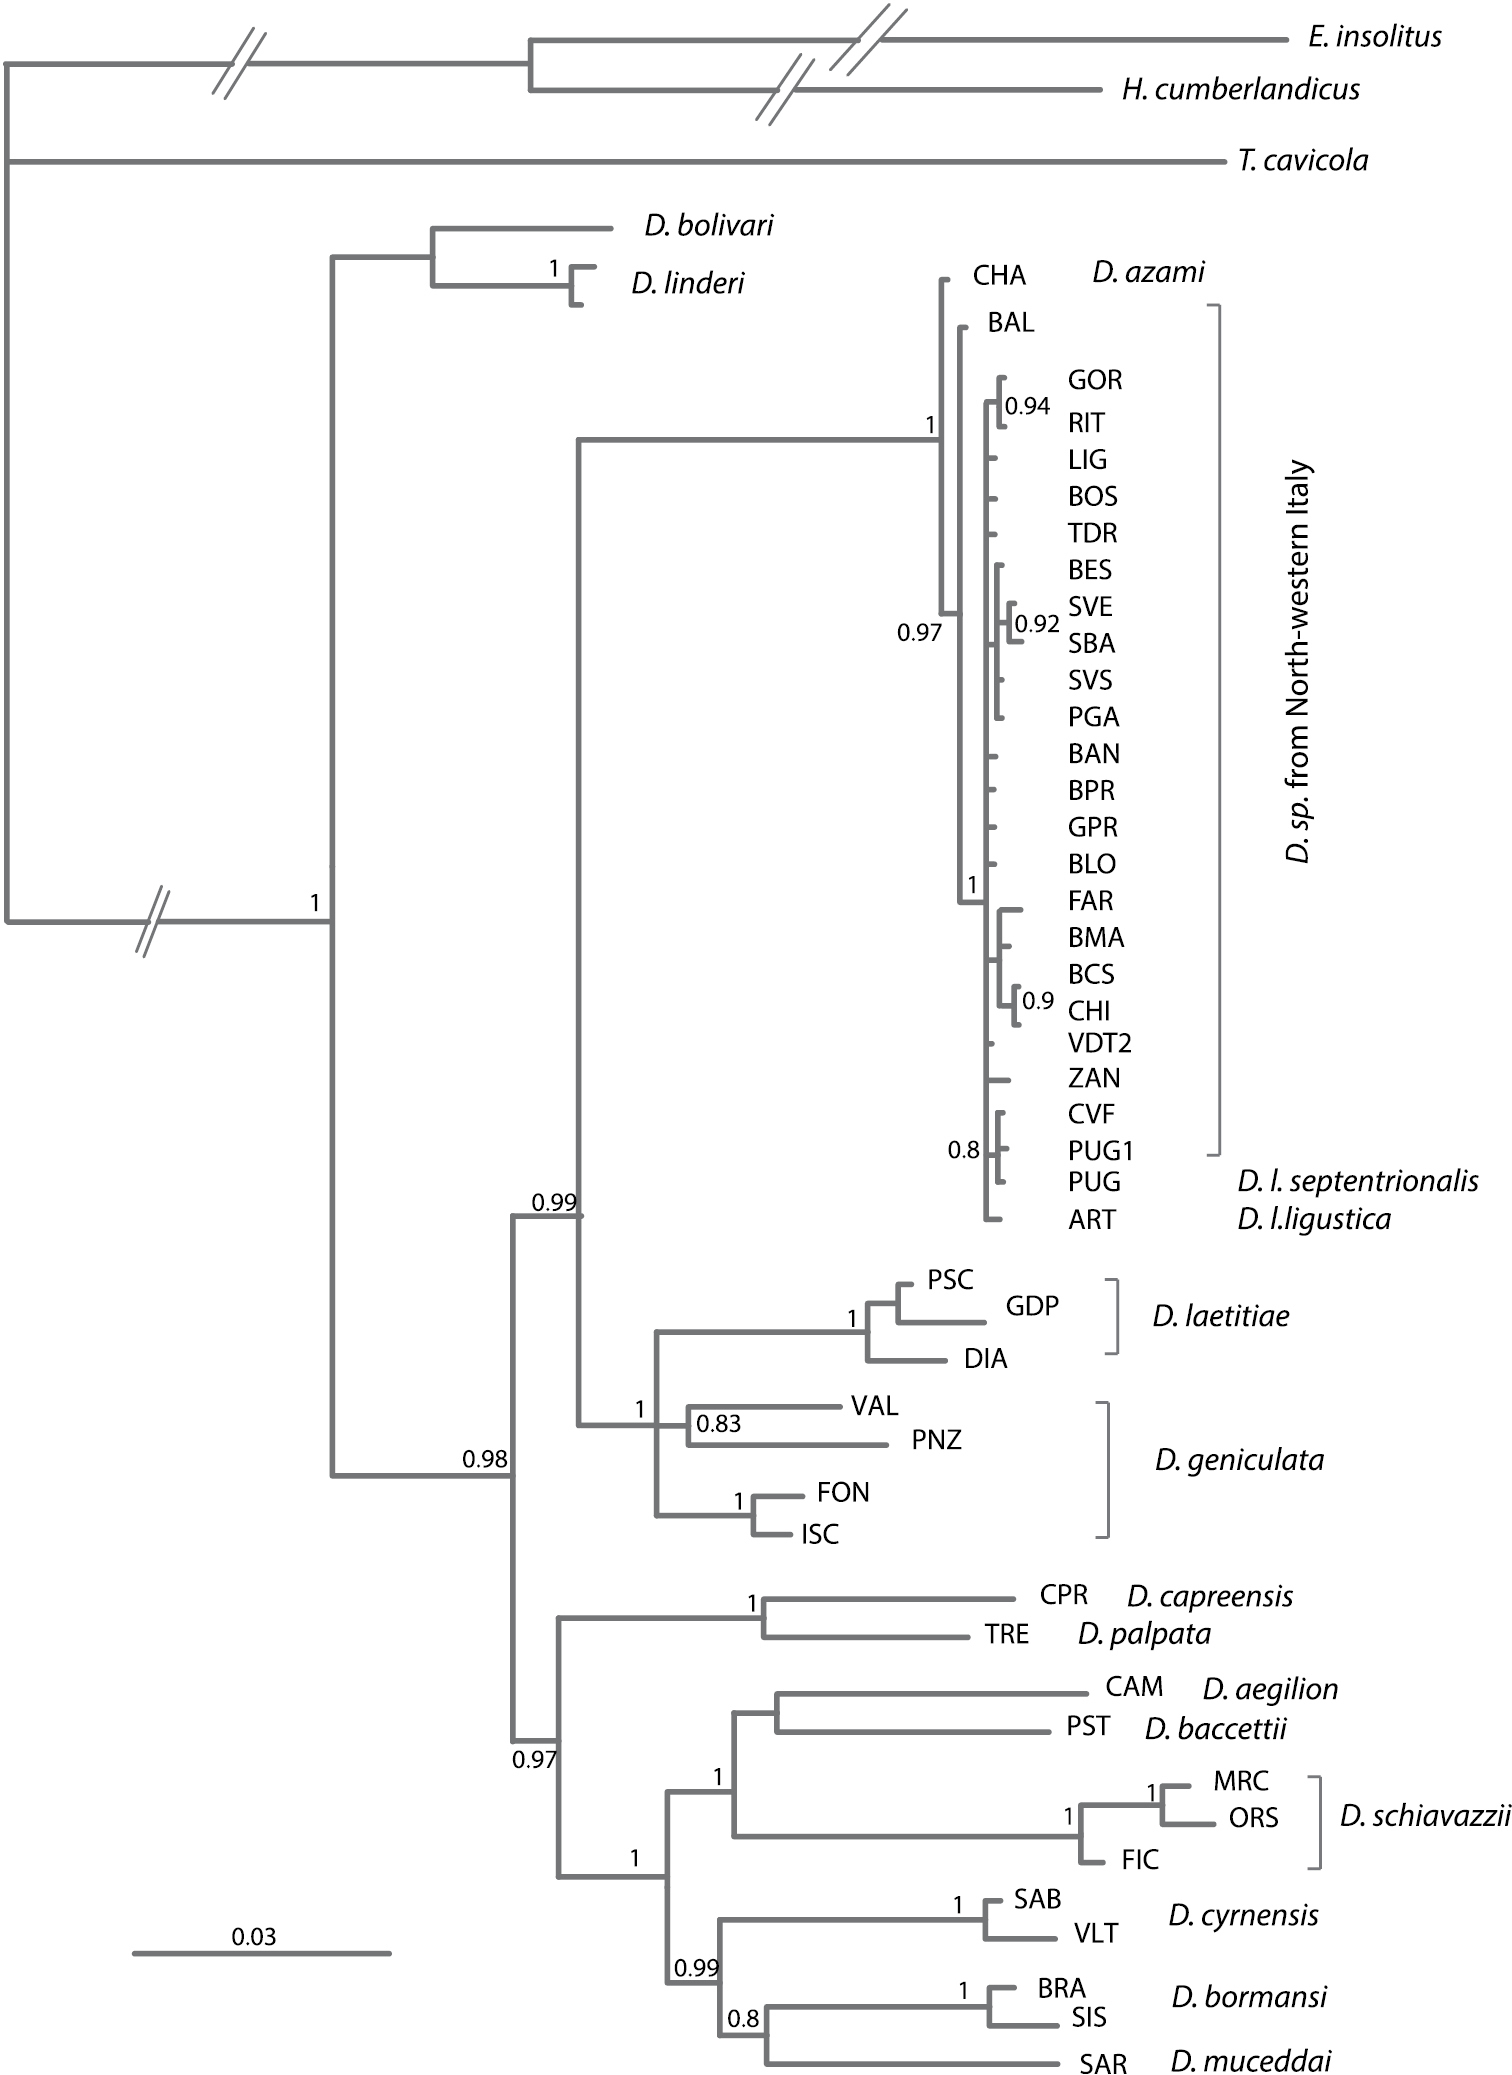
Relationships among Italian species of Dolichopoda inferred from Bayesian analysis based on three mitochondrial and one nuclear genes. Values above branches indicate posterior probabilities derived from Bayesian analysis. Scale bars: 0.03 substitutions per site. Only posterior probability (PP) values ≥ 0.80 are shown.
In Figures 5–13 morphological comparisons among the three samples from the typical locality of Dolichopoda azami (Chateaudouble, CHA), Dolichopoda ligustica (Toirano, TOR) and Dolichopoda ligustica septentrionalis (Pugnetto, PUG) are reported. In these figures, the three main characters are compared: male tergum 10, epiphallus and female sub-genital fig. The other two considered morphological features, male sub-genital fig and ovipositor, are not reported because showed a very uniform pattern. As already evidenced in the taxonomic revision of the genus Dolichopoda (
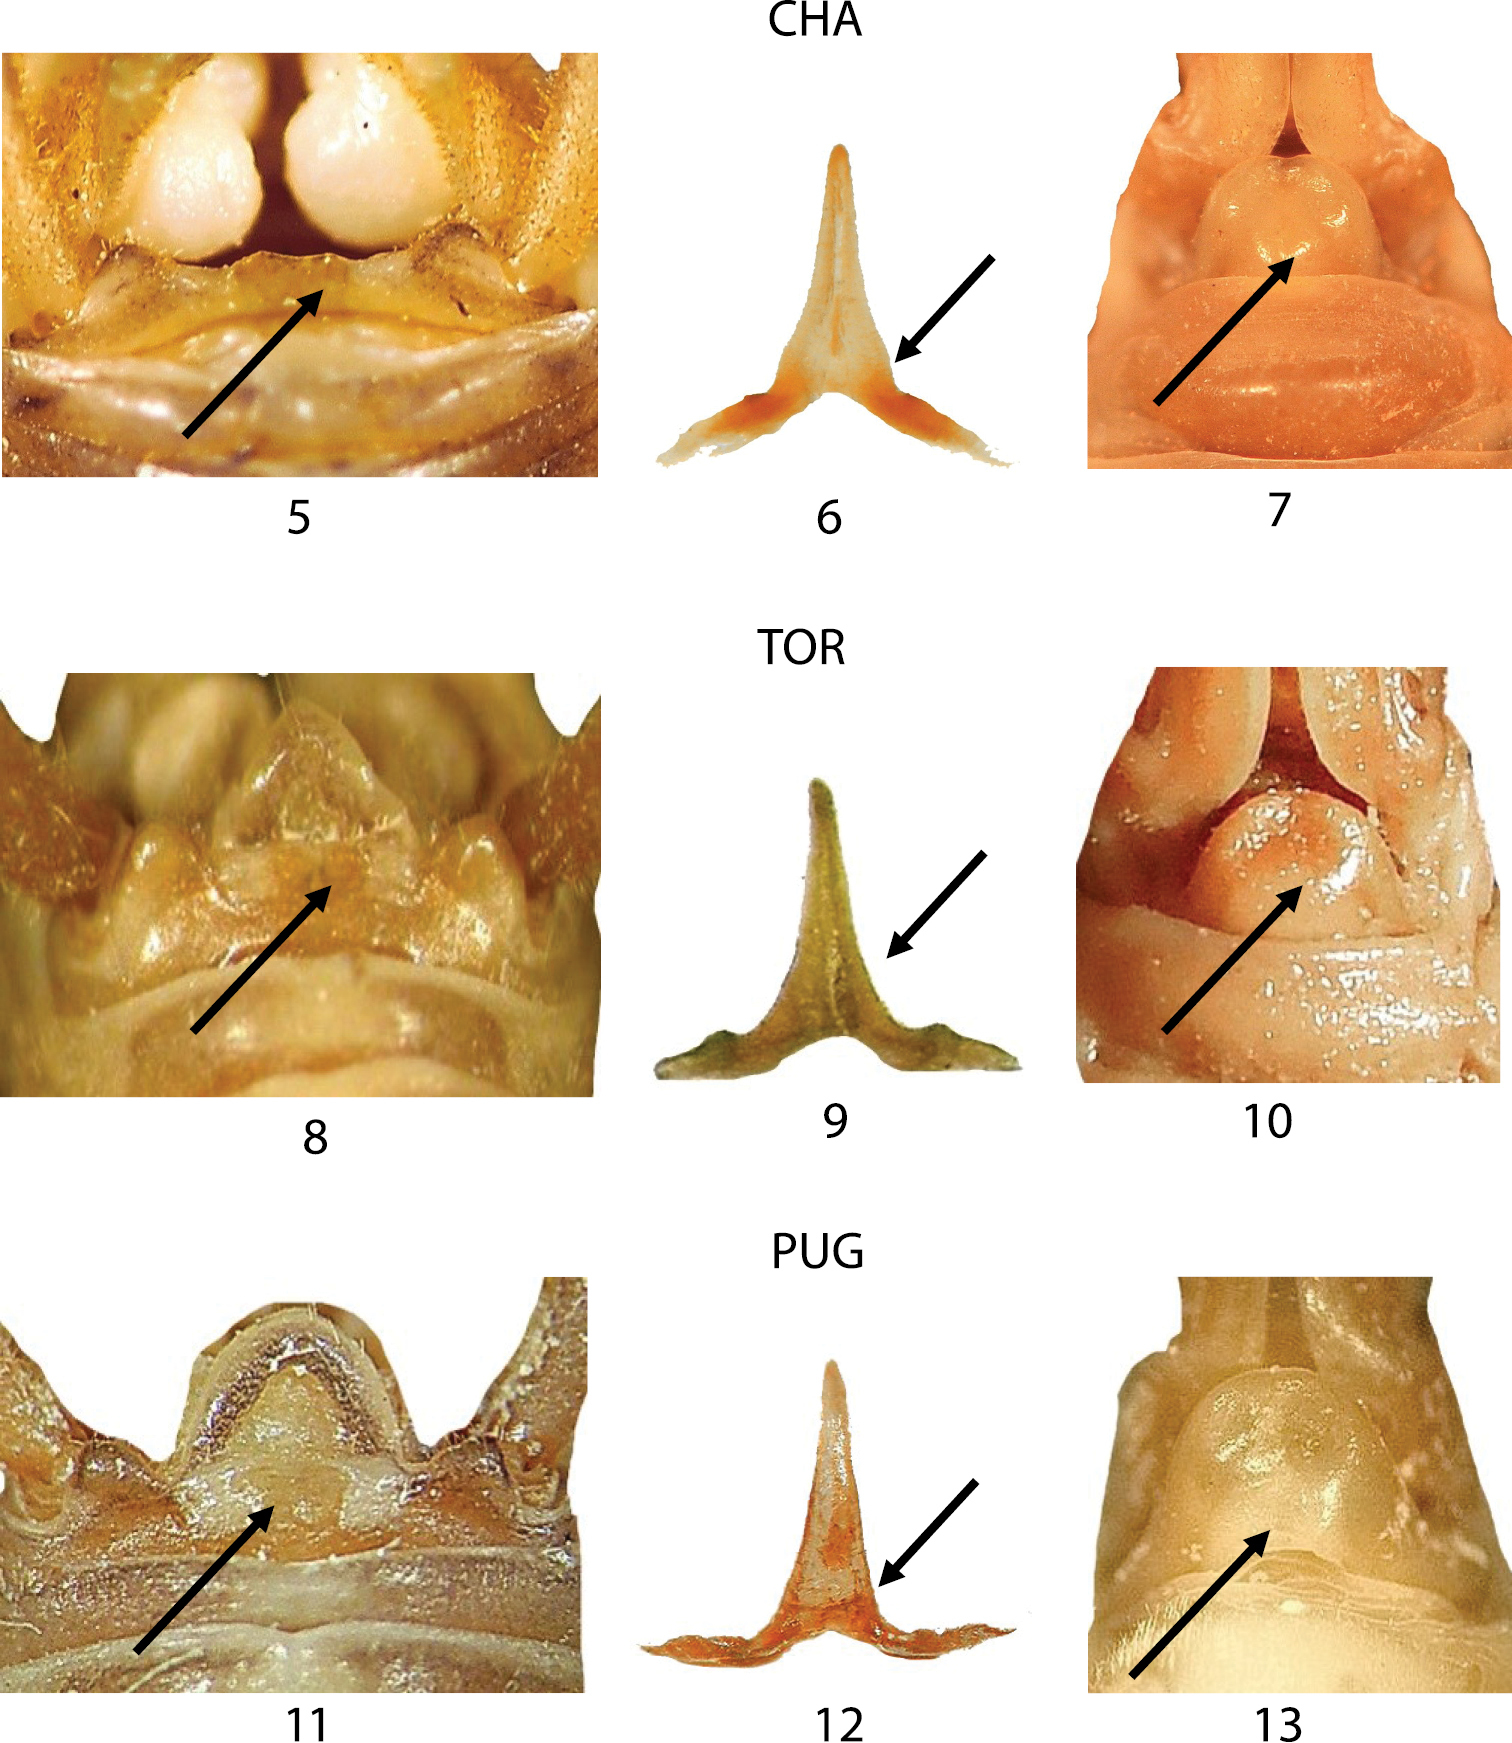
Morphological characters of Dolichopoda azami (CHA type locality), Dolichopoda ligustica ligustica (TOR type locality) and Dolichopoda ligustica septentrionalis (PUG type locality). Left: dorsal view of tergum 10; centre: epiphallus of the male; right: particular of the female sub-genital fig. Arrows show diagnostic characters.
In Figures 14–22, we compared three samples from western Liguria (Table 1). The three considered characters appear uniform resembling all to the morphology of TOR (Figs 8–10) the typical Dolichopoda ligustica. On the contrary, the analysis of a series of samples from northern and southern Piedmont (Figs 23–37) highlights a more complex situation with the contemporary presence of characters typical of one or the other species in the same individual. In particular, even if all the specimens analyzed show the tergum 10 very similar to that of Dolichopoda azami (cfr Fig. 5 with Figs 23, 26, 29, 32, 35) the same specimens often show the shape of epiphallus and of the female sub-genital fig more similar to that of Dolichopoda ligustica.
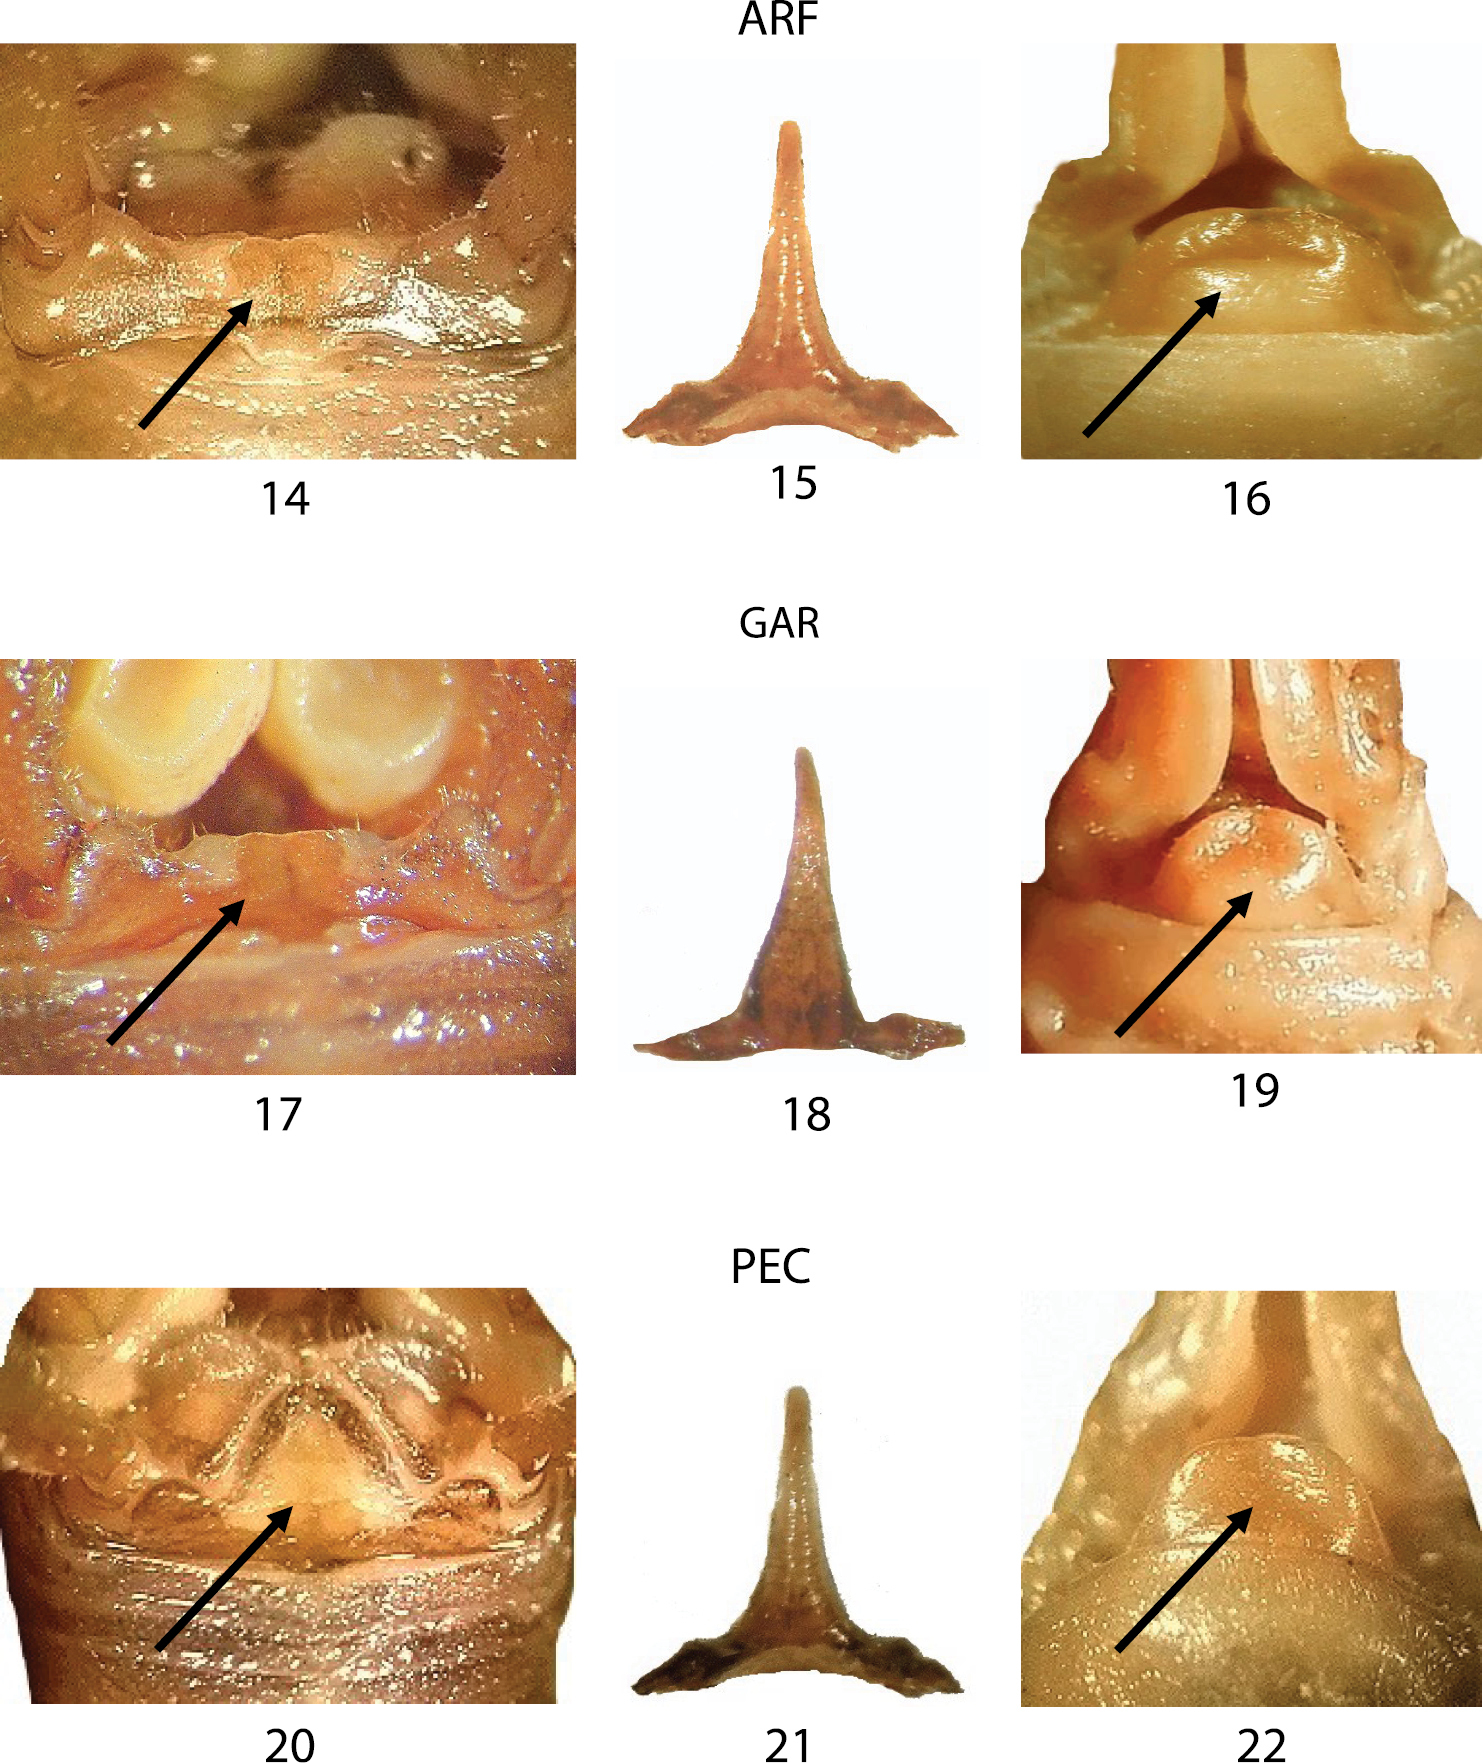
Morphological characters of the Dolichopoda from Liguria: ARF, GAR and PEC. Left: dorsal view of tergum 10; centre: epiphallus of the male; right: particular of the female sub-genital fig. Arrows show diagnostic characters.
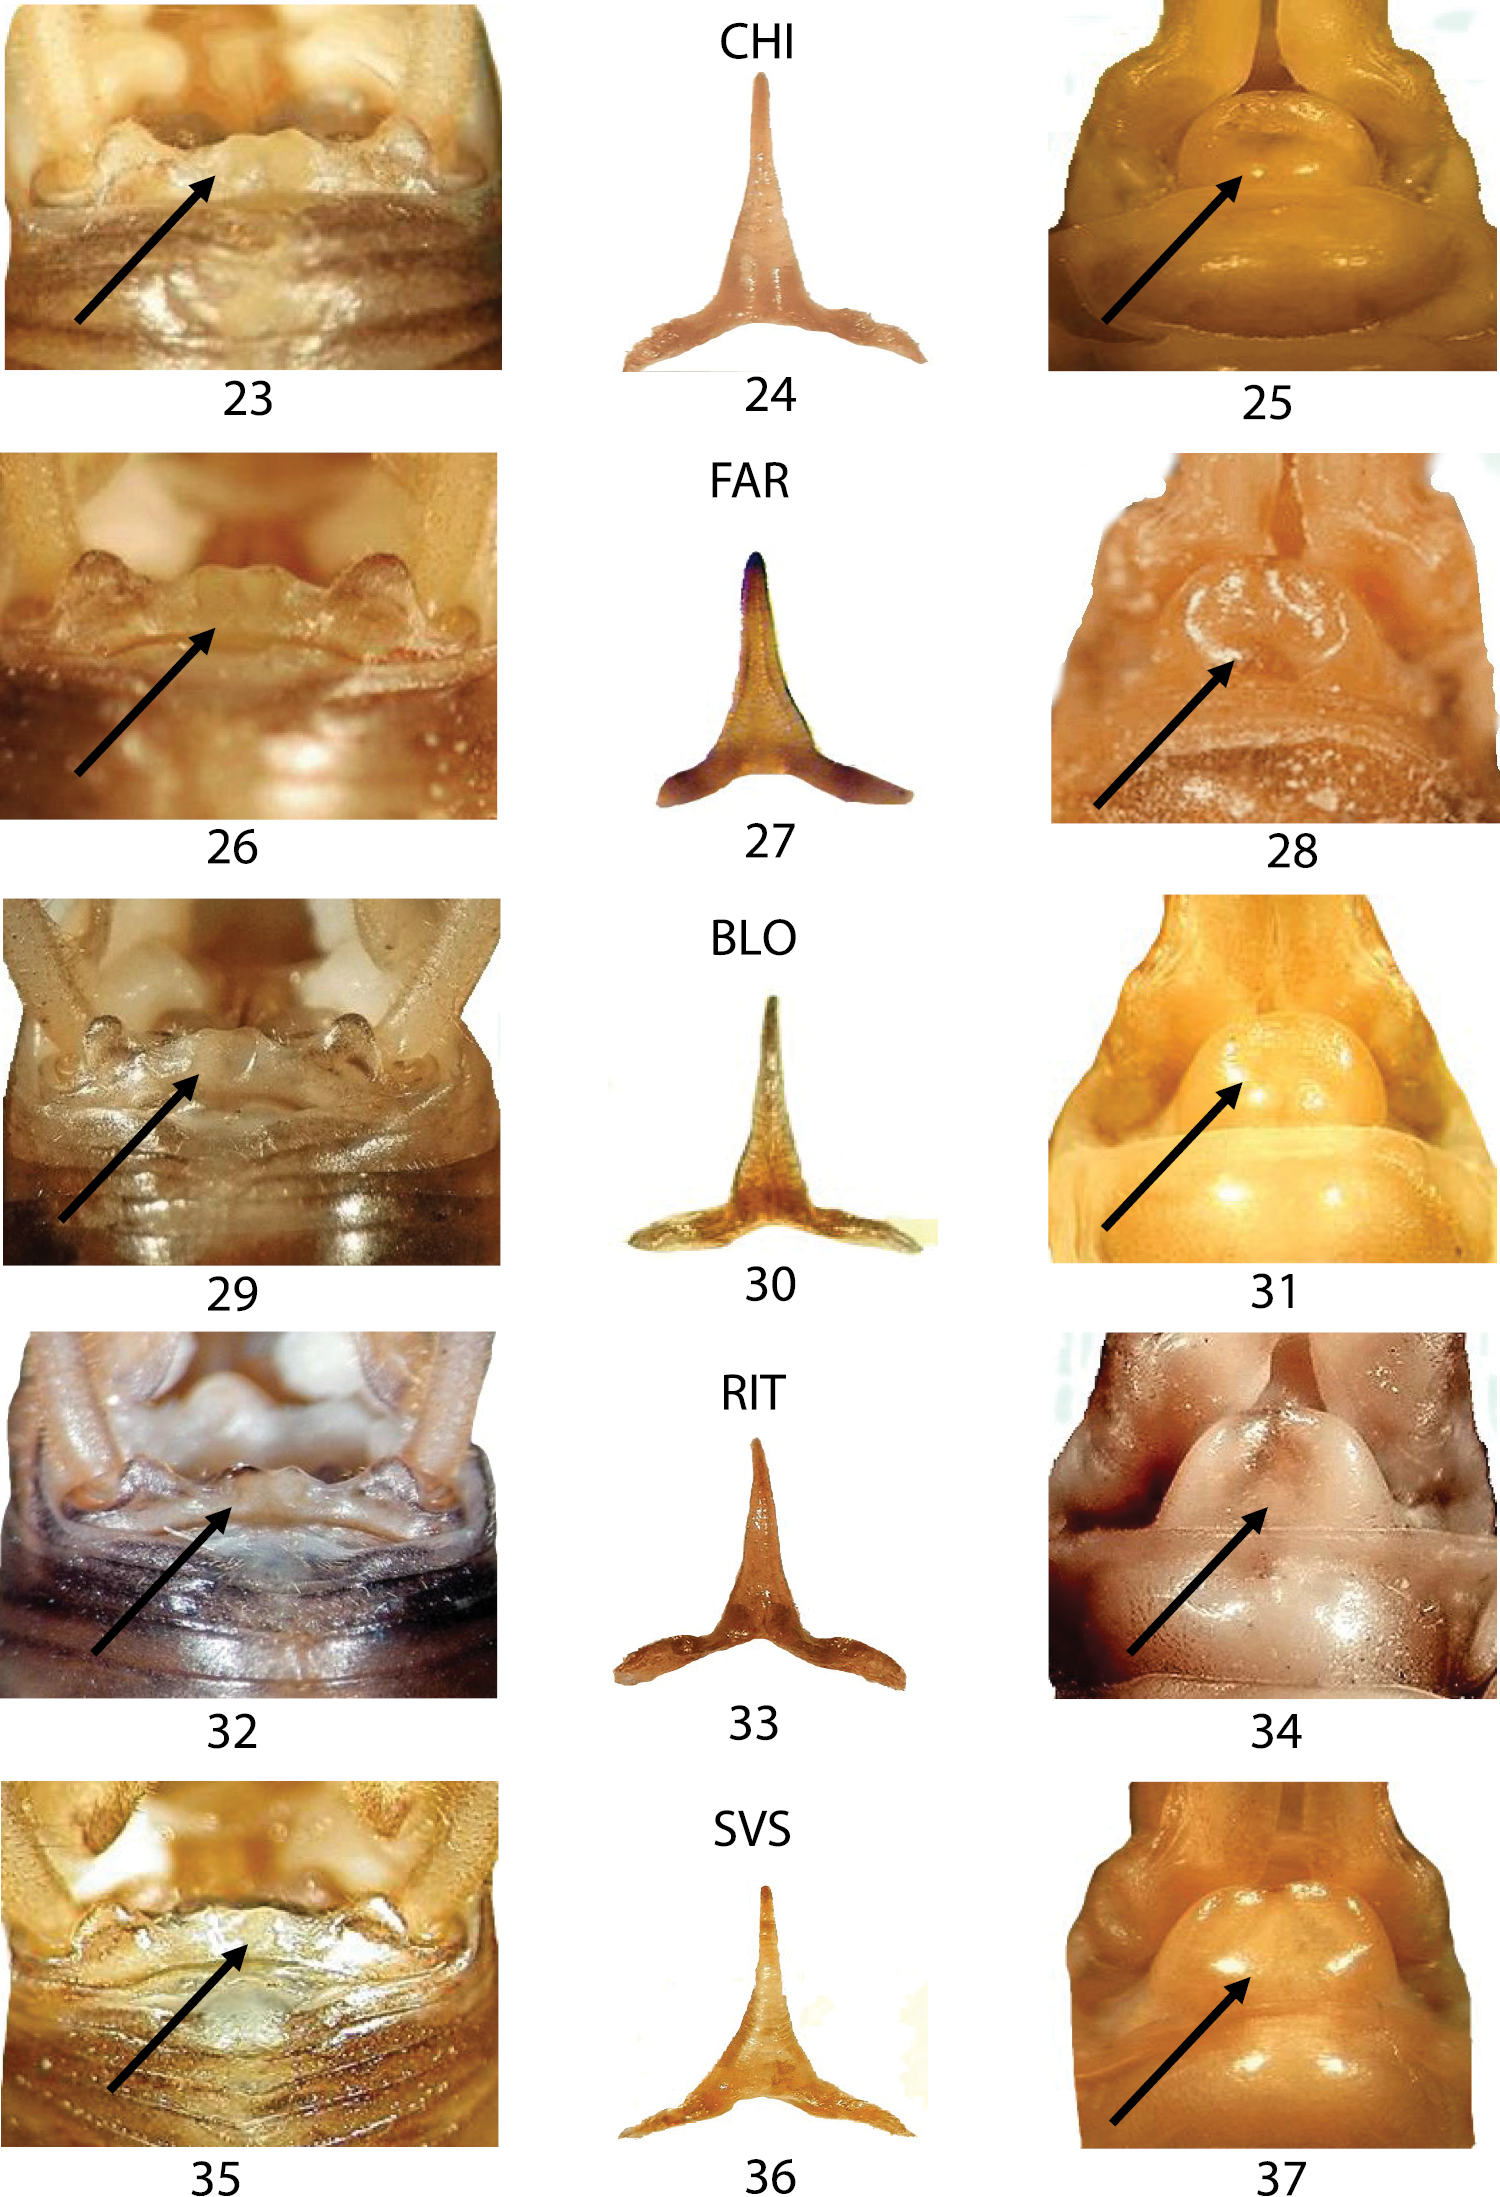
Morphological characters of the Dolichopoda from Piedmont: CHI, FAR, BLO, RIT and SVS. Left: dorsal view of tergum 10; centre: epiphallus of the male; right: detail of the female sub-genital fig. Arrows show diagnostic characters.
In Table 3, the measures of 12 morphological characters, recorded on 6 populations, where a sufficient number of adults were available, are reported. Mann-Whitney test carried out between males and females morphometric traits revealed significant differences (P < 0.05), being the females smaller than males. ANOVA analysis highlighted significant differences between some morphometric measures in specimens coming from caves situated at different altitude both in males and in females. Multiple regression analysis revealed a significant correlation between the morphometric measures and the altitude of the cave (R2 = 0.661, Wilk’s lbd = 0.0045; P << 0.01). In particular, samples coming from caves at low altitudes resulted bigger than those from caves at higher altitudes.
The Northwestern Italian Dolichopoda species group comprises a uniform assemblage of populations, both genetically and morphologically. From genetically point of view, the median joining network analysis (Fig. 2) evidenced three main haplogroups geographically distributed, but the resulting scenario is rather homogeneous with a maximum number of mutation events equal to 8. Genetic distance values based on COI gene revealed a very little differentiation between all studied samples. All pairwise comparisons fall in the range of intraspecific comparisons observed in all the other Dolichopoda species, with a mean of 0.3% (Fig. 3). These results suggest a level of differentiation usually found between populations belonging to the same species rather than to different species. ABGD analysis confirms these results, grouping together all the northwestern Dolichopoda taxa.
However, despite the low variability, these populations show a significant level of genetic structure. Indeed, AMOVA analysis evidenced significant partitioning of variation within and among populations and among regions and a low level of gene flow between the different regions. Isolation by distance was also detected by Mantel test, suggesting that dispersal rates in these Dolichopoda populations are very low and limited to the geographically close ones. This result is not surprising for cave dwelling organisms because it reflects the geographic isolation of the different caves and / or groups of caves to which Dolichopoda populations are confined (
The phylogeny illustrated in Figure 4, based on three mitochondrial (COI, 12S and 16S) and one nuclear (28S) genes, supports the major phylogenetic relationships previously demonstrated (
The morphological analysis shows high degree of similarity between all analyzed samples, suggesting that the morphological traits commonly used in the taxonomy of the genus Dolichopoda (tergum 10, epiphallus shape in the male and sub-genital fig in the female), are not able to discriminate clearly specimens belonging to Dolichopoda azami, Dolichopoda ligustica and Dolichopoda ligustica septentrionalis. In particular, although very few morphological differences can be observed between specimens from the typical localities of the three taxa (CHA, typ. loc. of Dolichopoda azami; TOR, typ. loc. of Dolichopoda ligustica and PUG, typ. loc. of Dolichopoda ligustica septentrionalis), the most of the studied samples show some variability in the diagnostic characters occurring more or less randomly. Often we observed in the same specimen, the contemporary presence of characters typical of one or the other taxon.
Morphometric analysis suggested significant differences both between males and females and between samples from caves situated at different altitudes. Caves situated at high altitude are presumably subjected at lower temperatures and therefore the bioclimatic factors may be the major determinants of the morphometric patterns observed. Morphological traits might be subjected to substantial non-genetic variation and/or might show local short-term adaptations to peculiar environmental conditions. These differences were already been observed in populations of Dolichopoda laetitiae and Dolichopoda geniculata in the central southern Italy (
In conclusion, the scenario, depicted by both molecular markers and morphological traits, suggests that the northwestern Italian Dolichopoda constitute a single species with populations characterized from high similarity between each other and, due to the priority of description, they should be assigned to Dolichopoda azami Saulcy, 1893 which is the older available name at the species rank. However, in order to portrait the geographical partitioning and the related genetic differences we suggest to preserve the names ligustica Baccetti & Capra, 1959 and septentrionalis Baccetti & Capra, 1959 to indicate groups of populations corresponding to the different COI haplogroups as outlined in the network analysis (Fig. 2).
Therefore, the new taxonomic arrangement here proposed is:
Dolichopoda azami azami Saulcy, 1893
Type locality. Mine close to Chauves-souris Cave, Chateaudouble, Var, France, 525 m asl;
Dolichopoda azami ligustica Baccetti & Capra, 1959, stat. n.
Type locality. Santa Lucia Inferiore Cave, Toirano, SV, Liguria, 194 m asl;
Dolichopoda azami septentrionalis Baccetti & Capra, 1959, stat. n.
Type locality. Borna Maggiore del Pugnetto Cave, Mezzenile, Lanzo Valley, TO, Piedmont, 820 m asl.
This paper would not have been possible without the help of friends and colleagues who provided us the studied samples. A special thanks to Roberto Poggi (Civic Museum of Natural History "G. Doria" of Genoa), who allowed us to access to the Museum's collections, and gave to one of us (MR) useful suggestions. Stefano De Felici helped us in in the implementation of Figure 1.