


Citation: Miranda NAF, van Rooyen R, MacDonald A, Ponder W, Perissinotto R (2014) Genetics and shell morphometrics of assimineids (Mollusca, Caenogastropoda, Truncatelloidea) in the St Lucia Estuary, South Africa. ZooKeys 419: 73–86. doi: 10.3897/zookeys.419.7556
The Assimineidae are a family of amphibious microgastropods that can be mostly found in estuaries and mangroves in South Africa. These snails often occur in great numbers and are ecologically important to the St Lucia Estuary, which forms a crucial part of the iSimangaliso Wetland Park, a UNESCO World Heritage Site. Genetic and shell morphometric analyses were conducted on individuals collected from nine localities distributed from the northern lake regions to the southern lake and the mouth of the St Lucia estuarine lake. Mitochondrial (COI) and nuclear (28S) DNA was used to construct Bayesian Inference, Neighbour-joining, Maximum Parsimony and Maximum Likelihood trees. Principal Component Analysis and Cluster Analysis were performed on standard shell parameter data. Results indicate that two different taxa are present in St Lucia. The taxon comprising individuals from the South Lake and St Lucia Estuary Mouth is identified as Assiminea cf. capensis Bartsch, in accordance with the latest taxonomic consensus. The taxon comprising assimineid individuals from False Bay, North Lake and South Lake, is here tentatively named “Assiminea” aff. capensis (Sowerby). These two taxa exhibit patterns of spatial overlap that appear to vary depending on environmental parameters, particularly salinity. The need to resolve the complex taxonomy of assimineids is highlighted.
Microgastropods, Assiminea, taxonomy, St Lucia Estuary, iSimangaliso Wetland Park
Assimineidae is a poorly understood family of small amphibious gastropods, belonging to the superfamily Truncatelloidea (previously Rissooidea) (
The St Lucia Estuary is the largest estuarine system in Africa, a Ramsar site of International Importance and forms part of South Africa’s first UNESCO World Heritage Site, the iSimangaliso Wetland Park (
While the ecological importance of Assiminea is widely recognised, there are inconsistencies in the literature in terms of what species are present in the St Lucia Estuary. Much of the earlier literature refers to Assiminea bifasciata as the only species of Assiminea present in the system (
The present study is the first to address the genetics and shell morphometrics of assimineids in the St Lucia Estuary. The aim is to determine the number of distinct taxonomic groups that are present and resolve taxonomic inconsistencies in the literature. This is done by comparing the nuclear and mitochondrial DNA, as well as shell dimensions of individuals of nine different microgastropod populations present inside the system. The specific techniques chosen for this investigation have been used successfully to resolve similar inconsistencies involving assimineids in the Rio Grande region of Mexico (
Study Site. The St Lucia Estuary (28°23'S, 32°24'E) covers an area of approximately 350 km2 (
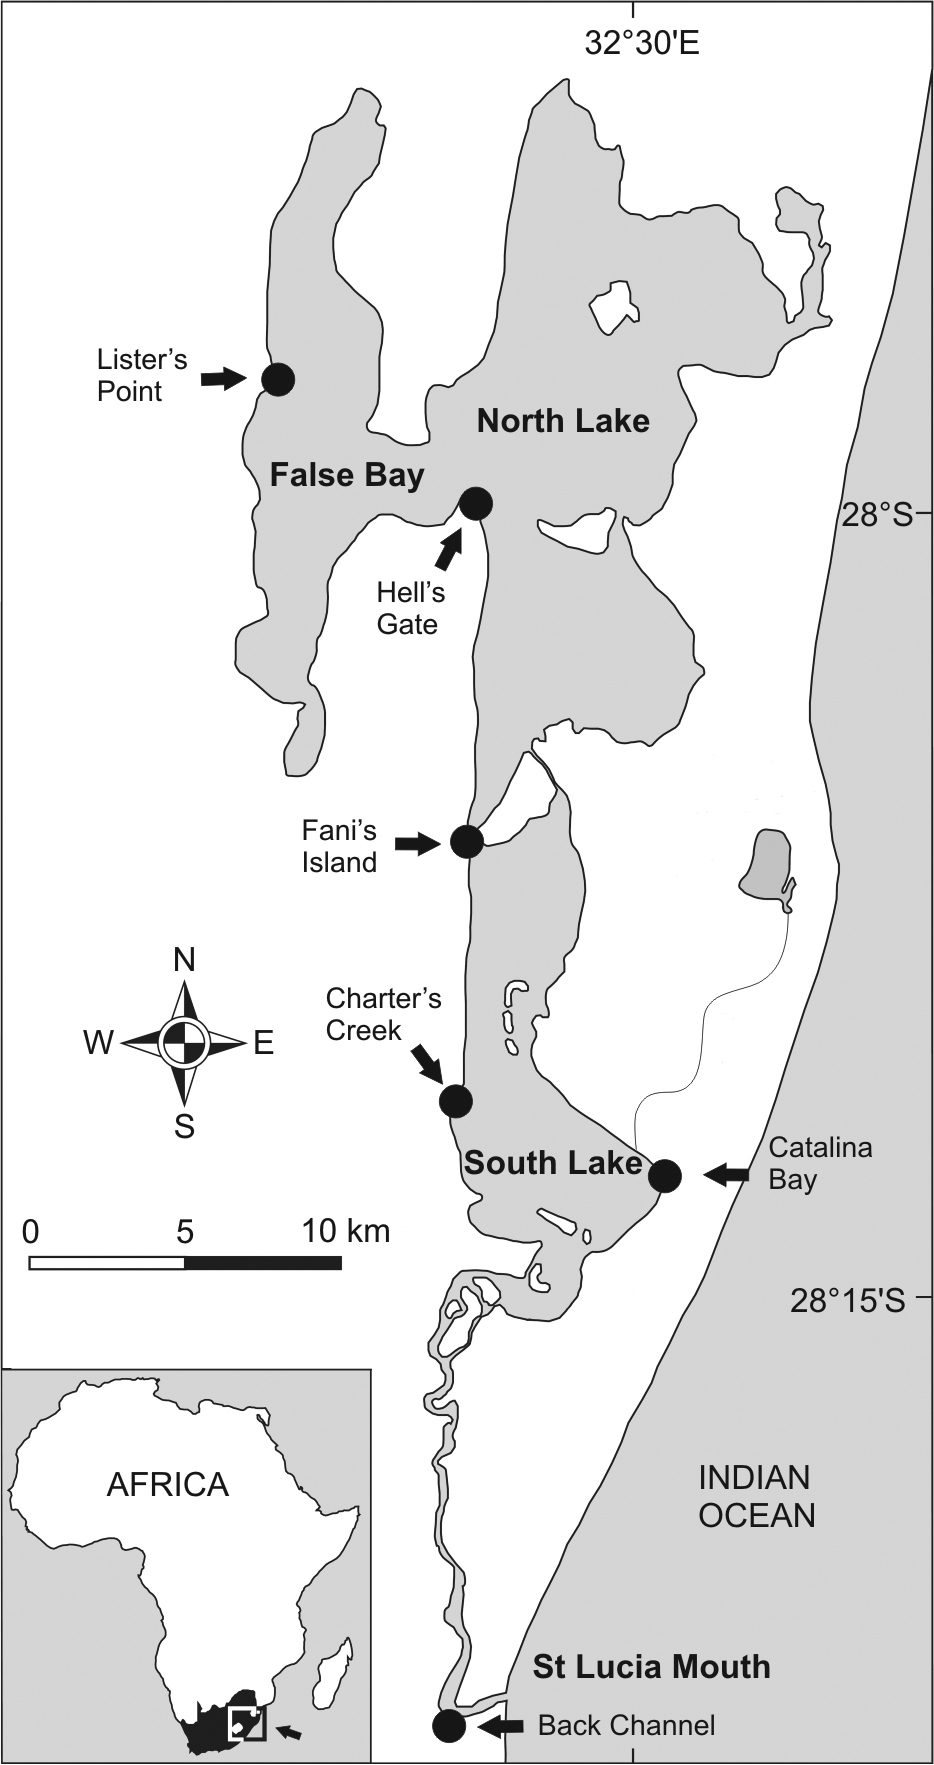
Map of St Lucia Estuary. Sample localities are indicated by arrows and dots (Modified from
Sampling. Specimens from 8 populations were collected by net and by hand at 6 localities in the St Lucia Estuary in July and October 2012 (Fig. 1). Snails were collected from two sites at Lister’s Point, False Bay, (Site A: 27°58'10.66"S, 32°23'5.57"E and Site B: 27°58'22.30"S, 32°22'28.24"E). Hell’s Gate (28°0'51"S, 32°26'48"E) and Fani’s Island populations (28°6'34"S, 32°26'03"E) represent the North Lake samples.The False Bay and North Lake region is characterised by highly fluctuating salinities and periodic hypersaline conditions (see Table 1). Charter’s Creek (28°11'52"S, 32°25'05"E) and Catalina Bay (28°13'29"S, 32°29'12"E) samples comprised populations of both larger Assiminea cf. capensis Bartsch and a smaller species similar to a species originally named Rissoa capensis Sowerby and here tentatively named “Assiminea” aff. capensis (Sowerby) that could thus be separated based on shell height (SH) (see also Table 3). These make up the samples from South Lake, a more stable environment with lower salinities (Table 1) due to higher freshwater input. At the St Lucia mouth, snails were collected from the Back Channel (28°23'45"S, 32°25'09"E) only in October 2012. All specimens were preserved in absolute ethanol prior to analyses.
Ranges of physico-chemical parameters in the St Lucia Estuary, measured during 2012.
| False Bay and North Lake region | South Lake Western Shores | South Lake Eastern Shores | St Lucia Mouth region | |
|---|---|---|---|---|
| Temperature (°C) | 19.79–37.49 | 21.26–34.98 | 17.56–32.41 | 15.44–27.29 |
| Salinity | 39.62–92.20 | 4.74–12.46 | 3.07–9.66 | 8.87–14.42 |
| pH | 8.27–8.76 | 8.53–9.14 | 8.23–9.27 | 8.30–9.20 |
| Dissolved oxygen (mg/L) | 5.27–7.96 | 7.33–9.05 | 6.18–9.32 | 6.63–9.23 |
| Turbidity (NTU) | 144.60–270.45 | 129.65–308.60 | 0.70–124.35 | 16.45–111.83 |
Molecular analysis. Between 4 and 11 individuals from each population were sampled for nuclear and mitochondrial DNA analysis. Genomic DNA was isolated using a Zymogen© extraction kit using the solid tissue protocol and extracted from the remainder of the samples using the entire specimen and following a phenol extraction protocol. Universal primers COIL1490 and COIH2198 were used to amplify and sequence 506 base pair regions of mitochondrial cytochrome c oxidase subunit I (COI) (
Sequencing was done at Inqaba Biotech Industries (Pretoria, South Africa) with an ABI 3730 Capillary Sequencer using Big Dye technology. Sequences were edited using BioEdit (v7.0.9.0) (
Morphometric analysis. Standard shell parameters were measured and compared between individuals from different localities. Adult individuals were selected from amongst the largest specimen in each sample. Sexual dimorphism was not addressed. 25 individuals from each population were used for morphometrical analysis. Micrographs were taken using a Nikon AZ100 stereo microscope. Snail shells were mounted and orientated with the spiral facing upwards and the aperture facing the optical lens. NIS-Elements (v3.2.00) digital measuring software was used to take measurements. The height and width of the shell (SH, SW), body whorl height (BWH) and aperture height and width (AH, AW) were measured. The number of shell whorls (Whorl) was counted. In addition the ratios of SW/SH, BWH/SH and AH/SH were calculated (
Molecular analysis. The results of the AMOVA and molecular diversity data are summarised in Table 2. This revealed that for both COI and 28S, the vast majority of the molecular variation (78%) occurred between the populations, with just over 20% occurring within. A high diversity was also found amongst haplotypes but with little variation within. This can be seen by the high haplotype diversity and relatively low variance for both genes (Table 2).
Molecular diversity and AMOVA data for 28S and COI (*denotes statistical significance).
| 28S | COI | |
|---|---|---|
| Molecular Diversity Data | ||
| Haplotypes Generated | 18 | 11 |
| G+C Content | 0.633 | 0.370 |
| Variable Sites | 30 | 16 |
| Parsimony Informative Sites | 18 | 14 |
| Haplotype Diversity | 0.769 | 0.882 |
| Haplotype Variance | 0.00305 | 0.00414 |
| Nucleotide Diversity | 0.00788 | 0.09162 |
| Nucleotide Variance | 1.2×10⁻⁶ | 6.92×10⁻⁵ |
| Tajima's D | -0.83178 | 2.497 |
| AMOVA | ||
| Variance among populations | 78%* | 96% |
| Variance within populations | 22%* | 4% |
The COI data set yielded 11 haplotypes (Table 2) with 98 variable sites, 87 of which were parsimony informative. The average G+C content was 37%. Haplotype 1 was the most common and was represented by individuals from both Lister’s Point sites. All other haplotypes were represented by 1-3 individuals from single populations.
All phylogenetic analyses strongly supported the separation of the False Bay (Lister’s Point, i.e. “Assiminea” aff. capensis (Sowerby)) and South Lake (Charter’s Creek and Catalina Bay, i.e. Assiminea cf. capensis Bartsch) samples into distinct clades, with supporting bootstrap values of 100% NJ and MP, 98% for ML and 1.0 for Bayesian inference (Fig. 2). All trees showed weak to moderate support for sub clades including Haplotype 2 and 3. All trees showed weak to moderate support for a Haplotype 6, 8 and 9 sub clade and Bayesian inference and MP trees for a Haplotype III and VI sub clade. The average variance between the two regions was 86.23 base pairs, which equates to a 17.04% genetic variance (Table 2).
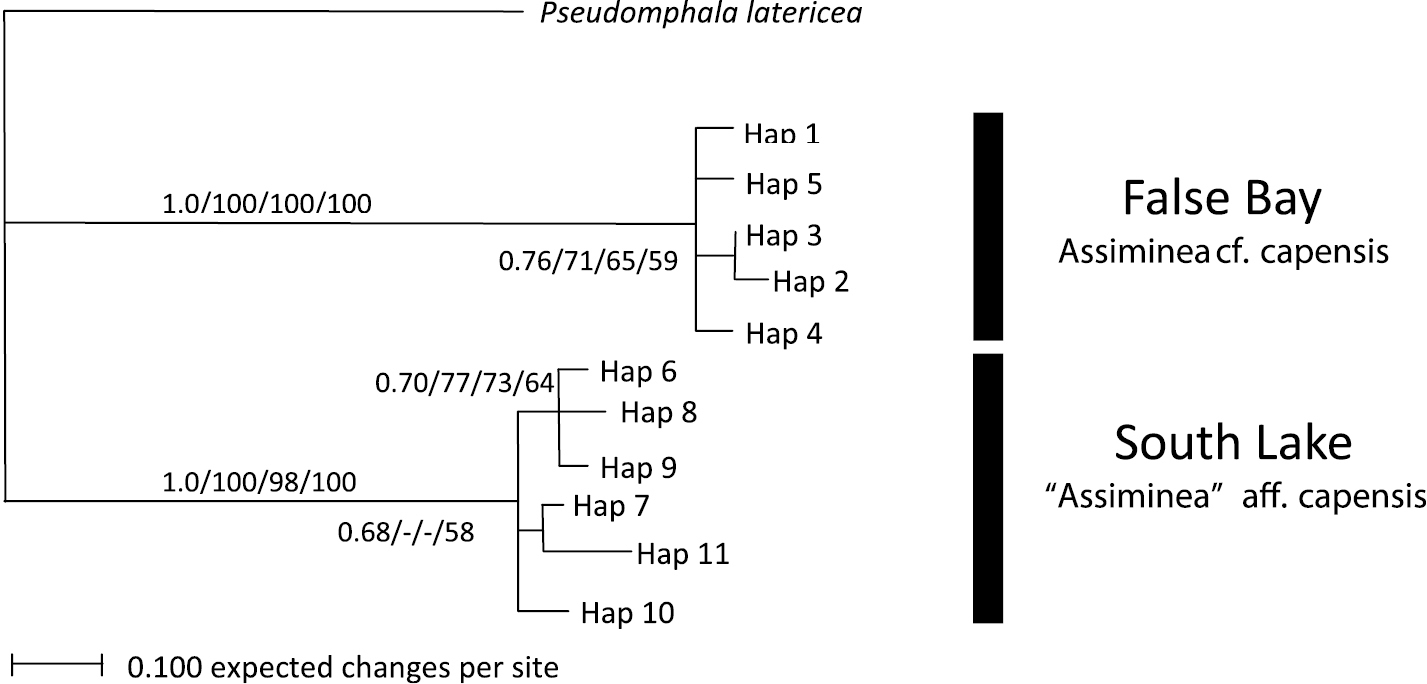
Bayesian Inference tree for COI data. Support values are as follows: Bayesian Inference/NJ/ML/MP.
The 28S data set yielded 18 haplotypes (Table 2) with 30 variable sites, 18 of which were parsimony informative. The average G+C content was 63.3%. Haplotype 7 was the most common (27 individuals) and was represented by all individuals from all populations, except the large Charter’s Creek, large Catalina Bay and Back Channel individuals. Phylogenetic analyses showed varying support for the separation of two clades (Fig. 3). The first clade was made up entirely of all the individuals from the large Charter’s Creek, large Catalina Bay and Back Channel individuals (i.e. Assiminea cf. capensis Bartsch). This clade was strongly supported by all phylogenetic analyses with the exception of ML. The MP and NJ trees showed strong support for the separation of a second clade. This clade was made up entirely of all samples from the other four populations (i.e. “Assiminea” aff. capensis (Sowerby)). All trees differed only slightly in the position of the branches within the clades.
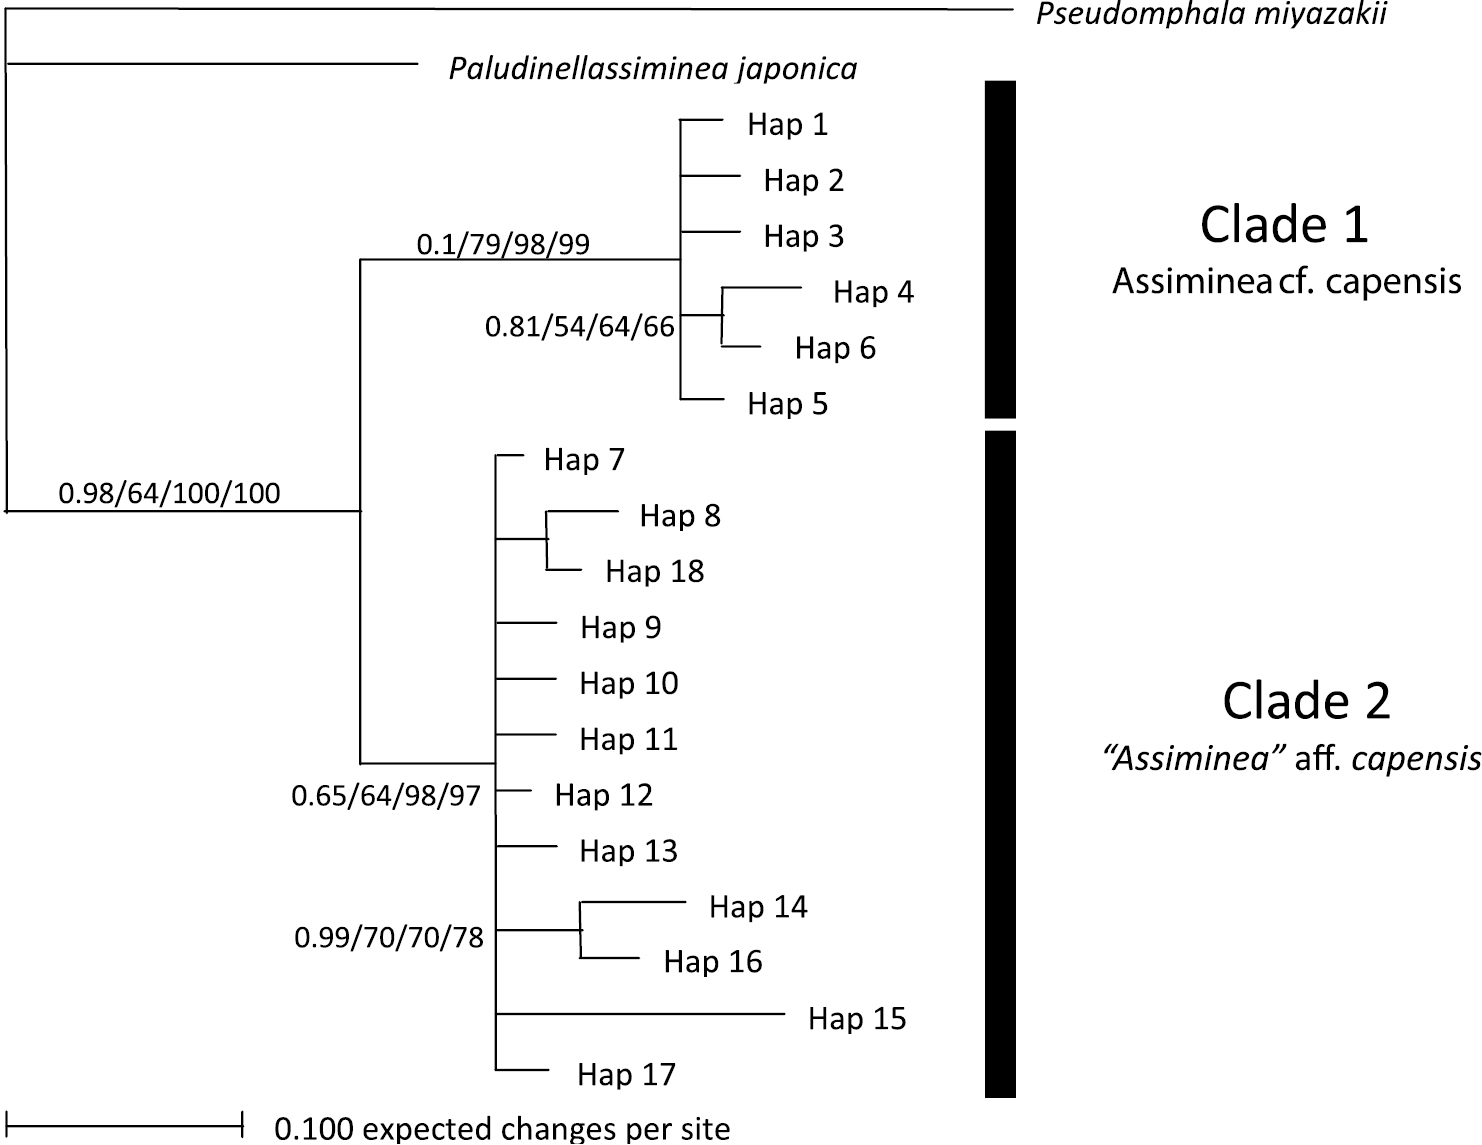
Bayesian Inference tree for 28S data. Support values are as follows: Bayesian Inference/ML/MP/NJ.
Morphometric analysis. Generally larger shell sizes (SH, SW, BWH, AH and AW) were recorded for Assiminea cf. capensis Bartsch in comparison to “Assiminea” aff. capensis (Sowerby) (Table 3). Adult Assiminea cf. capensis also tended to have a greater number of whorls (Whorl) (Table 3). However, the Assiminea cf. capensis populations from Back Channel, Charter’s Creek and Catalina Bay were grouped separately from the “Assiminea” aff. capensis populations at Lister’s Point, Hell’s Gate, Fani’s Island, Charter’s Creek and Catalina Bay, on the basis of shell morphometry in the cluster analysis (Fig. 4). The first two principal components (PCs) accounted for 89.1% of the total variation in shell morphometry (Table 4). All the shell dimensions recorded loaded high in PC1 and the ratios loaded high in PC2. This would suggest that samples are separated primarily on the basis of size (PC1) and shape (PC2).
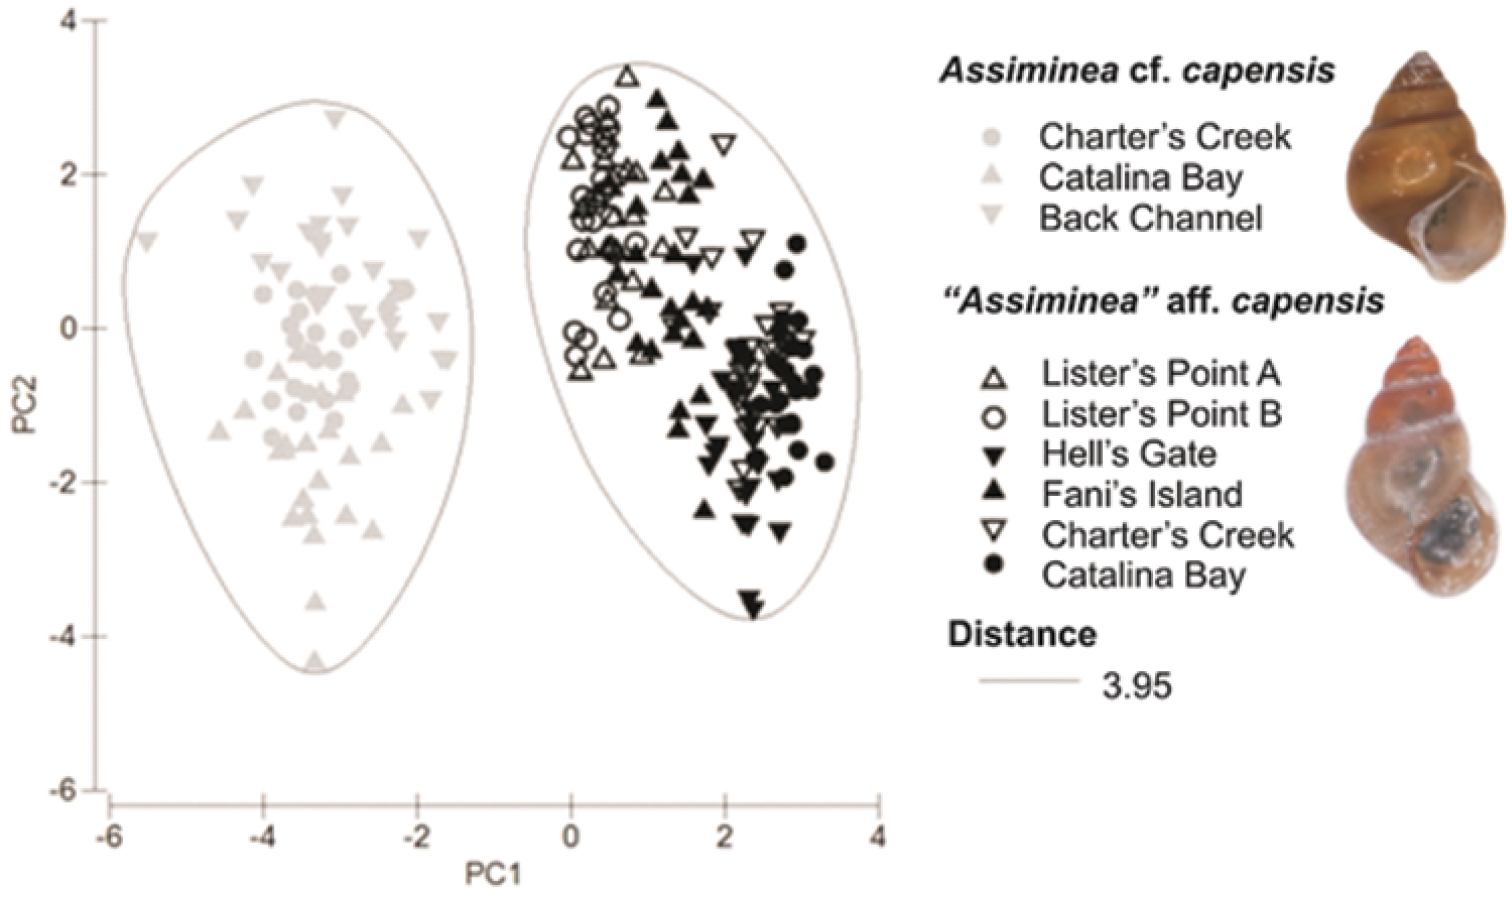
Plot of first two principal components of PCA for morphometric data. The cluster analysis ellipses are associated with P = 0.001.
Shell parameters (mean ± standard deviation) of populations of Assiminea cf. capensis and “Assiminea” aff. capensis occurring in the St Lucia Estuary during 2012.
| Parameter | Assiminea cf. capensis | “Assiminea” aff. capensis | ||||||
|---|---|---|---|---|---|---|---|---|
| Charter’s Creek | Catalina Bay | Back Channel | Lister’s Point | Hell’s Gate | Fani’s Island | Charter’s Creek | Catalina Bay | |
| SH | 3.82 ± 0.25 | 3.99 ± 0.32 | 3.86 ± 0.66 | 2.22 ± 0.18 | 1.22 ± 0.19 | 1.70 ± 0.20 | 1.26 ± 0.12 | 1.07 ± 0.06 |
| SW | 2.52 ± 0.16 | 2.73 ± 0.19 | 2.42 ± 0.35 | 1.30 ± 0.89 | 0.81 ± 0.10 | 1.04 ± 0.11 | 0.79 ± 0.06 | 0.67 ± 0.03 |
| BWH | 2.67 ± 0.16 | 2.90 ± 0.24 | 2.70 ± 0.43 | 1.52 ± 0.12 | 0.92 ± 0.13 | 1.22 ± 0.13 | 0.93 ± 0.07 | 0.83 ± 0.05 |
| AH | 1.81 ± 0.15 | 1.97 ± 0.17 | 1.85 ± 0.26 | 0.98 ± 0.08 | 0.61 ± 0.08 | 0.75 ± 0.08 | 0.58 ± 0.06 | 0.49 ± 0.03 |
| AW | 1.59 ± 0.14 | 1.73 ± 0.15 | 1.47 ± 0.21 | 0.81 ± 0.06 | 0.49 ± 0.07 | 0.63 ± 0.06 | 0.48 ± 0.05 | 0.41 ± 0.02 |
| Whorl | 6.00 ± 0.01 | 4.80 ± 0.41 | 6.04 ± 0.20 | 4.94 ± 0.33 | 4.00 ± 0.01 | 4.80 ± 0.41 | 4.20 ± 0.41 | 3.92 ± 0.28 |
| SW/SH | 0.66 ± 0.03 | 0.68 ± 0.03 | 0.63 ± 0.03 | 0.59 ± 0.03 | 0.67 ± 0.04 | 0.62 ± 0.04 | 0.63 ± 0.02 | 0.63 ± 0.03 |
| BWH/SH | 0.70 ± 0.02 | 0.73 ± 0.03 | 0.70 ± 0.02 | 0.69 ± 0.03 | 0.76 ± 0.04 | 0.72 ± 0.04 | 0.75 ± 0.03 | 0.77 ± 0.03 |
| AH/SH | 0.42 ± 0.02 | 0.433 ± 0.02 | 0.38 ± 0.02 | 0.37 ± 0.02 | 0.40 ± 0.03 | 0.37 ± 0.03 | 0.38 ± 0.03 | 0.39 ± 0.02 |
Measuring units are in mm. Sample size is 25 for each population and locality.
Factor loadings from principal component analysis for normalised data.
| Variable | PC1 | PC2 | PC3 | PC4 | PC5 |
| SH | -0.407 | 0.048 | -0.147 | 0.106 | -0.057 |
| SW | -0.408 | -0.038 | -0.097 | 0.082 | -0.134 |
| BWH | -0.406 | -0.001 | -0.231 | 0.091 | -0.044 |
| AH | -0.407 | -0.021 | -0.16 | 0.074 | -0.056 |
| AW | -0.408 | -0.049 | -0.077 | 0.167 | 0.028 |
| Whorl | -0.326 | 0.251 | 0.184 | -0.823 | 0.345 |
| SW/SH | -0.102 | -0.602 | 0.328 | -0.334 | -0.63 |
| BWH/SH | 0.179 | -0.495 | -0.761 | -0.305 | 0.205 |
| AH/SH | -0.148 | -0.568 | 0.405 | 0.242 | 0.644 |
| Eigenvalues | 5.91 | 2.11 | 0.441 | 0.289 | 0.239 |
| % Cum Var | 65.7 | 89.1 | 94 | 97.2 | 99.9 |
Molecular (COI and 28S) as well as shell morphometric analyses support a clear distinction of two clades within the assimineids occurring in the St Lucia estuarine lake during the study period (Figures 2–4). There is a large divergence in mitochondrial DNA (17.04%) and the variance in the slower evolving nuclear rDNA between the two clades. The divergence in the COI gene is greater than that previously shown for other congeneric truncatelloidean gastropods, which ranged from 1.1 to 14.8% (e.g.
Environmental conditions, salinity in particular, strongly influence the spatial and temporal distribution and overlap patterns of Assiminea cf. capensis and “Assiminea” aff. capensis in the St Lucia Estuary. In an earlier benthic survey of St Lucia conducted by
Given the morphological and ecological similarities, as well as spatial overlap displayed by Assiminea cf. capensis and “Assiminea” aff. capensis, it is not surprising that both species have been misidentified in the past.
We thank the iSimangaliso Park Authority and Ezemvelo KZN Wildlife for supporting this project. Special thanks go to R. Taylor, S. Kyle, C. Fox, and S. Mfeka for their invaluable assistance in the field. We also thank C. Schoeman for helpful advice and suggestions with the statistical analysis. Funding was provided by the National Research Foundation (NRF), The South African – Netherlands Research Programme on Alternatives in Development (SANPAD) and the World Wide Fund for Nature (WWF).This work is based on the research supported by the South African Research Chairs Initiative of the Department of Science and Technology (DST) and National Research Foundation (NRF) of South Africa. Any opinion, finding and conclusion or recommendation expressed in this material is that of the author(s) and the NRF does not accept any liability in this regard.