


Citation: Abdul-Latiff MAB, Ruslin F, Vun VF, Mohd-Hashim A, Rovie-Ryan JJ, Abdul-Patah P, Lakim M, Roos C, Yaakop S, Md-Zain BM (2014) Phylogenetic relationships of Malaysia’s long-tailed macaques, Macaca fascicularis, based on cytochrome b sequences. ZooKeys 407: 121–140. doi: 10.3897/zookeys.407.6982
Phylogenetic relationships among Malaysia’s long-tailed macaques have yet to be established, despite abundant genetic studies of the species worldwide. The aims of this study are to examine the phylogenetic relationships of Macaca fascicularis in Malaysia and to test its classification as a morphological subspecies. A total of 25 genetic samples of M. fascicularis yielding 383 bp of Cytochrome b (Cyt b) sequences were used in phylogenetic analysis along with one sample each of M. nemestrina and M. arctoides used as outgroups. Sequence character analysis reveals that Cyt b locus is a highly conserved region with only 23% parsimony informative character detected among ingroups. Further analysis indicates a clear separation between populations originating from different regions; the Malay Peninsula versus Borneo Insular, the East Coast versus West Coast of the Malay Peninsula, and the island versus mainland Malay Peninsula populations. Phylogenetic trees (NJ, MP and Bayesian) portray a consistent clustering paradigm as Borneo’s population was distinguished from Peninsula’s population (99% and 100% bootstrap value in NJ and MP respectively and 1.00 posterior probability in Bayesian trees). The East coast population was separated from other Peninsula populations (64% in NJ, 66% in MP and 0.53 posterior probability in Bayesian). West coast populations were divided into 2 clades: the North-South (47%/54% in NJ, 26/26% in MP and 1.00/0.80 posterior probability in Bayesian) and Island-Mainland (93% in NJ, 90% in MP and 1.00 posterior probability in Bayesian). The results confirm the previous morphological assignment of 2 subspecies, M. f. fascicularis and M. f. argentimembris, in the Malay Peninsula. These populations should be treated as separate genetic entities in order to conserve the genetic diversity of Malaysia’s M. fascicularis. These findings are crucial in aiding the conservation management and translocation process of M. fascicularis populations in Malaysia.
Long-tailed macaque, Macaca fascicularis, Cytochrome b, phylogenetic relationships
Macaca fascicularis (Raffles, 1821) is also known as long-tailed, crab-eating or cynomolgus macaque. This species is well distributed in the countries of Malaysia, Brunei, Bangladesh, Cambodia, Nicobar Islands, Indonesia, Lao PDR, Myanmar, Philippines, Singapore, Thailand, Timor-Leste and Vietnam (Figure 1) (
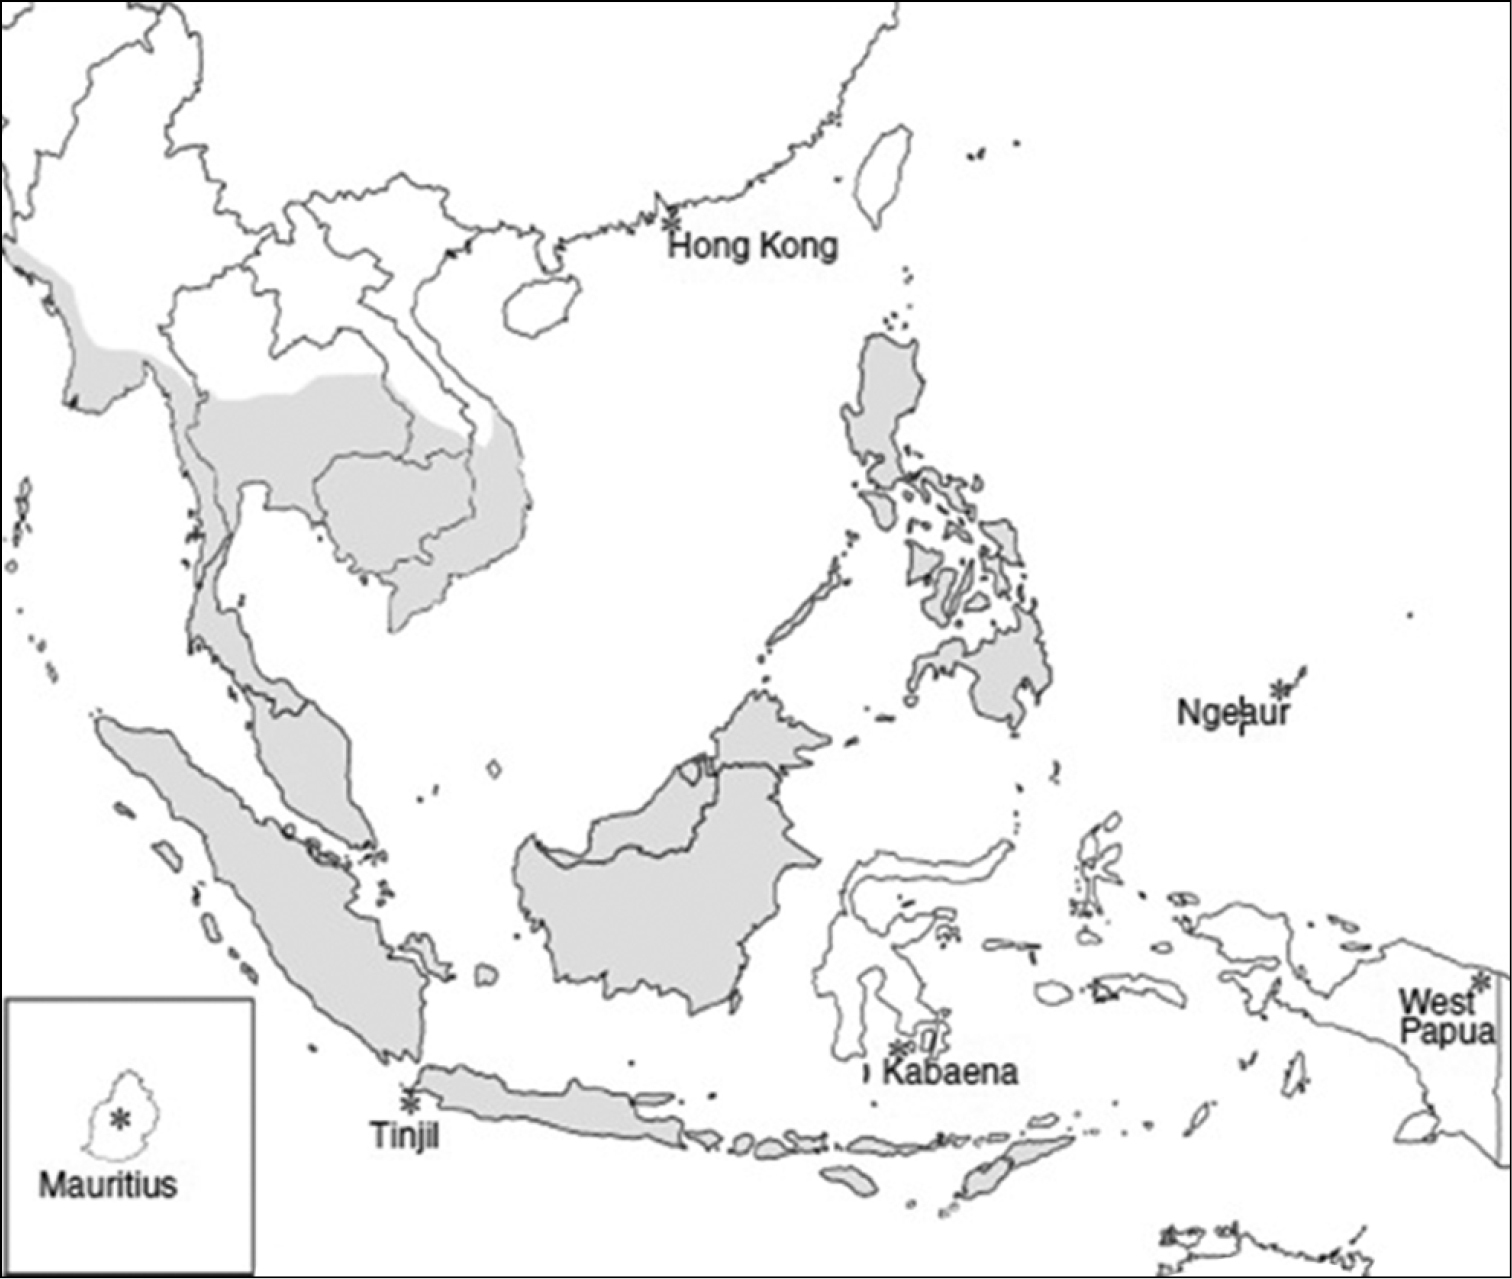
Distribution of the long-tailed macaque (Macaca fascicularis) in Southeast Asia (
At least 10 subspecies of Macaca fascicularis are presently recognized; Macaca fascicularis atriceps (Kloss, 1919), Macaca fascicularis aurea (Geoffroy, 1831), Macaca fascicularis condorensis (Kloss, 1926), Macaca fascicularis fascicularis (Raffles, 1821), Macaca fascicularis fusca (Miller, 1903), Macaca fascicularis karimondjawae (Sody, 1949), Macaca fascicularis lasiae (Lyon, 1916), Macaca fascicularis philippinensis (Geoffroy, 1843), Macaca fascicularis tua (Kellog, 1944) and Macaca fascicularis umbrosa (Miller, 1902) (
Despite the abundance of genetic studies on or including Macaca fascicularis, the phylogenetic relationships among Malaysia’s long-tailed macaques remain uncertain. However, these phylogenetic data are crucial for conservation management of Macaca fascicularis as this species is reported as a pest in human settlement areas (
Phylogenetic studies at the subspecies level are very scarce (
Altogether, 27 genetic samples (Table 1 and Figure 2) were used in this research. These samples were provided by the Department of Wildlife and National Parks (PERHILITAN) and Sabah Parks. The samples derive mainly from feces collected in the original habitats of Macaca fascicularis. In addition, blood and tissue samples collected from a roadkill specimen of Macaca fascicularis were also used in this study. Mitochondrial DNA (mtDNA) was extracted from each genetic sample using QIAGEN DNeasy Blood and Tissue Kit, following the manufacturer’s protocol. A mtDNA genome from FTA (fast technology for analysis of nucleic acids) sample was extracted using the WHATMAN® GenSolve Recovery Kit, also following the manufacturer’s protocol. DNA was extracted from 0.5 g – 1.0 g of fecal sample using innuPREP Stool DNA kit (Analytik Jena) following the manufacturer’s protocol.
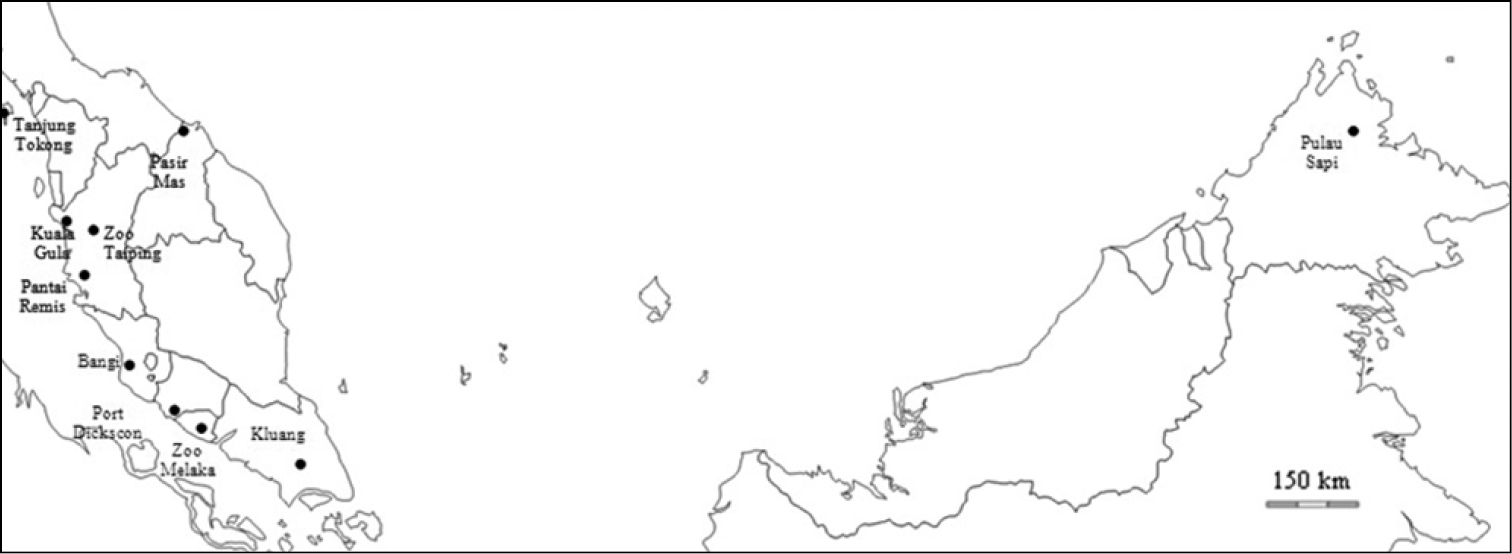
Sampling location of Macaca fascicularis throughout Peninsula Malaysia and Borneo.
Details on the samples used in this study.
| No. | Sample name | Taxon | Locality |
|---|---|---|---|
| 1 | MF135 | Macaca fascicularis fascicularis | Port Dickson, Negeri Sembilan |
| 2 | MF136 | Macaca fascicularis fascicularis | Port Dickson, Negeri Sembilan |
| 3 | MF137 | Macaca fascicularis fascicularis | Port Dickson, Negeri Sembilan |
| 4 | MF138 | Macaca fascicularis fascicularis | Port Dickson, Negeri Sembilan |
| 5 | M1 | Macaca fascicularis fascicularis | Bangi, Selangor |
| 6 | BM95 | Macaca fascicularis fascicularis | Kluang, Johor |
| 7 | MF488 | Macaca fascicularis fascicularis | Tanjung Tokong. Pulau Pinang |
| 8 | MF489 | Macaca fascicularis fascicularis | Tanjung Tokong. Pulau Pinang |
| 9 | MF490 | Macaca fascicularis fascicularis | Tanjung Tokong. Pulau Pinang |
| 10 | MF491 | Macaca fascicularis fascicularis | Tanjung Tokong. Pulau Pinang |
| 11 | MF719 | Macaca fascicularis fascicularis | Pantai Remis, Perak |
| 12 | MF720 | Macaca fascicularis fascicularis | Pantai Remis, Perak |
| 13 | MF721 | Macaca fascicularis fascicularis | Pantai Remis, Perak |
| 14 | MF722 | Macaca fascicularis fascicularis | Pantai Remis, Perak |
| 15 | ALMFD16 | Macaca fascicularis fascicularis | Pasir Mas, Kelantan |
| 16 | ALMFD17 | Macaca fascicularis fascicularis | Pasir Mas, Kelantan |
| 17 | ALMFD28 | Macaca fascicularis fascicularis | Pasir Mas, Kelantan |
| 18 | ALMFD29 | Macaca fascicularis fascicularis | Pasir Mas, Kelantan |
| 19 | ALMFA62 | Macaca fascicularis fascicularis | Kuala Gula, Perak |
| 20 | ALMFA63 | Macaca fascicularis fascicularis | Kuala Gula, Perak |
| 21 | ALMFA64 | Macaca fascicularis fascicularis | Kuala Gula, Perak |
| 22 | ALMFA65 | Macaca fascicularis fascicularis | Kuala Gula, Perak |
| 23 | MF03 | Macaca fascicularis fascicularis | Pulau Sapi, Sabah |
| 24 | MF04 | Macaca fascicularis fascicularis | Pulau Sapi, Sabah |
| 25 | MF05 | Macaca fascicularis fascicularis | Pulau Sapi, Sabah |
| 26 | BM97 | Macaca nemestrina | Zoo Taiping, Perak |
| 27 | BM104 | Macaca arctoides | Malacca Zoo |
Polymerase Chain Reaction (PCR) was employed in order to amplify the targeted locus in the mtDNA genome, which is a partial fragment of the Cyt b gene, by using Mastercycler® nexus (Eppendorf North America, Inc.). PCR was performed by using PhusionTM Flash High-Fidelity PCR Master Mix (Finnzymes, OY), which has extreme speed (extension times of 15 s/kb or less), high accuracy (proofreads DNA polymerase with a fidelity of 25 X Taq polymerase) and a very high yield in reduced times. Primers used in this study were (L14724) 5’- CGAAGCTTGATATGAAAAACCATCGTTG -3’ (
Sequence results obtained from the 1st Base Laboratories Sdn Bhd were proofread and edited using Bioedit Sequence Alignment Editor, and the Sequence Similarity searches were performed using GenBank BLASTn application to validate the DNA sequences obtained. DNA sequences were submitted to GenBank under accession number KJ592589-KJ592594. Bioedit’s ClustalW multiple alignment algorithm was then used to align the sequence results, and sequence analysis and phylogenetic analysis were performed. DNASP 4.0 (
Three methods of phylogenetic tree reconstructions were carried out; the distance-based method (neighbor joining, NJ) using MEGA version 4.0 (
Modeltest version 3.7 software (
Partial sequences of Cyt b locus in size of 383 bp were successfully sequenced for all 27 genetic samples (Table 1). The first analysis conducted on the sequences consisted of sequence similarity searches using the GenBank application to validate each sequence obtained was from the correct taxon of the acquired samples and to avoid encountering the data problem of nuclear insertion. All genetic samples matched the target species sequences in GenBank with samples FJ906803.1 (Macaca fascicularis complete genome) and corresponded to most of the ingroup samples with average query cover and maximum identities scores at 95% and 97%, respectively.
A total of 27 genetic sequences in a size of 383 bp of Cyt b locus yielded 78 (20.37%) variable sites, of which 34 sites were parsimony informative characters (8.88%). Interestingly, when outgroup samples (Macaca nemestrina and Macaca arctoides) were excluded from the analysis, only 23 (6%) variable sites were detected, all of which were parsimony informative characters. From these 23 informative characters, 13 were generated by the inclusion of Borneo samples in the analysis; whereas, if the Borneo samples were excluded, only 10 (2.6%) parsimony informative characters were detected.
Pairwise genetic distances of Cyt b partial sequences were calculated with PAUP 4.0b10 (
Pairwise distance of Macaca fascicularis samples based on Kimura-2-Parameter algorithm model.
| 1 | 2 | 3 | 4 | 5 | 6 | 7 | 8 | 9 | 10 | 11 | 12 | 13 | 14 | ||
|---|---|---|---|---|---|---|---|---|---|---|---|---|---|---|---|
| 1 | MF03 Mf Sabah | - | |||||||||||||
| 2 | MF04 Mf sabah | 0.00000 | - | ||||||||||||
| 3 | MF05 Mf Sabah | 0.00000 | 0.00000 | - | |||||||||||
| 4 | BM95 Mf Johor | 0.04068 | 0.04068 | 0.04068 | - | ||||||||||
| 5 | MF135 Mf NSembil | 0.04636 | 0.04636 | 0.04636 | 0.00525 | - | |||||||||
| 6 | MF136 Mf Nsembil | 0.04636 | 0.04636 | 0.04636 | 0.00525 | 0.00000 | - | ||||||||
| 7 | MF137 Mf Nsembil | 0.04636 | 0.04636 | 0.04636 | 0.00525 | 0.00000 | 0.00000 | - | |||||||
| 8 | MF138 Mf Nsembi | 0.04636 | 0.04636 | 0.04636 | 0.00525 | 0.00000 | 0.00000 | 0.00000 | - | ||||||
| 9 | M1 Mf Selangor | 0.04636 | 0.04636 | 0.04636 | 0.00525 | 0.00000 | 0.00000 | 0.00000 | 0.00000 | - | |||||
| 10 | MF719 Mf Perak | 0.04351 | 0.04351 | 0.04351 | 0.00262 | 0.00789 | 0.00789 | 0.00789 | 0.00789 | 0.00789 | - | ||||
| 11 | MF720 Mf Perak | 0.04351 | 0.04351 | 0.04351 | 0.00262 | 0.00789 | 0.00789 | 0.00789 | 0.00789 | 0.00789 | 0.00000 | - | |||
| 12 | MF721 Mf Perak | 0.04351 | 0.04351 | 0.04351 | 0.00262 | 0.00789 | 0.00789 | 0.00789 | 0.00789 | 0.00789 | 0.00000 | 0.00000 | - | ||
| 13 | MF722 Mf Perak | 0.04351 | 0.04351 | 0.04351 | 0.00262 | 0.00789 | 0.00789 | 0.00789 | 0.00789 | 0.00789 | 0.00000 | 0.00000 | 0.00000 | - | |
| 14 | ALMFA65 Mf Perak | 0.04923 | 0.04923 | 0.04923 | 0.00789 | 0.01323 | 0.01323 | 0.01323 | 0.01323 | 0.01323 | 0.00525 | 0.00525 | 0.00525 | 0.00525 | - |
| 15 | ALMFA64 Mf Perak | 0.04923 | 0.04923 | 0.04923 | 0.00789 | 0.01323 | 0.01323 | 0.01323 | 0.01323 | 0.01323 | 0.00525 | 0.00525 | 0.00525 | 0.00525 | 0.00000 |
| 16 | ALMFA63 Mf Perak | 0.04923 | 0.04923 | 0.04923 | 0.00789 | 0.01323 | 0.01323 | 0.01323 | 0.01323 | 0.01323 | 0.00525 | 0.00525 | 0.00525 | 0.00525 | 0.00000 |
| 17 | ALMFA62 Mf Perak | 0.04923 | 0.04923 | 0.04923 | 0.00789 | 0.01323 | 0.01323 | 0.01323 | 0.01323 | 0.01323 | 0.00525 | 0.00525 | 0.00525 | 0.00525 | 0.00000 |
| 18 | MF488 Mf P.Pinan | 0.04636 | 0.04636 | 0.04636 | 0.01055 | 0.01592 | 0.01592 | 0.01592 | 0.01592 | 0.01592 | 0.00789 | 0.00789 | 0.00789 | 0.00789 | 0.01323 |
| 19 | MF489 Mf P.Pinan | 0.04636 | 0.04636 | 0.04636 | 0.01055 | 0.01592 | 0.01592 | 0.01592 | 0.01592 | 0.01592 | 0.00789 | 0.00789 | 0.00789 | 0.00789 | 0.01323 |
| 20 | MF490 Mf P.Pinan | 0.04636 | 0.04636 | 0.04636 | 0.01055 | 0.01592 | 0.01592 | 0.01592 | 0.01592 | 0.01592 | 0.00789 | 0.00789 | 0.00789 | 0.00789 | 0.01323 |
| 21 | MF491 Mf P.Pinan | 0.04636 | 0.04636 | 0.04636 | 0.01055 | 0.01592 | 0.01592 | 0.01592 | 0.01592 | 0.01592 | 0.00789 | 0.00789 | 0.00789 | 0.00789 | 0.01323 |
| 22 | ALMFD16 Mf Kelan | 0.03786 | 0.03786 | 0.03786 | 0.00789 | 0.01323 | 0.01323 | 0.01323 | 0.01323 | 0.01323 | 0.01055 | 0.01055 | 0.01055 | 0.01055 | 0.01592 |
| 23 | ALMFD17 Mf Kelan | 0.03786 | 0.03786 | 0.03786 | 0.00789 | 0.01323 | 0.01323 | 0.01323 | 0.01323 | 0.01323 | 0.01055 | 0.01055 | 0.01055 | 0.01055 | 0.01592 |
| 24 | ALMFD28 Mf Kelan | 0.03786 | 0.03786 | 0.03786 | 0.00789 | 0.01323 | 0.01323 | 0.01323 | 0.01323 | 0.01323 | 0.01055 | 0.01055 | 0.01055 | 0.01055 | 0.01592 |
| 25 | ALMFD29 Mf Kelan | 0.03786 | 0.03786 | 0.03786 | 0.00789 | 0.01323 | 0.01323 | 0.01323 | 0.01323 | 0.01323 | 0.01055 | 0.01055 | 0.01055 | 0.01055 | 0.01592 |
| 26 | BM104 Ma Malacca | 0.11558 | 0.11558 | 0.11558 | 0.11914 | 0.12574 | 0.12574 | 0.12574 | 0.12574 | 0.12574 | 0.12243 | 0.12243 | 0.12243 | 0.12243 | 0.12907 |
| 27 | BM97 Mn ZooTaipi | 0.11753 | 0.11753 | 0.11753 | 0.13751 | 0.14426 | 0.14426 | 0.14426 | 0.14426 | 0.14426 | 0.14087 | 0.14087 | 0.14087 | 0.14087 | 0.14087 |
Continue.
| 15 | 16 | 17 | 18 | 19 | 20 | 21 | 22 | 23 | 24 | 25 | 26 | 27 | ||
|---|---|---|---|---|---|---|---|---|---|---|---|---|---|---|
| 1 | MF03 Mf Sabah | |||||||||||||
| 2 | MF04 Mf sabah | |||||||||||||
| 3 | MF05 Mf Sabah | |||||||||||||
| 4 | BM95 Mf Johor | |||||||||||||
| 5 | MF135 Mf NSembil | |||||||||||||
| 6 | MF136 Mf Nsembil | |||||||||||||
| 7 | MF137 Mf Nsembil | |||||||||||||
| 8 | MF138 Mf Nsembi | |||||||||||||
| 9 | M1 Mf Selangor | |||||||||||||
| 10 | MF719 Mf Perak | |||||||||||||
| 11 | MF720 Mf Perak | |||||||||||||
| 12 | MF721 Mf Perak | |||||||||||||
| 13 | MF722 Mf Perak | |||||||||||||
| 14 | ALMFA65 Mf Perak | |||||||||||||
| 15 | ALMFA64 Mf Perak | - | ||||||||||||
| 16 | ALMFA63 Mf Perak | 0.00000 | - | |||||||||||
| 17 | ALMFA62 Mf Perak | 0.00000 | 0.00000 | - | ||||||||||
| 18 | MF488 Mf P.Pinan | 0.01323 | 0.01323 | 0.01323 | - | |||||||||
| 19 | MF489 Mf P.Pinan | 0.01323 | 0.01323 | 0.01323 | 0.00000 | - | ||||||||
| 20 | MF490 Mf P.Pinan | 0.01323 | 0.01323 | 0.01323 | 0.00000 | 0.00000 | - | |||||||
| 21 | MF491 Mf P.Pinan | 0.01323 | 0.01323 | 0.01323 | 0.00000 | 0.00000 | 0.00000 | - | ||||||
| 22 | ALMFD16 Mf Kelan | 0.01592 | 0.01592 | 0.01592 | 0.01323 | 0.01323 | 0.01323 | 0.01323 | - | |||||
| 23 | ALMFD17 Mf Kelan | 0.01592 | 0.01592 | 0.01592 | 0.01323 | 0.01323 | 0.01323 | 0.01323 | 0.00000 | - | ||||
| 24 | ALMFD28 Mf Kelan | 0.01592 | 0.01592 | 0.01592 | 0.01323 | 0.01323 | 0.01323 | 0.01323 | 0.00000 | 0.00000 | - | |||
| 25 | ALMFD29 Mf Kelan | 0.01592 | 0.01592 | 0.01592 | 0.01323 | 0.01323 | 0.01323 | 0.01323 | 0.00000 | 0.00000 | 0.00000 | - | ||
| 26 | BM104 Ma Malacca | 0.12907 | 0.12907 | 0.12907 | 0.12574 | 0.12574 | 0.12574 | 0.12574 | 0.10940 | 0.10940 | 0.10940 | 0.10940 | - | |
| 27 | BM97 Mn ZooTaipi | 0.14087 | 0.14087 | 0.14087 | 0.13751 | 0.13751 | 0.13751 | 0.13751 | 0.13416 | 0.13416 | 0.13416 | 0.13416 | 0.14702 | - |
Nucleotide diversity (π) and net nucleotide divergence (Da) were also calculated for the Cyt b sequence obtained using DnaSP v4.0. Two separate analyses for π and Da were conducted based on the origin of samples, by first sorting the sequences (excluding outgroup) according to their locality (states) (Table 3) and then according to regions (Table 4). The first analysis (Table 3) portrayed that π was the highest between Sabah and other states ranging from 0.019 to 0.025, and the results are consistent with Da, ranging from 0.037 to 0.044. π. The lowest values, 0 for π and Da, were found between Negeri Sembilan and Selangor. The second analysis (Table 4) revealed that the Peninsula Malaysia and Borneo populations have 0.017 π and 0.038 Da, which are the highest compared to other regions; the East Coast of Peninsula Malaysia and West Coast of Peninsula Malaysia populations have 0.09 π and 0.08 Da and mainland and island populations have 0.08 π and 0.09 Da, respectively.
Measures of nucleotide diversity (π) and net nucleotide divergence among populations of Macaca fascicularis analyzed by locality.
| Locality | Nucleotide Diversity (π) | Net nucleotide divergence (Da) |
|---|---|---|
| Sabah-Johor | 0.01958 | 0.03916 |
| Sabah-Negeri Sembilan | 0.02536 | 0.04439 |
| Sabah-Selangor | 0.02219 | 0.04439 |
| Sabah-Perak | 0.02089 | 0.04289 |
| Sabah-Pulau Pinang | 0.02536 | 0.04439 |
| Sabah-Kelantan | 0.02089 | 0.03655 |
| Johor-Negeri Sembilan | 0.00209 | 0.00522 |
| Johor-Selangor | 0.00522 | 0.00522 |
| Johor-Perak | 0.00348 | 0.00373 |
| Johor-Pulau Pinang | 0.00418 | 0.01044 |
| Johor-Kelantan | 0.00313 | 0.00783 |
| Negeri Sembilan-Selangor | 0.00000 | 0.00000 |
| Negeri Sembilan-Perak | 0.00633 | 0.00895 |
| Negeri Sembilan-Pulau Pinang | 0.00895 | 0.01567 |
| Negeri Sembilan-Kelantan | 0.00746 | 0.01305 |
| Selangor-Perak | 0.00464 | 0.00895 |
| Selangor-Pulau Pinang | 0.00627 | 0.01567 |
| Selangor-Kelantan | 0.00522 | 0.01305 |
| Perak-Pulau Pinang | 0.00633 | 0.00895 |
| Perak-Kelantan | 0.00760 | 0.01156 |
| Pulau Pinang-Kelantan | 0.00746 | 0.01305 |
Measures of nucleotide diversity (π) and net nucleotide divergence among populations of Macaca fascicularis analyzed by regions.
| Regions | Nucleotide Diversity (π) | Net nucleotide divergence (Da) |
|---|---|---|
| Peninsula Malaysia-Borneo | 0.01666 | 0.03801 |
| East Coast-West Coast | 0.00943 | 0.00865 |
| Mainland-Island | 0.00823 | 0.00918 |
The NJ phylogeny tree (Figure 3) was generated using Kimura-2-Parameter with 1000 bootstrap replication. The NJ phylogenetic tree showed that samples originating from Borneo remain monophyletic from samples originating from Peninsula Malaysia, supported with 99% bootstrap value. Samples from Peninsula Malaysia were divided into 2 clades; clade A and Clade B. Clade A portrays the separation of samples originating from the East Coast of Peninsula Malaysia from the remaining samples with 64% bootstrap value. Clade B on the other hand is the assemblage of populations of the West Coast of Peninsula Malaysia, supported by 90% bootstrap value. Within Clade B, two further clades were defined, namely island population (Pulau Pinang) and mainland populations (Perak, Negeri Sembilan, Johor, and Selangor) supported by 93% and 54% bootstrap value respectively. Populations from southern Peninsula (Negeri Sembilan, Johor and Selangor) and northern Peninsula (Perak) also were distinguished by 54% and 47% bootstrap value correspondingly.
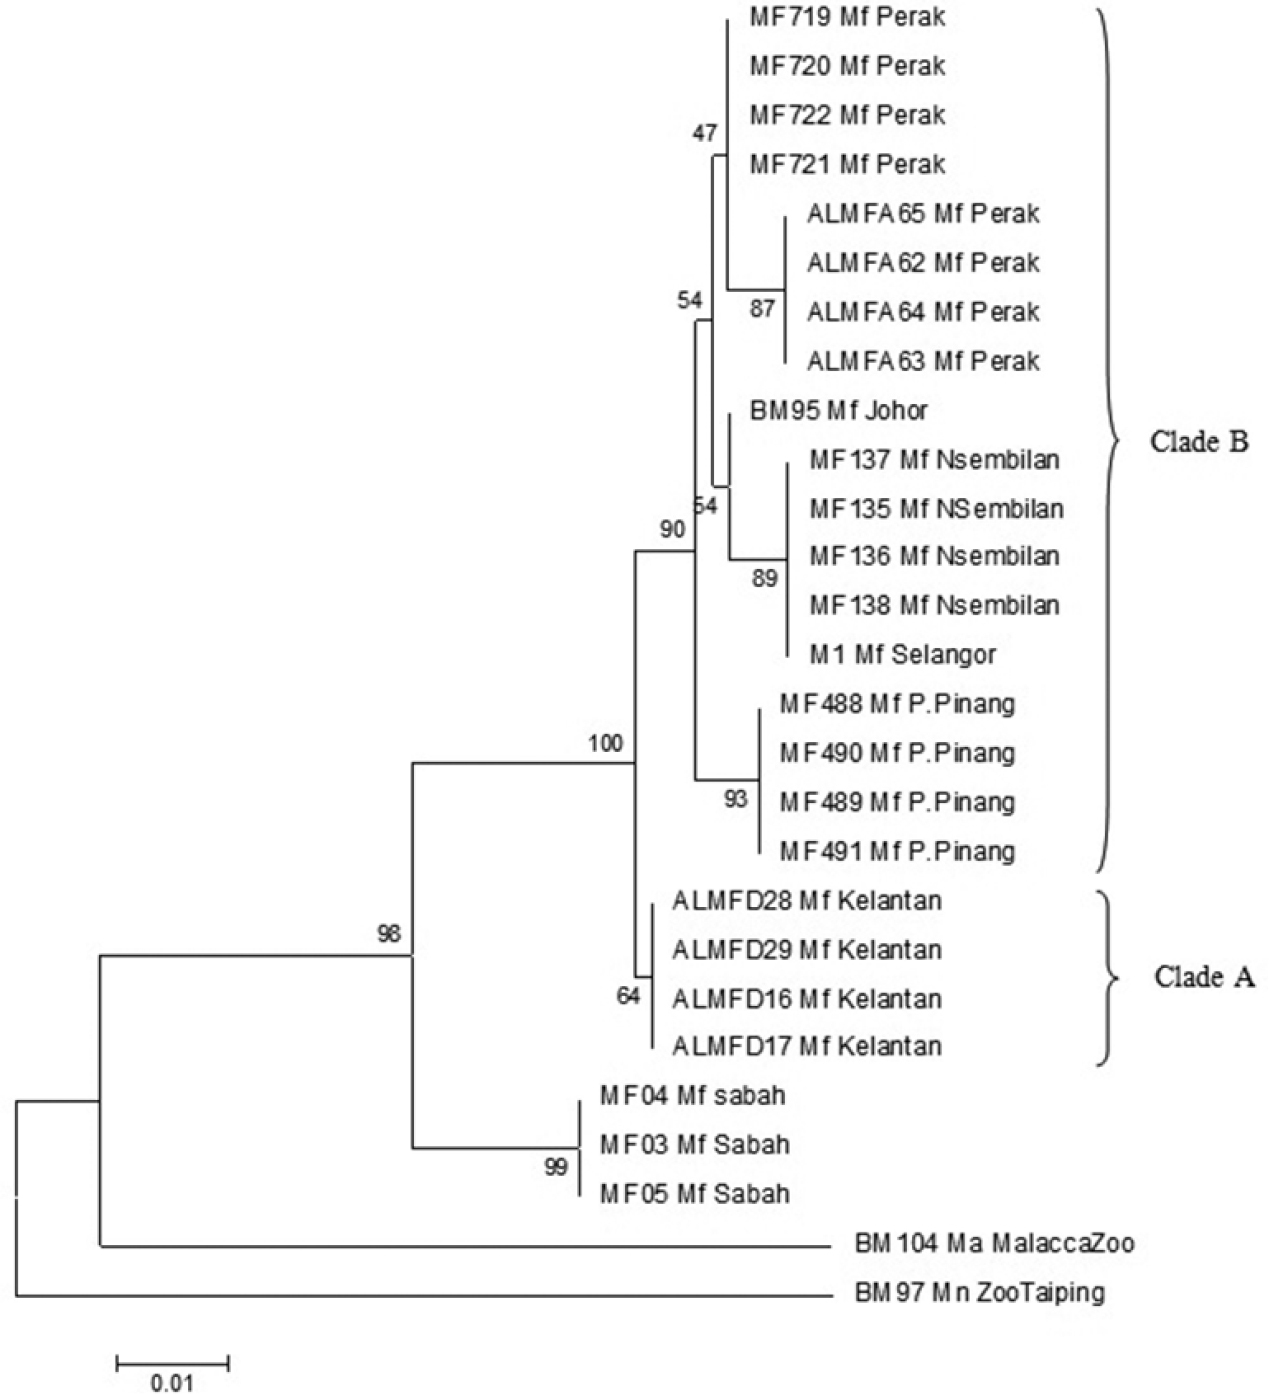
Neighbor joining phylogenetic tree using Kimura-2-Parameter algorithm with bootstrap values indicated on the branch.
MP (Figure 4) analysis was conducted using PAUP 4.0 (CI = 0.929, HI = 0.071, RI = 0.944, RC = 0.878 and tree length = 85). Macaca fascicularis populations were separated into 2 main clades, a Borneo clade and a Peninsula Malaysia clade both supported by 100% bootstrap value in the MP tree. Peninsula Malaysia’s population was further divided into 2 sub clades, the East Coast of Peninsula Malaysia and West Coast of Peninsula Malaysia populations supported by 66% and 72% bootstrap value respectively. The West Coast of Peninsula Malaysia populations were further divided into 2 clades, comprising the mainland and island populations (Pulau Pinang) supported by 45% and 90% bootstrap value. The Northern Peninsula (Perak) and Southern Peninsula (Selangor, Negeri Sembilan and Johor) clades were also separated, both supported by 26% bootstrap value.
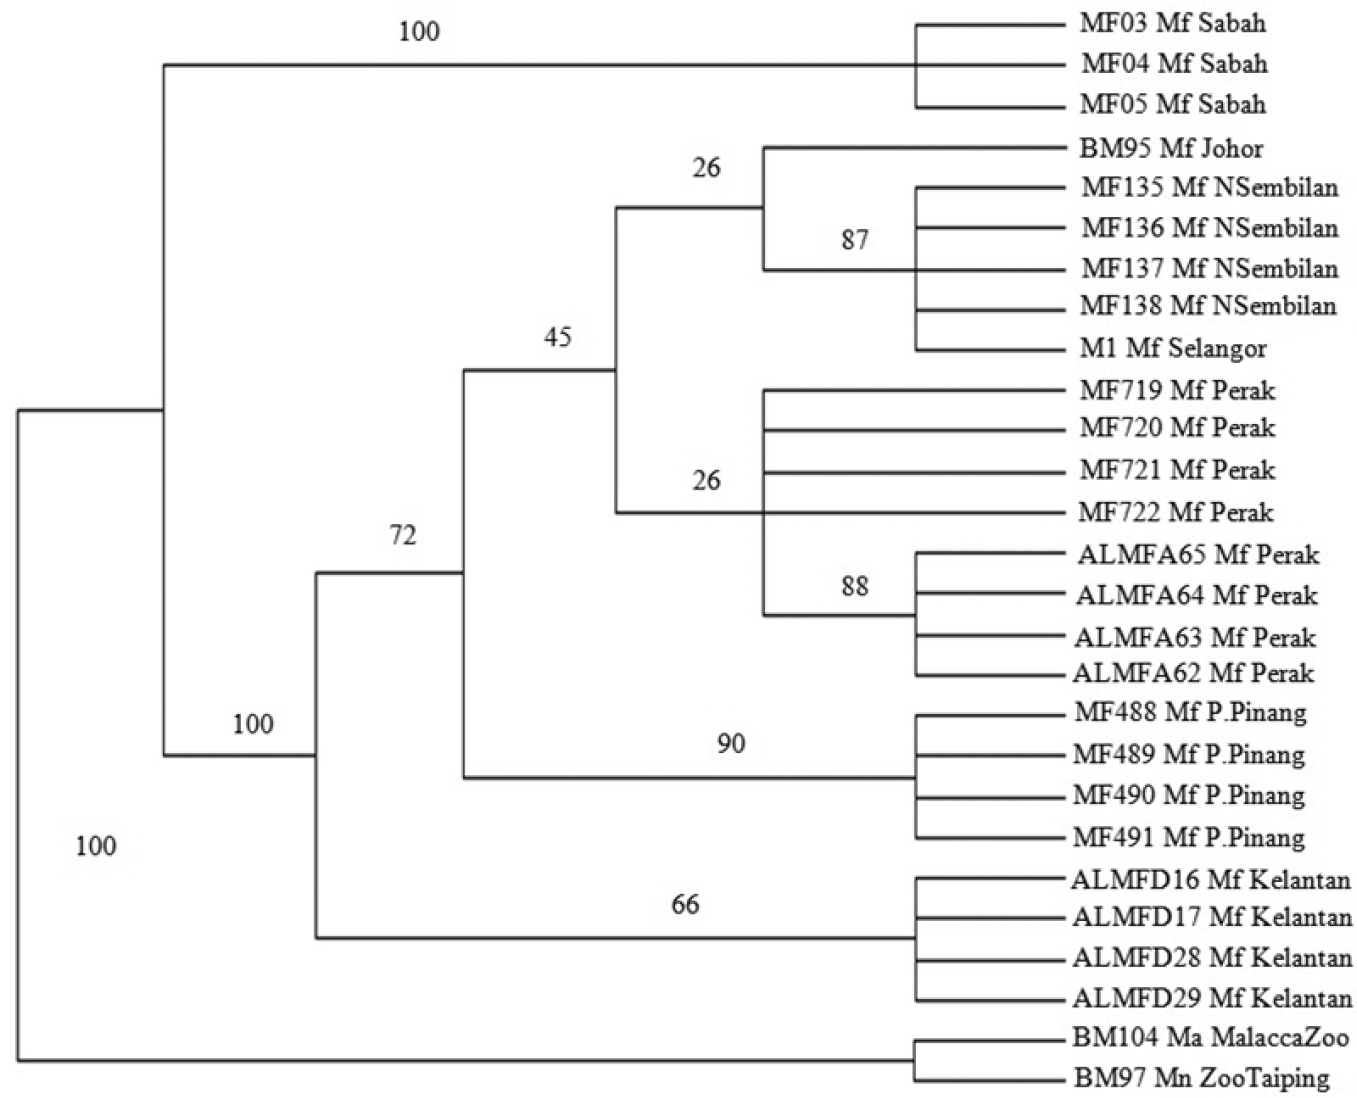
The Bootstrap 50% majority rule consensus maximum parsimony tree of Macaca fascicularis populations. Bootstrap values are indicated on the branch.
Bayesian inference phylogenetic tree (Figure 5) results are generally consistent with neighbor joining and maximum parsimony phylogenetic trees. Separations of Macaca fascicularis populations originating from Borneo and Peninsula Malaysia correspond well with other phylogenetic trees. Within Macaca fascicularis populations from Peninsula Malaysia, the East Coast of Peninsula Malaysia populations are yet again separated from the West Coast of Peninsula Malaysia populations with 0.53 and 0.99 posterior probabilities respectively. The island populations (Pulau Pinang), on the other hand, seem to group together with other mainland populations from the West Coast of Peninsula Malaysia. These are thoroughly inconsistent with both neighbor joining and maximum parsimony phylogenetic trees. The populations from Negeri Sembilan, Selangor and Johor are also distinguished from Macaca fascicularis populations from Perak and Pulau Pinang, supported by a 1.00 and 0.80 posterior probability.
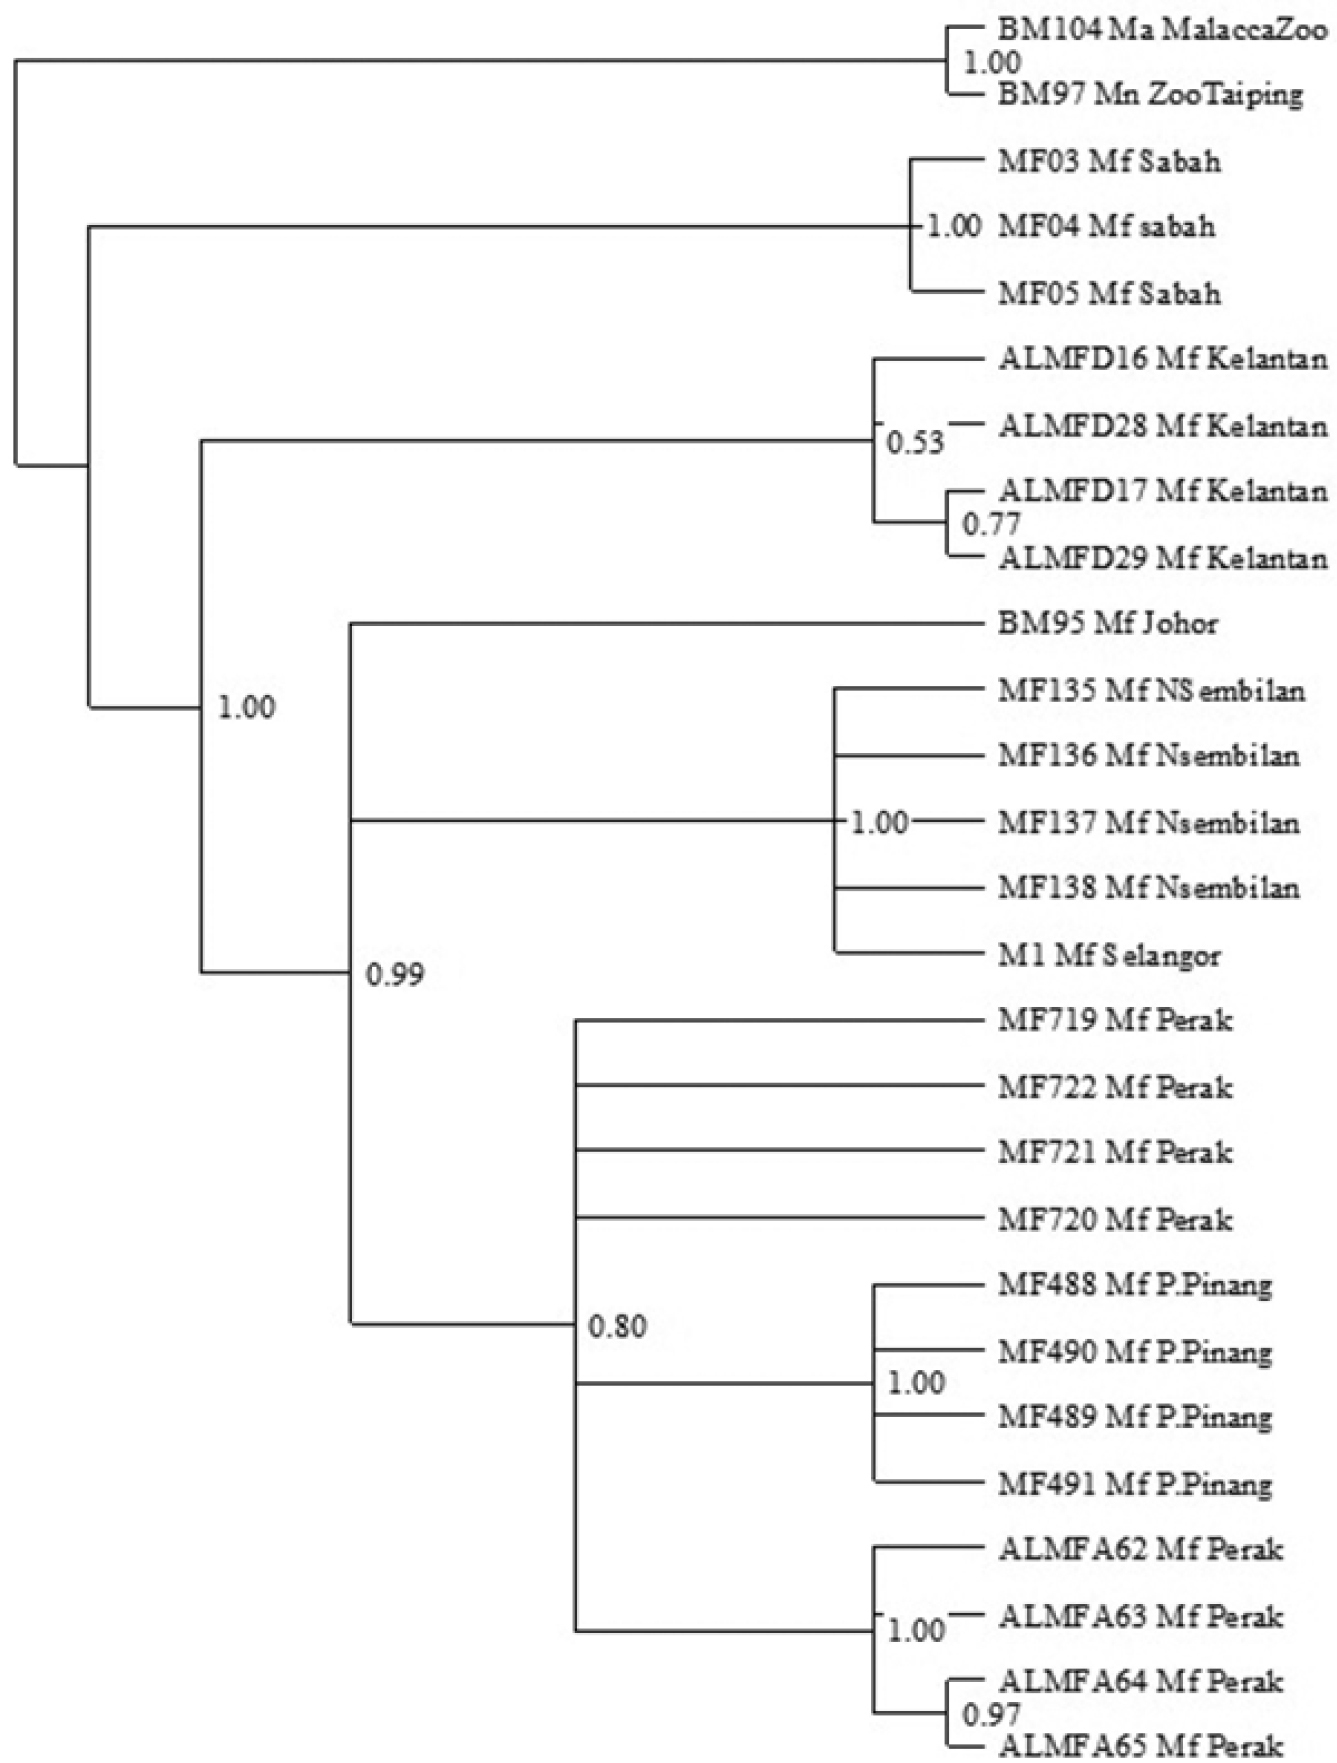
Bayesian inference of the 50% majority rule consensus tree of Cyt b sequence of Macaca fascicularis populations with Bayesian posterior probability (PP) are accordingly indicated on the branch.
Sequence analysis of partial Cyt b sequences indicates that this locus is highly conserved which yielded only 78 (20.37%) variable sites among which only 34 (8.88%) of parsimony informative characters across Macaca fascicularis, Macaca nemestrina and Macaca arctoides.
Macaca fascicularis populations in Malaysia are evidently divided into 2 main clusters: the Borneo populations and Peninsula Malaysia populations. Thirteen parsimony informative characters were detected between these populations from a total of 23 parsimony informative characters. Pairwise genetic distance analysis indicated that the genetic distance between these 2 populations was the highest as compared to other populations in Malaysia with a value of 0.041-0.049, aside from monophyletic states of both populations in all phylogenetic trees. These findings are highly anticipated, considering the vicariance theory on population disjunction as the central thesis. In this scenario, the Borneo populations and Peninsula Malaysia populations are separated by the South China Sea. This separation more than likely caused the interruption of gene flow between both populations, causing them to accrue the major genetic differences observed in this study.
Populations of Macaca fascicularis in Peninsula Malaysia also form 2 further subgroups: east and west. The population from Kelantan forms a single clade in all phylogenetic trees and genetic analysis in comparison to the rest of the Peninsula Malaysia populations. Thus, the Kelantan population likely represents a unique lineage as compared to other populations from Peninsula Malaysia. Results obtained by
The observed genetic differences between populations of Macaca fascicularis are best viewed as subspecies separations. Macaca fascicularis laeta (Elliot, 1909) was recorded by
The results of this study are directly relevant to conservation management strategies of Macaca fascicularis in Malaysia, particularly in terms of the translocation process. The human-macaque conflict has intensified in Malaysia due to habitat degradation and habituation of the species. It is important to recognize the genetic diversity between populations of Macaca fascicularis so we are able to conserve the unique evolutionary lineages of the species. Thus, PERHILITAN can translocate the target populations of Macaca fascicularis within the same gene pool of the other populations (the Borneo-Peninsula; east-west; mainland-island and north-south populations). This translocation is important to avoid the loss of genetic diversity that cannot be recovered, or, in extreme cases, can result in hybridization of populations and potential outbreeding depression of the populations (
The phylogenetic relationships of Malaysia’s long-tailed macaques, Macaca fascicularis, are crucial, as they are at a center of the human-wildlife crisis in the field of primatology, taxonomy and conservation biology. This research has shown that populations of Macaca fascicularis originating from Borneo and Peninsula Malaysia are distinguishable from each other based on genetic data. Within Peninsula Malaysia, further division occurs between the East Coast and West Coast of Peninsula Malaysia; mainland and island and Northern and Southern Peninsula populations. These data can aid the conservation management planning in terms of translocation of the target pest populations within similar gene pools. Further mtDNA and nuclear DNA studies of Macaca fascicularis at the population level are required to increase the number of individuals from each locality and increase the number of geographical locations to represent clades (east-west and Peninsula-Borneo), in which biogeographical factors can also be taken into account.
We thank to Zamzuriada AS and Zahar N for their laboratory contribution. We are deeply indebted to Department of Wildlife and National Parks that provided us with the necessary facilities and assistance for genetic samplings and permit to conduct this research with permit reference number (JPHL&TN(IP): 80-4/2. We would like to thank the Sabah Parks and Sabah Biodiversity Centre. The authors acknowledge Universiti Kebangsaan Malaysia for providing necessary funding, facilities and assistance. This research was supported by grants FRGS/1/2012/STWN10/UKM/02/3, UKM-GUP-2011-168, KOMUNITI-2011-023, ERGS/1/2013/STWN10/UKM/02/1 and DLP-2013-006.