


(C) 2013 Timothy T. Work. This is an open access article distributed under the terms of the Creative Commons Attribution License 3.0 (CC-BY), which permits unrestricted use, distribution, and reproduction in any medium, provided the original author and source are credited.
For reference, use of the paginated PDF or printed version of this article is recommended.
Increased interest in biomass harvesting for bioenergetic applications has raised questions regarding the potential ecological consequences on forest biodiversity. Here we evaluate the initial changes in the abundance, species richness and community composition of rove (Staphylinidae) and ground beetles (Carabidae), immediately following 1) stem-only harvesting (SOH), in which logging debris (i.e., tree tops and branches) are retained on site, and 2) whole-tree harvesting (WTH), in which stems, tops and branches are removed in mature balsam fir stands in Quebec, Canada. Beetles were collected throughout the summer of 2011, one year following harvesting, using pitfall traps. Overall catch rates were greater in uncut forest (Control) than either stem-only or whole-tree harvested sites. Catch rates in WTH were greater than SOH sites. Uncut stands were characterized primarily by five species: Atheta capsularis, Atheta klagesi, Atheta strigosula, Tachinus fumipennis/frigidus complex (Staphylinidae) and to a lesser extent to Pterostichus punctatissimus (Carabidae). Increased catch rates in WTH sites, where post-harvest biomass was less, were attributable to increased catches of rove beetles Pseudopsis subulata, Quedius labradorensis and to a lesser extent Gabrius brevipennis. We were able to characterize differences in beetle assemblages between harvested and non-harvested plots as well as differences between whole tree (WTH) and stem only (SOH) harvested sites where logging residues had been removed or left following harvest. However, the overall assemblage response was largely a recapitulation of the responses of several abundant species.
Biomass removal, tree harvesting, boreal forest, Coleoptera, Staphylinidae, Carabidae
Increased interest in the use of forest biomass for bioenergy production has been met with concerns related to potential negative impacts of increased biomass harvesting on biodiversity (
Litter dwelling beetles have been recognized as useful indicators of forest change and ecosystem functioning (
Here we present initial responses of rove and ground beetles to removal of logging residues following clearcut harvesting. As with any study examining a relatively high number of species, we expected to observe a variety of species-specific responses. However as an initial starting hypothesis, we speculated that removal of forest overstory combined with removal of residual forest biomass in the form of logging debris would result in lower abundances of individual species compared with sites where only overstory was removed. We further expected that these would translate to overall assemblage-level differences between harvested sites where additional biomass had been removed and sites that had experienced only clearcut harvesting.
We sampled beetles using pitfall traps within the Montmorency Teaching and Research Forest (47°13' and 47°22'N, and 71°05' and 71°11'W)approximately 70 km north of Quebec City, Quebec (Fig. 1). This project is part of a long-term national study on monitoring of the effects of biomass harvesting on forest ecosystem functioning (
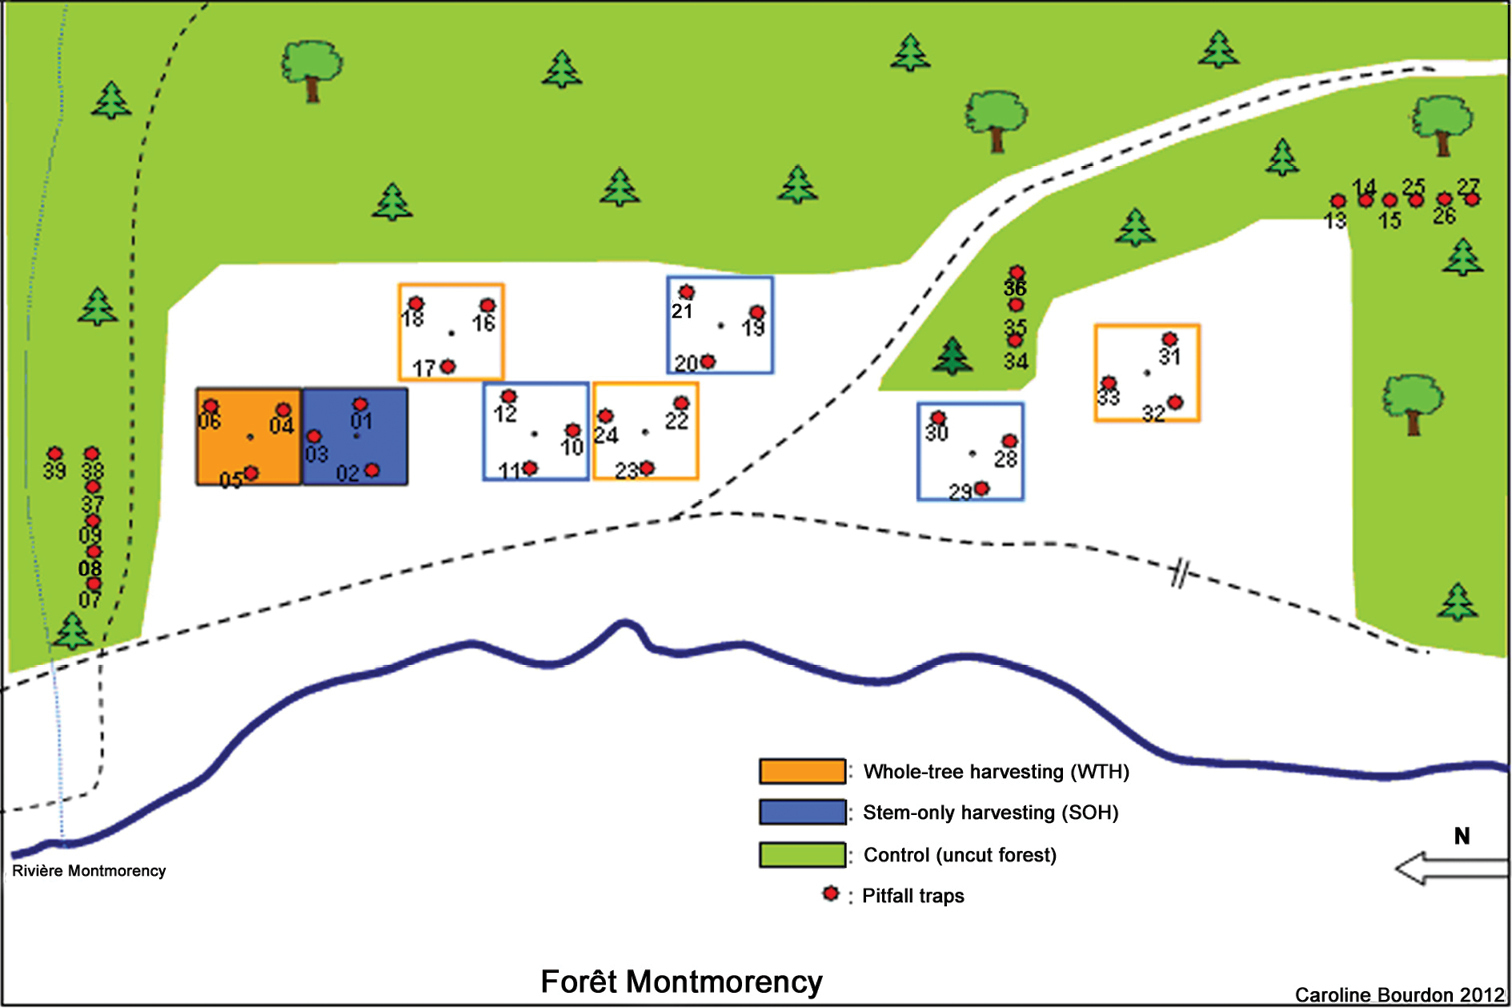
Schematic representation of treatments with pitfall trap locations, Forêt Montmorency, Quebec.
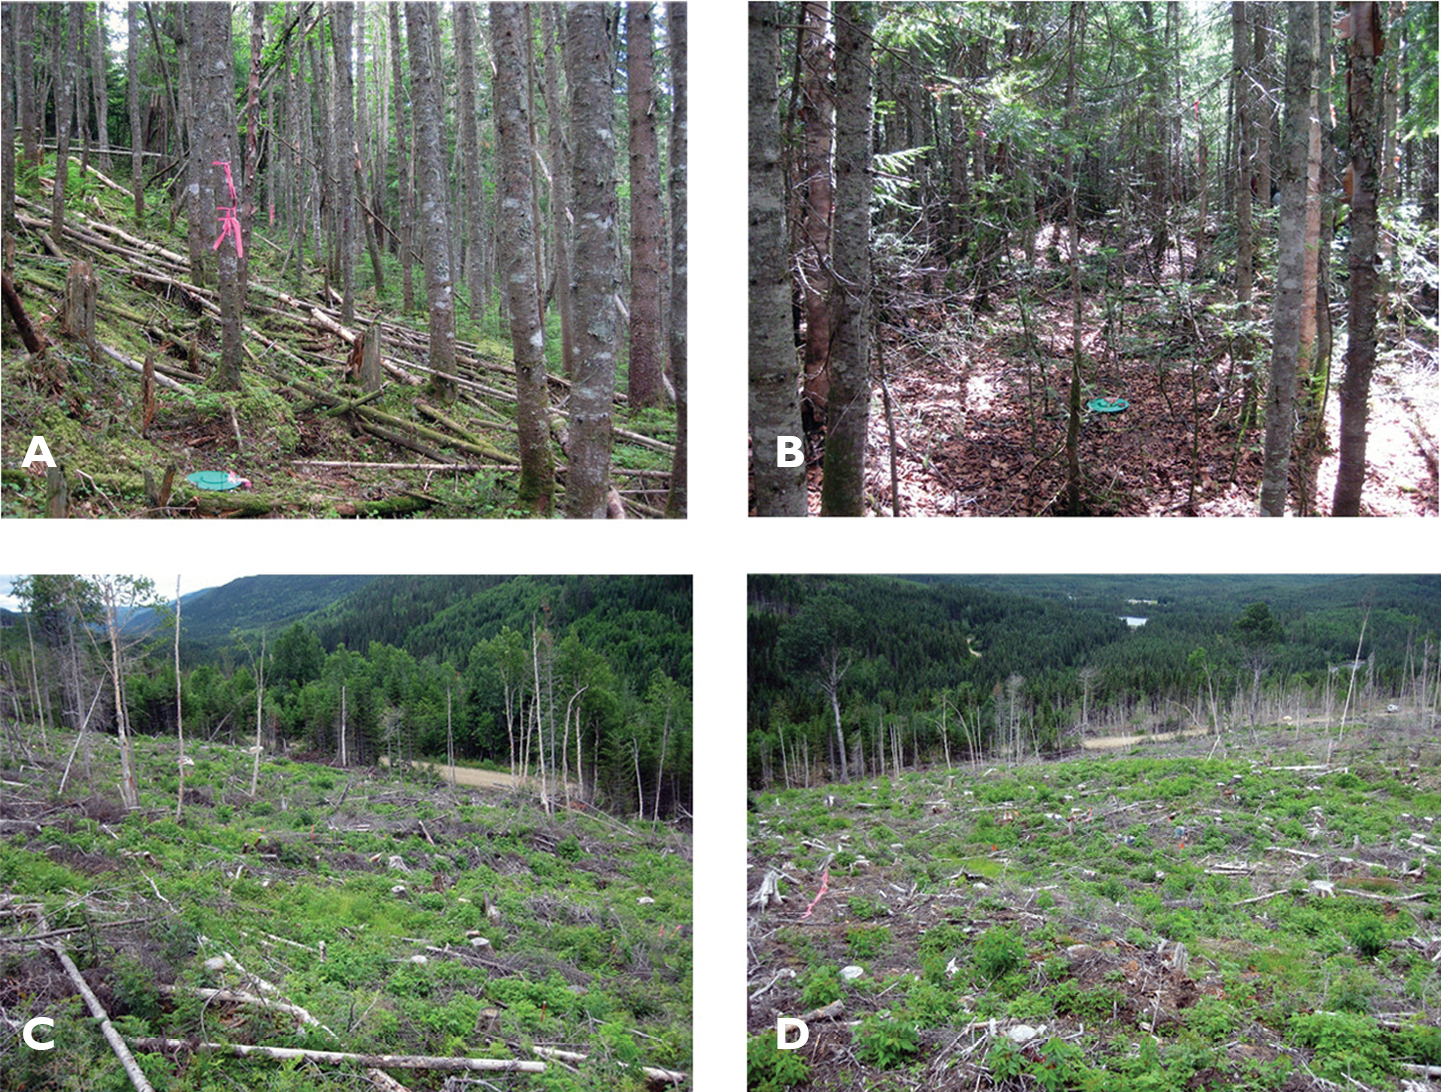
Photographs of experimental plots taken one year following harvest (2012) A, B photos of uncut forests (Control) C stem-only harvested plot (SOH) (operational level) D whole-tree harvested plot (WTH).
Woody debris volumes were estimated from two 20-m-long perpendicular transects intercepting the centre of each plot using the line intersect method (
We used commercially produced pitfall traps 12 cm in diameter (Bio-Control Inc., Quebec City) with rain covers spaced 10-15 m apart (see details of trap design in
Debris volumes for both small and coarse woody material were compared separately among treatments using linear models where the stem-only harvesting (SOH) treatment was chosen as a reference. Abundances were converted to catch rates to account for differences in trapping effort between sites, which varied due to infrequent disturbances to particular traps by vertebrates over the course of the sampling season and the total number of traps placed within each experimental parcel. Abundances at individual traps were pooled to calculate catch rates for each experimental plot. Thus in harvest plots, catch rates reflect the combined trapping effort of three traps over the course of the season (231 trap days/plot). The number of traps per control plot varied between 3 and 6, corresponding to 203 and to 462 total trap days. We compared overall catch rates among silvicultural treatments using simple linear regression where total catch rate was square root transformed to meet assumptions of normality. We also compared catch rates of the 19 most abundant species (those that comprised more than 2% of the total catch rate) among treatments using non-parametric Kruskal-Wallis rank sum tests.
We analyzed differences in beetle species composition using multivariate regression tree (MRT) analysis (
Volumes of both fine and coarse debris were higher in clearcuts following harvest as compared with uncut stands (fine debris ANOVA F2, 8=12.73, P=0.003, coarse debris ANOVA F2, 8=8.12, P=0.011; Fig. 3). Whereas volumes of fine debris were greater in clearcuts, there was no difference in FWD volumes between stem-only and whole-tree harvested plots (β=-0.06 (0.35), Wald t-value = -0.173, p= 0.867). For coarse debris (CWD), whole-tree harvested plots had reduced volumes as compared with stem-only harvested plots (β=-34.20 (17.74), Wald t-value = -1.927, p= 0.090), although these differences could only be characterized as nearly significant with alpha = 0.05.
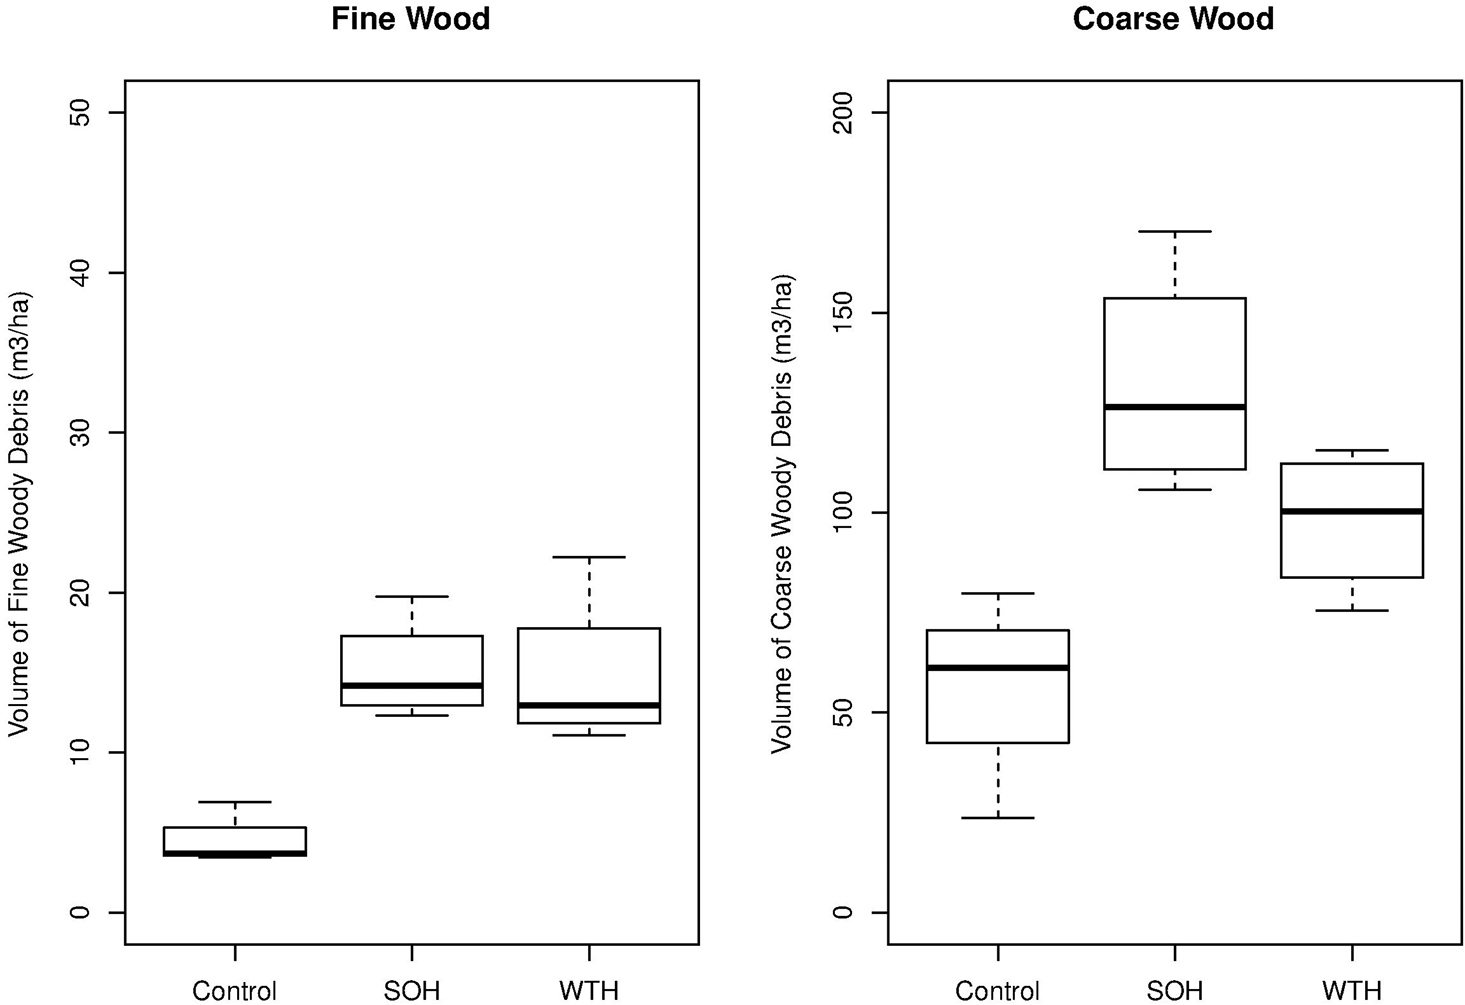
Boxplots showing volume of fine and coarse woody debris in stem-only harvested plots (SOH), whole-tree harvested plots (WTH), and in uncut forest (Control). Bold line depicts median value, box denotes 25–75% quantile range, whiskers correspond to 1.5 times the interquartile range.
We collected 70 species of rove and ground beetles representing 1665 individuals between June 9 and August 25, 2011 (Appendix Tables 4 and 5). Of the total number of individuals collected, 1278 (53 species) were rove beetles and 387 (17 species) were ground beetles (Table 1). Harvesting reduced overall catch rates in both SOH sites (β=-0.33 (0.041), Wald t-value= -8.01, p<0.001) and WTH (β=-0.14 (0.041), Wald t-value= -3.39, p=0.009) as compared with control stands (ANOVA F2, 8=33.15, P<0.001) (Fig. 4). The high overall abundances in uncut stands is attributable to three species of Atheta (Atheta capsularis, Atheta klagesi and Atheta strigosula), Tachinus fumipennis/frigidus complex and to a lesser extent Pterostichus punctatissimus (Table 2, Fig. 5). Increased catch in whole-tree harvested plots was observed for three species: Pseudopsis subulata, Quedius labradorensis and to a lesser extent Gabrius brevipennis (Table 2, Fig. 5). With the exception of these species, we were unable to detect statistically significant differences in catch rates between whole-tree and stem-only harvested plots.
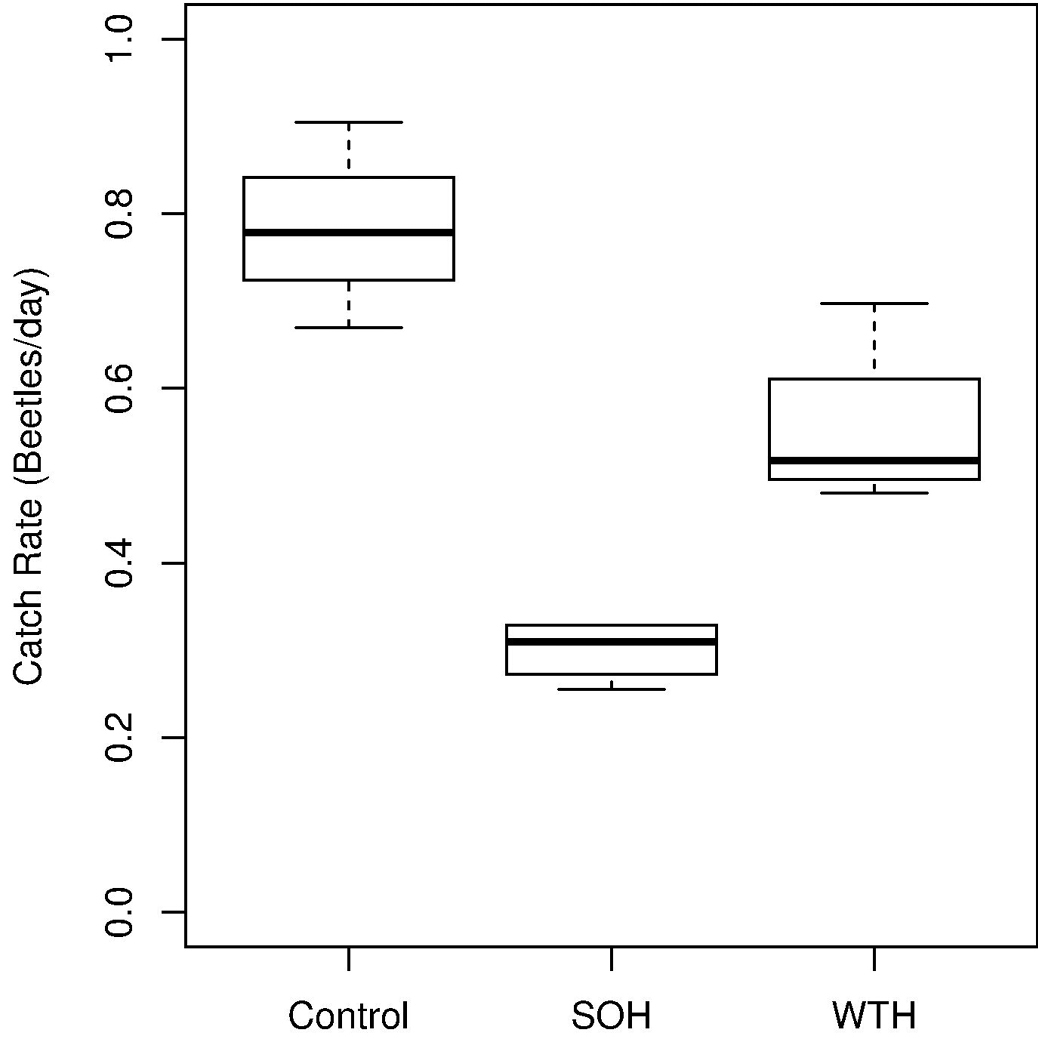
Boxplots depicting overall catch rates (beetles/day) where forest was a clearcut and deadwood was left intact (SOH) b clearcut with quantity of deadwood reduced (WTH), and c uncut forest (Control). Bold line depicts median value, box denotes 25–75% quantile range, whiskers correspond to 1.5 times the interquartile range.
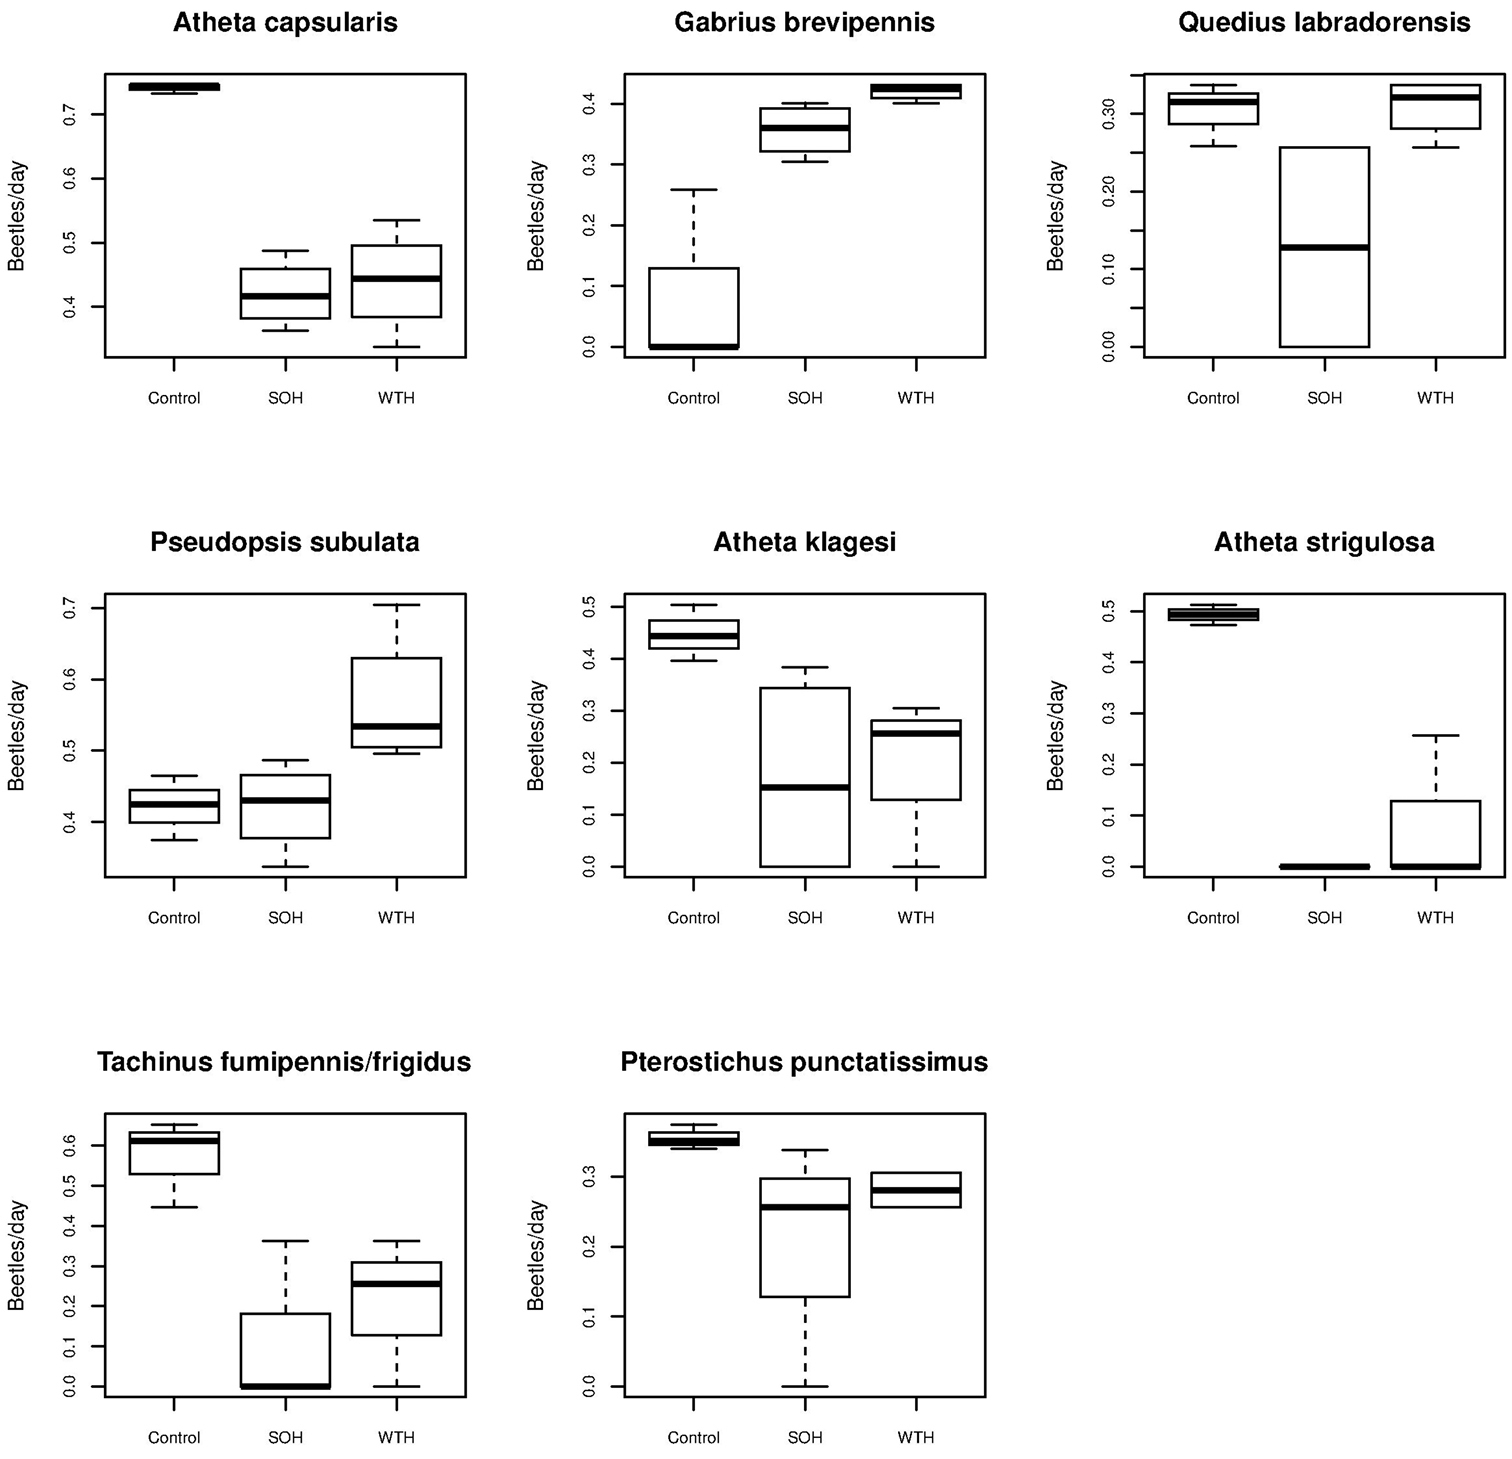
Boxplots depicting catch rates (beetles/day) for eight abundant species collected from experimental plots where forest was a clearcut and deadwood was left intact (SOH) b clearcut with quantity of deadwood reduced (WTH), and c uncut forest (Control). Bold line depicts median value, box denotes 25–75% quantile range, whiskers correspond to 1.5 times the interquartile range.
Abundance of beetle species in dead wood reduced plots (WTH), and in deadwood intact plots (SOH), and in uncut forest (Control). Rove and ground beetle species mixed and listed alphabetically.
| Species | WTH | SOH | Control |
|---|---|---|---|
| Acidota quadrata | 0 | 0 | 1 |
| Agonum gratiosum | 0 | 0 | 1 |
| Agonum retractum | 0 | 0 | 3 |
| Aleochara sp. n. | 1 | 1 | 0 |
| Aleochara verna | 0 | 1 | 0 |
| Aleochara fumata | 1 | 0 | 0 |
| Atheta ventricosa | 2 | 2 | 15 |
| Atheta regisalmonis | 0 | 0 | 1 |
| Atheta remulsa | 0 | 1 | 1 |
| Atheta terranovae | 0 | 0 | 3 |
| Atheta (Microdota) sp. | 1 | 0 | 1 |
| Atheta klagesi | 4 | 7 | 52 |
| Atheta capsularis | 40 | 31 | 334 |
| Atheta sp. | 1 | 0 | 1 |
| Atheta strigulosa | 1 | 0 | 66 |
| Atrecus macrocephalus | 10 | 17 | 3 |
| Bembidion grapii | 2 | 0 | 0 |
| Bembidion wingatei | 7 | 5 | 6 |
| Bisnius cephalicus | 1 | 1 | 1 |
| Calathus advena | 0 | 1 | 1 |
| Calathus ingratus | 19 | 4 | 12 |
| Eusphalerum pothos | 0 | 0 | 1 |
| Gabrius brevipennis | 29 | 16 | 2 |
| Gabrius sp. | 0 | 1 | 0 |
| Harpalus laticeps | 0 | 1 | 0 |
| Harpalus rufipes | 4 | 0 | 0 |
| Harpalus solitaris | 3 | 0 | 0 |
| Ischnosoma fimbriatum | 33 | 25 | 12 |
| Ischnosoma pictum | 5 | 3 | 1 |
| Lathrobium washingtoni | 1 | 2 | 0 |
| Leptusa opaca | 1 | 0 | 0 |
| Liogluta aloconotoides | 9 | 0 | 11 |
| Lordithon fungicola | 0 | 1 | 0 |
| Lypoglossa franclemonti | 27 | 12 | 1 |
| Megarthrus sp. | 0 | 0 | 1 |
| Mocyta breviuscula | 0 | 0 | 3 |
| Mocyta fungi | 0 | 1 | 0 |
| Mycetoporus americanus | 5 | 3 | 13 |
| Mycetoporus consors | 0 | 2 | 0 |
| Omalium rivulare | 0 | 1 | 0 |
| Oxypoda frigida | 1 | 1 | 1 |
| Oxypoda grandipennis | 0 | 1 | 18 |
| Oxypoda lacustris | 0 | 0 | 3 |
| Oxypoda operta | 1 | 0 | 0 |
| Oxypoda pseudolustrica | 8 | 5 | 2 |
| Phloeostiba lapponica | 7 | 2 | 0 |
| Placusa incompleta | 0 | 0 | 2 |
| Platynus decentris | 1 | 2 | 7 |
| Proteinus sp. | 2 | 1 | 3 |
| Pseudopsis subulata | 109 | 32 | 40 |
| Pterostichus adstrictus | 91 | 47 | 52 |
| Pterostichus brevicornis | 1 | 0 | 1 |
| Pterostichus coracinus | 24 | 19 | 30 |
| Pterostichus punctatissimus | 6 | 5 | 17 |
| Quedius densiventris | 14 | 1 | 5 |
| Quedius fulvicollis | 4 | 0 | 1 |
| Quedius labradorensis | 9 | 2 | 10 |
| Quedius plagiatus | 0 | 1 | 0 |
| Seeversiella globicollis | 3 | 2 | 0 |
| Sphaeroderus nitidicollis | 0 | 1 | 1 |
| Stenus austini | 2 | 0 | 0 |
| Tachinus fumipennis | 6 | 4 | 120 |
| Tachinus luridus | 0 | 1 | 1 |
| Tachinus quebecensis | 0 | 0 | 11 |
| Tachyporus nitidulus | 9 | 5 | 1 |
| Tachyporus sp. | 1 | 1 | 0 |
| Trechus apicalis | 5 | 5 | 1 |
| Trechus crassiscapus | 0 | 1 | 1 |
| Zyras obliqus | 0 | 0 | 1 |
Kruskal-Wallis comparison of abundant rove and ground beetle species that responded to harvest.
| Species | Kruskal-Wallis Chi-Square | df | p-value |
|---|---|---|---|
| Negatively Affected by Harvesting | |||
| Atheta capsularis | 6.13 | 2 | 0.047 |
| Atheta klagesi | 6.18 | 2 | 0.046 |
| Atheta srigulosa | 8.29 | 2 | 0.016 |
| Tachinus fumipennis | 6.78 | 2 | 0.034 |
| Pterostichus punctatissimus | 6.51 | 2 | 0.039 |
| Positively Affected by Harvesting | |||
| Pseudopsis subulata | 7.00 | 2 | 0.030 |
| Quedius labradorensis | 6.30 | 2 | 0.043 |
| Gabrius brevipennis | 8.68 | 2 | 0.013 |
The sum-of-squares multivariate regression tree divided 11 sites into three nodes which explained 64.5% of the total variance (Table 3, Fig. 6). The initial split explained 46.5% of the variance. This split is attributable to either the treatment difference between uncut and harvested sites or sites that had more than 9 m3/ha fine woody debris, both of which offered equal improvement for the multivariate regression tree (improvement by 0.4646). This split was defined by three species of Atheta (Atheta capsularis, Atheta klagesi and Atheta strigosula) and Tachinus fumipennis/frigidus complexcommonly collected in uncut sites and Gabrius brevipennis, which was commonly collected in harvested sites.The second split explained an additional 8% of the total variance. This split is attributable to treatment differences between whole-tree and stem-only harvested sites or to sites with more than 112 m3/ha of coarse woody debris. Both of these factors provided similar improvement in the overall tree (improvement by 0.2389 and 0.2381 respectively) and could be judged to be nearly equivalent. The second split was defined primarily by Pseudopsis subulata commonly collected in sites with reduced volumes of debris.
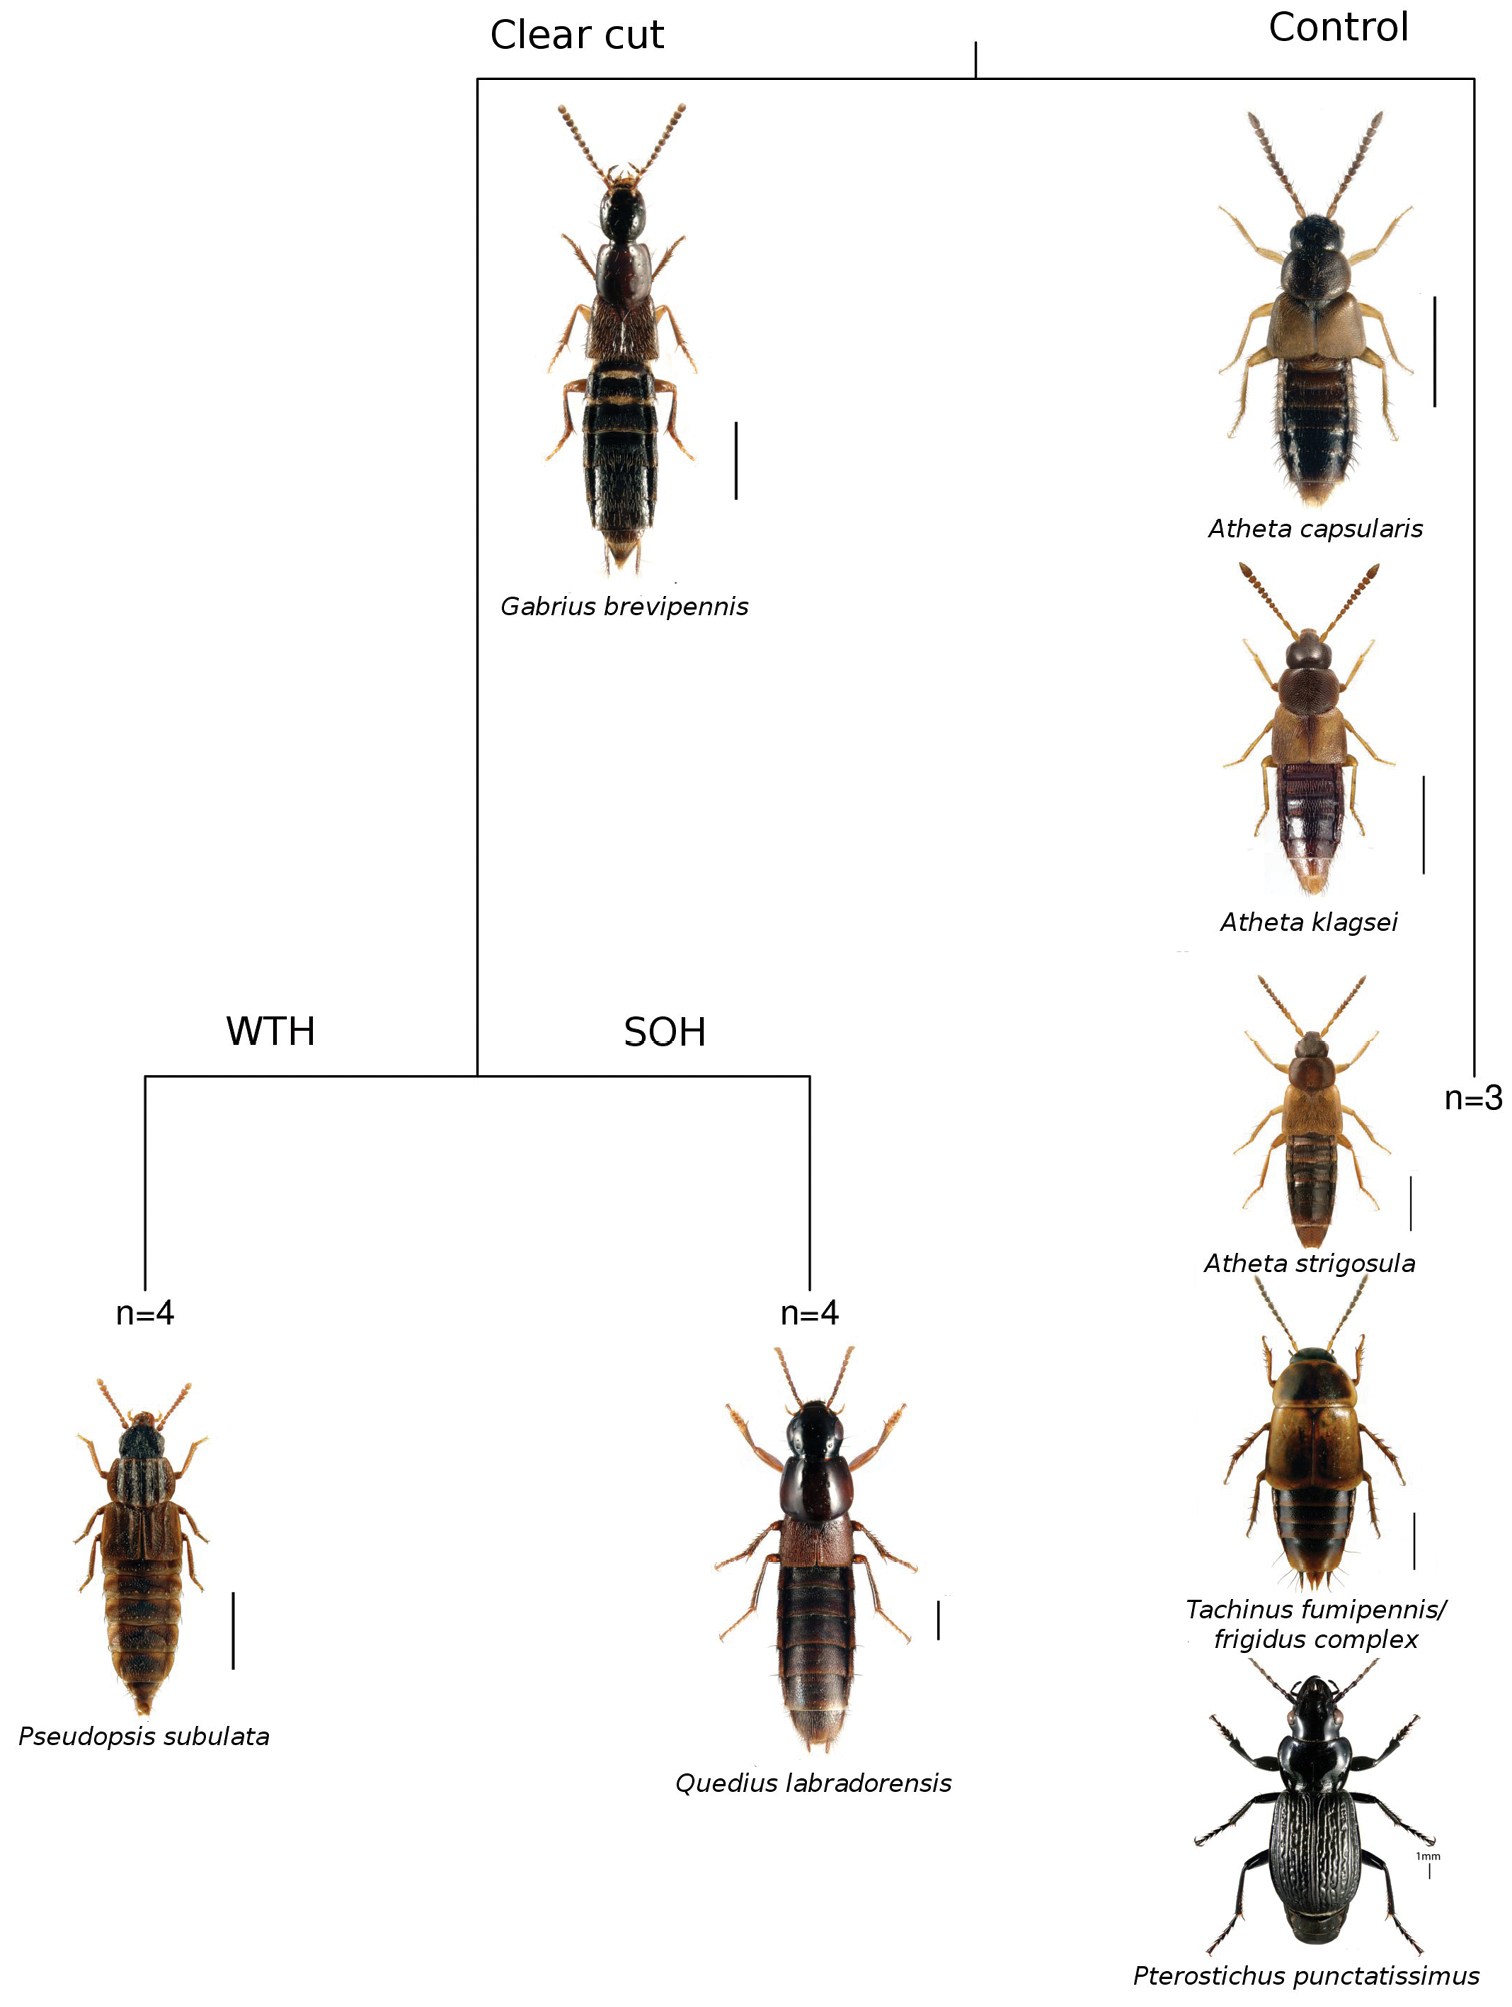
Multivariate regression tree based on sum-of-squares depicting differences in beetle assemblages among experimental plots where forest was a clearcut with stem-only harvested (SOH) b clearcut with whole-tree harvested (WTH), and c uncut forest (Control). The tree was selected based on 935/1000 cross-validations and explains 64% of the variance. Both experimental treatment and deadwood volumes provided equivalent improvement at each split. We have labelled splits using experimental treatments.
Species variance associated with splits in the multivariate regression tree model.
| Species | Splits | Total Variance Explained | Species totals | |
|---|---|---|---|---|
| Harvested vs Control | SOH vs WTH | |||
| Atheta capsularis | 15.44 | 0.04 | 15.48 | 16.65 |
| Tachinus fumipennis | 9.63 | 0.12 | 9.74 | 12.45 |
| Atheta strigulosa | 6.55 | 0.03 | 6.58 | 6.80 |
| Pseudopsis subulata | 0.68 | 2.38 | 3.06 | 5.82 |
| Lypoglossa franclemonti | 1.01 | 0.33 | 1.33 | 5.23 |
| Atheta klagesi | 2.49 | 0.00 | 2.49 | 3.87 |
| Pterostichus adstrictus | 0.46 | 1.05 | 1.52 | 3.41 |
| Gabrius brevipennis | 2.02 | 0.25 | 2.27 | 2.62 |
| Pterostichus coracinus | 0.02 | 0.06 | 0.07 | 2.51 |
| Atrecus macrocephalus | 0.51 | 0.12 | 0.63 | 2.37 |
| Ischnosoma fimbriatum | 1.27 | 0.07 | 1.34 | 2.25 |
| Calathus ingratus | 0.04 | 1.02 | 1.06 | 2.17 |
| Quedius densiventris | 0.03 | 0.92 | 0.94 | 2.11 |
| Liogluta aloconotoides | 0.47 | 0.70 | 1.17 | 1.92 |
| Oxypoda grandipennis | 0.86 | 0.03 | 0.89 | 1.80 |
| Atheta ventricosa | 0.45 | 0.00 | 0.45 | 1.77 |
| Mycetoporus americanus | 0.08 | 0.06 | 0.14 | 1.53 |
| Platynus decentris | 0.29 | 0.03 | 0.32 | 1.41 |
| Tachyporus nitidulus | 0.33 | 0.01 | 0.34 | 1.27 |
| Trechus apicalis | 0.13 | 0.01 | 0.14 | 1.27 |
| Oxypoda pseudolustrica | 0.11 | 0.13 | 0.24 | 1.24 |
| Tachinus quebecensis | 1.02 | 0.00 | 1.02 | 1.08 |
| Phloeostiba lapponica | 0.39 | 0.26 | 0.66 | 1.07 |
| Species with < 1% of species totals combined | 2.19 | 2.35 | 4.54 | 17.40 |
| Totals | 46.47 | 9.96 | 56.43 | 100.00 |
We were able to detect differences in beetle assemblages among harvested and unharvested plots (Control), and between stem-only (SOH) (i.e. logging residues left on site) and whole-tree (WTH) (i.e. logging residues removed) harvesting treatments. By far the most common species response that we observed was a reduction in abundance in response to removal of the overstory by harvesting, suggesting that at least initially, removal of forest overstory is more important than depletions in the overall volumes of downed deadwood. Of the species with clear responses to harvesting in general, three Atheta species and Atheta fumipennis/frigidus complex had abundances roughly half of those observed in unharvested plots. Similar trends in reduction of abundance caused by harvesting occurred in a yellow birch/balsam fir forest study in Quebec (
While we were able to distinguish assemblages in stem-only harvested (SOH) stands from those in whole-tree harvested (WTH) stands, this split was defined primarily on increased catches of Pseudopsis subulata. This in itself is interesting as this species was shown to prefer older forests rather than freshly harvested sites in Newfoundland, Canada (
Numerous hypotheses can be advanced to explain these responses, including changes in microclimate (for all species) or loss of potential feeding sites such as decaying mushrooms infested with dipteran larvae (for Tachinus). Significant changes in microclimatic conditions occur at the soil surface following removal of harvest residues because the soil becomes more directly exposed to sun radiation and air movement, which cause increased soil temperature and reduce soil moisture (
Based on 1 year of sampling, we were able to characterize differences in beetle assemblages between clearcut sites (SOH, WTH) and mature stands (Control), as well as differences between clearcut sites where harvest residues had been removed (WTH) or left on site (SOH). The overall assemblage response was largely a recapitulation of the responses of several abundant species. While community-level analysis represents the response of abundantly captured species, we believe that we are likely unable to detect the full extent of the effects of residue removal based on a 1-year experiment. While the MRT allowed us to distinguish different assemblages that were attributable to experimental plots, we were unable to definitively explain assemblage differences on the basis of volumes of either coarse (CWD) or fine woody debris (FWD). This does not necessarily preclude conclusions as to the effect of the silvicultural treatments and the biomass removals, but it does to an extent preclude finer scale mechanistic explanations of changes in particular species. The long-term monitoring studies should allow us to better understand the influence of various levels of postharvest debris removal on biodiversity, nutrient production and circling and eventually tree growth.
We are grateful to the following individuals and organizations for contributing to our research: authorities of the Laurentian Forestry Centre (LFC), summer students partici- pating in field collecting and laboratory sample processing, and technical assistance: A. Gilbert, L. Helie, and R. Batista. Ricky Batista provided all the colour beetle images presented in this publication. We thank Pamela Cheers (LFC) for editing the text. Jon Sweeney of the Atlantic Forestry Centre provided some unpublished data on rove beetle species from his study in red spruce forests. Université Laval provided assistance in field preparation and access to research plots.
Colour images of the most abundant rove and ground beetles, and detailed list of specimens examined.
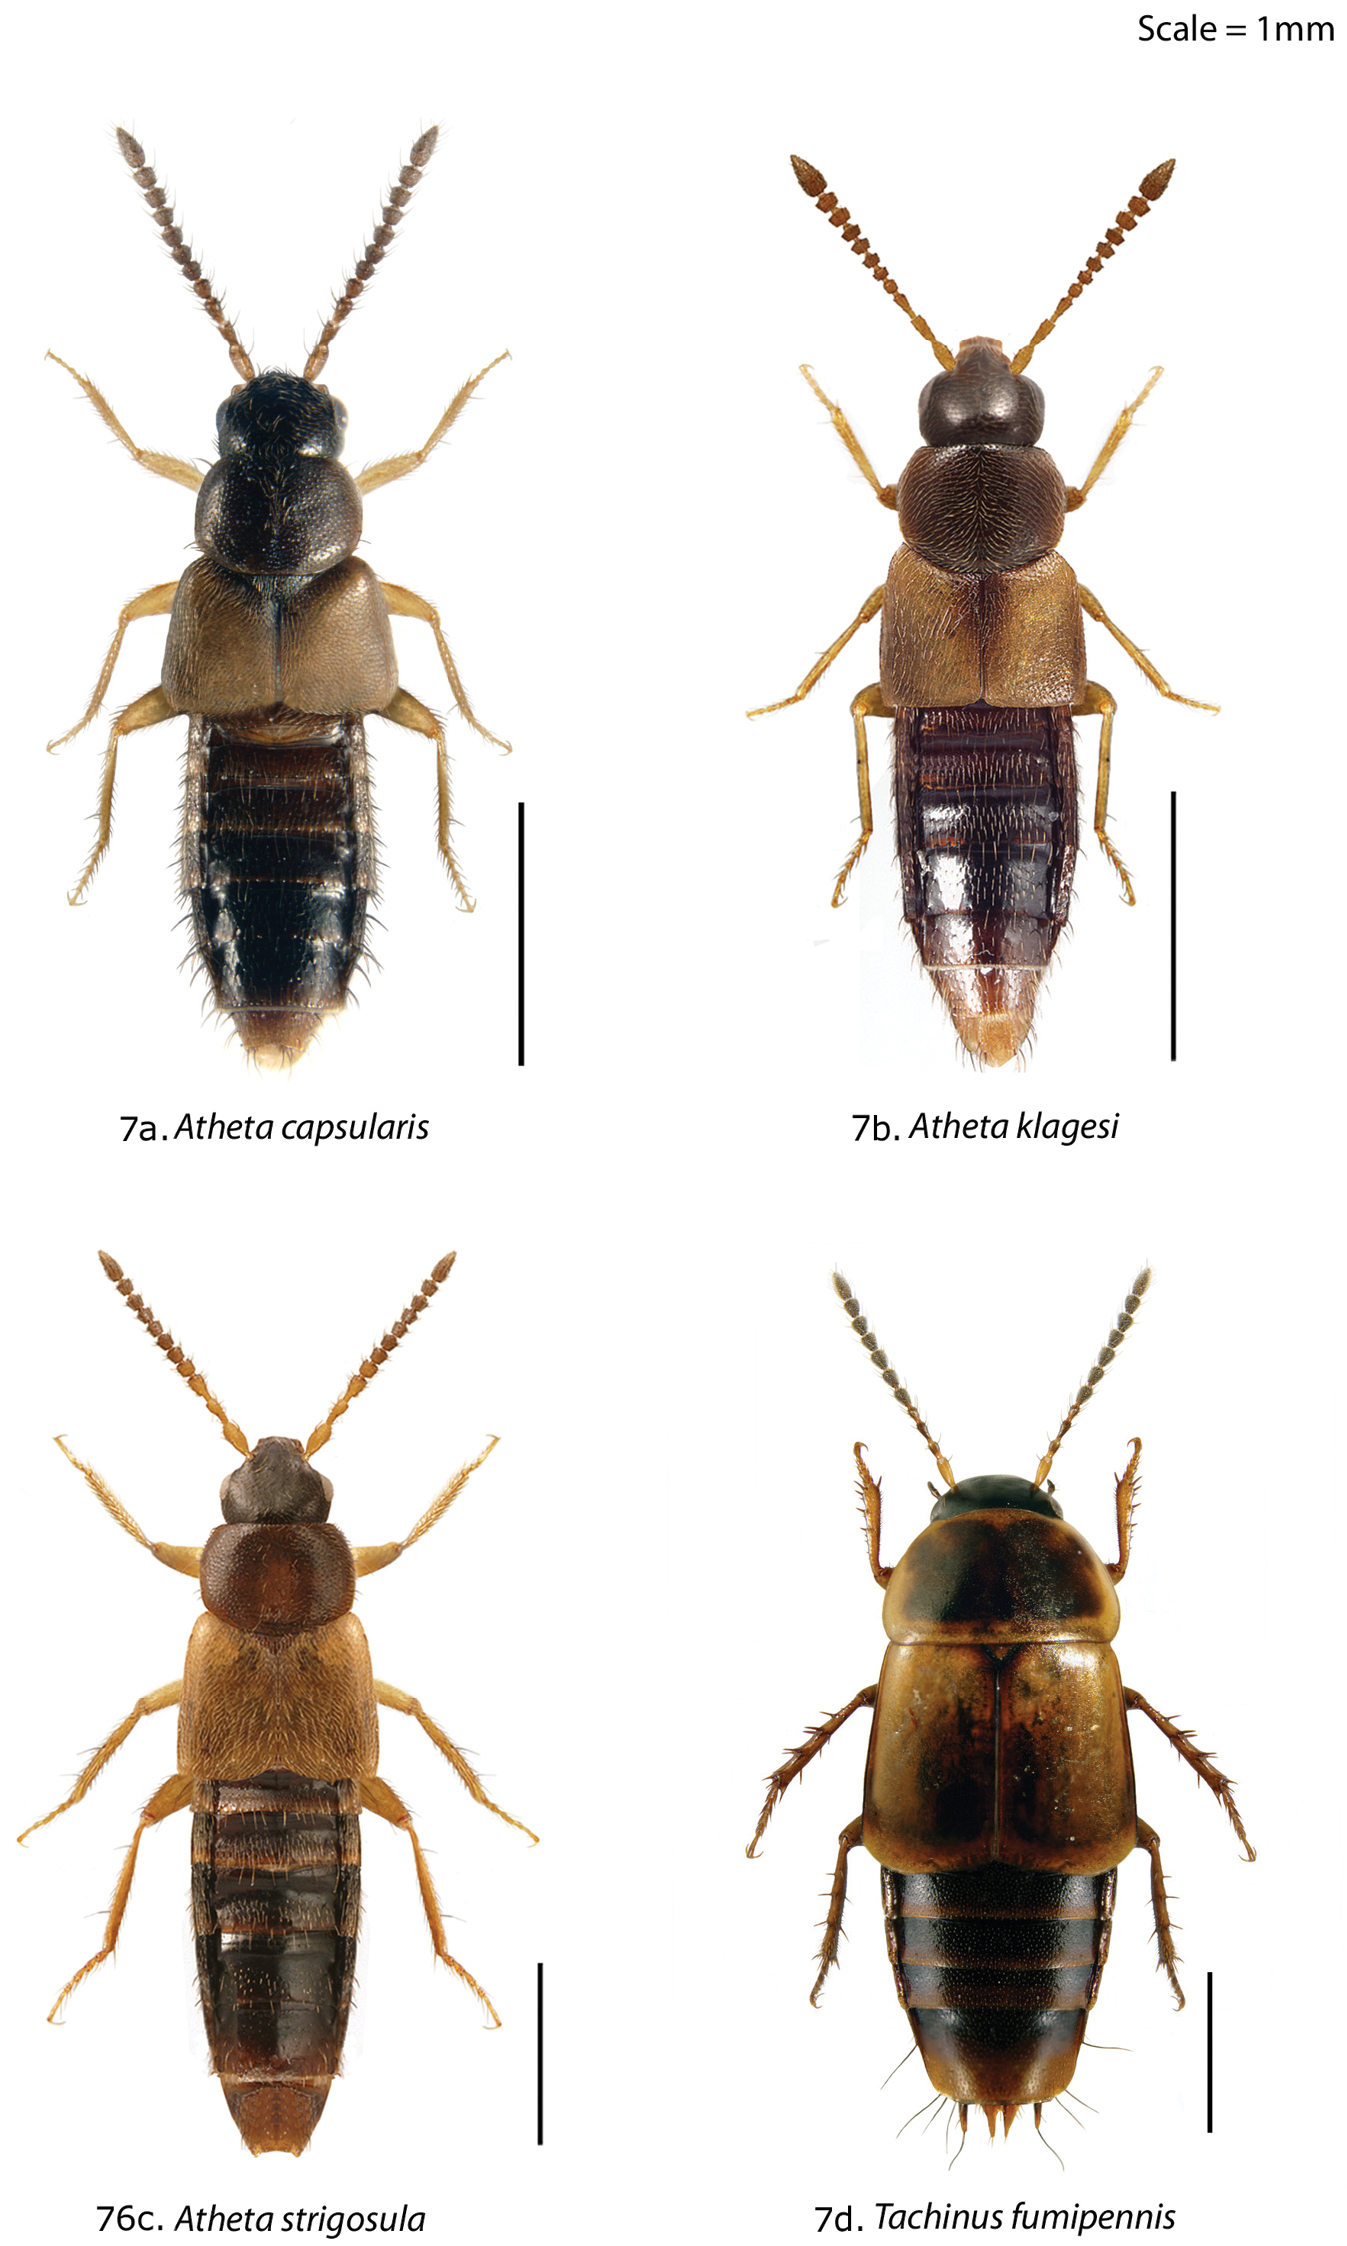
a–d Colour images of abundant species: a Atheta capsularis Klimaszewski b Atheta klagesi Bernhauer c Atheta strigosula Casey d Tachinus fumipennis (Say).
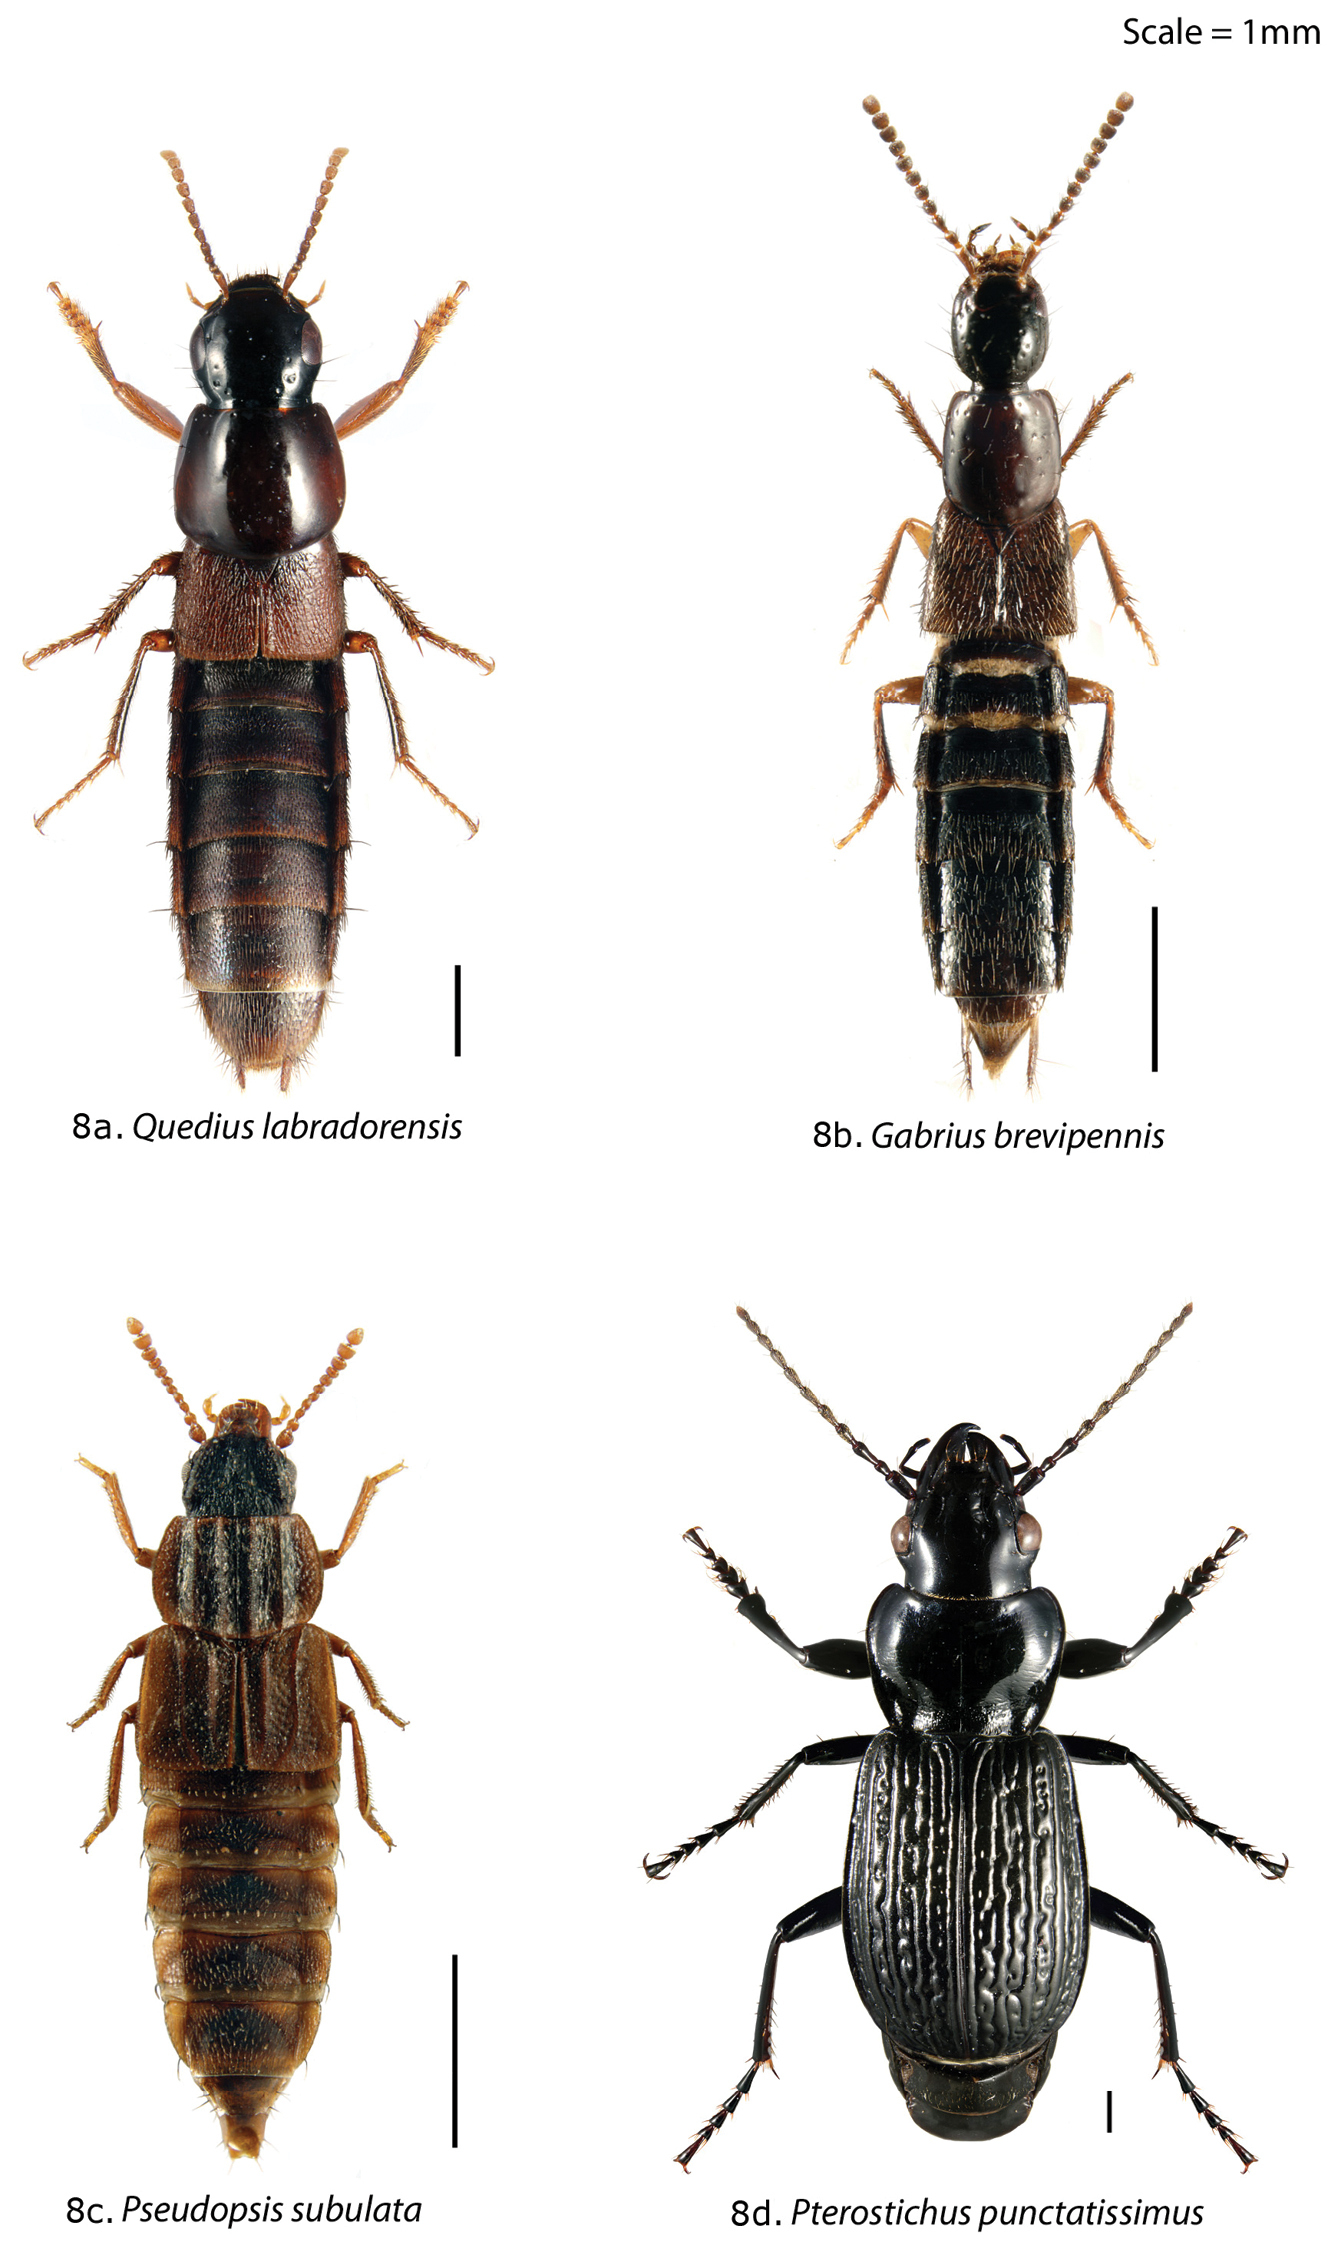
a–d Colour images of abundant species: a Quedius labradorensis Smetana b Gabrius brevipennis (Horn) c Pseudopsis subulata Herman d Pterostichus punctatissimus (Randall).
List of rove beetle species (Staphylinidae) reported from the balsam fir/white birch dominated forests (2011) north of Quebec City, organized by subfamily, tribe, subtribe [when available], and species name. All specimens were captured in unbaited pitfall traps. Uncut forest = control (CO); Clearcut with debris (SOH); Clearcut with reduced debris (WTH); Total catch (Σ); Percentage of total catch (%); relative dominance rank (RDR).
| Taxon | June | July | August | Catch | ||||||||
|---|---|---|---|---|---|---|---|---|---|---|---|---|
| WTH | SOH | CO | WTH | SOH | CO | WTH | SOH | CO | Σ | % | RDR | |
| OMALINAE | 0 | 1 | 0 | 7 | 2 | 2 | 0 | 0 | 0 | 12 | 0.9 | |
| Omaliini | 0 | 1 | 0 | 7 | 2 | 0 | 0 | 0 | 0 | 10 | 0.8 | |
| 1. Omalium rivulare (Paykull) (*) | 0 | 0 | 0 | 0 | 1 | 0 | 0 | 0 | 0 | 1 | 0.1 | 20 |
| 2. Phloeostiba lapponica (Zetterstedt) | 0 | 1 | 0 | 7 | 1 | 0 | 0 | 0 | 0 | 9 | 0.7 | 15 |
| Eusphalerini | 0 | 0 | 0 | 0 | 0 | 1 | 0 | 0 | 0 | 1 | 0.1 | |
| 3. Eusphalerum pothos (Mannerheim) | 0 | 0 | 0 | 0 | 0 | 1 | 0 | 0 | 0 | 1 | 0.1 | 20 |
| Anthophagini | 0 | 0 | 0 | 0 | 0 | 1 | 0 | 0 | 0 | 1 | 0.1 | |
| 4. Acidota quadrata (Zetterstedt) | 0 | 0 | 0 | 0 | 0 | 1 | 0 | 0 | 0 | 1 | 0.1 | 20 |
| PROTEININAE | 0 | 0 | 0 | 1 | 1 | 1 | 1 | 0 | 3 | 7 | 0.5 | |
| Proteinini | 0 | 0 | 0 | 1 | 1 | 1 | 1 | 0 | 3 | 7 | 0.5 | |
| 5. Megarthrus sp. | 0 | 0 | 0 | 0 | 0 | 1 | 0 | 0 | 0 | 1 | 0.1 | 20 |
| 6. Proteinus sp. | 0 | 0 | 0 | 1 | 1 | 0 | 1 | 0 | 3 | 6 | 0.5 | 16 |
| TACHYPORINAE | 6 | 5 | 17 | 13 | 4 | 42 | 2 | 8 | 87 | 184 | 14.4 | |
| Tachyporini | 5 | 2 | 16 | 9 | 3 | 39 | 2 | 6 | 78 | 160 | 12.5 | |
| 7. Tachinus fumipennis (Say) | 0 | 0 | 11 | 2 | 0 | 16 | 0 | 1 | 17 | 47 | 3, 7 | 7 |
| 8. Tachinus frigidus Erichson | 0 | 0 | 5 | 2 | 0 | 20 | 1 | 2 | 46 | 76 | 6, 0 | 3 |
| 9. Tachinus luridus Erichson | 0 | 1 | 0 | 0 | 0 | 0 | 0 | 0 | 1 | 2 | 0.2 | 19 |
| 10. Tachinus quebecensis Robert | 0 | 0 | 0 | 0 | 0 | 0 | 0 | 0 | 11 | 11 | 0.9 | 14 |
| 11. Tachyporus sp. | 0 | 0 | 0 | 1 | 1 | 0 | 0 | 0 | 0 | 2 | 0.2 | 19 |
| 12. Tachyporus nitidulus (Fabricius) | 5 | 1 | 0 | 3 | 2 | 1 | 1 | 2 | 0 | 15 | 1.2 | 13 |
| Mycetoporini | 1 | 3 | 1 | 4 | 1 | 3 | 0 | 2 | 9 | 24 | 1.9 | |
| 13. Lordithon fungicola Campbell | 0 | 1 | 0 | 0 | 0 | 0 | 0 | 0 | 0 | 1 | 0.1 | 20 |
| 14. Mycetoporus consor LeConte | 0 | 1 | 0 | 0 | 0 | 0 | 0 | 1 | 0 | 2 | 0.2 | 19 |
| 15. Mycetoporus americanus Erichson | 1 | 1 | 1 | 4 | 1 | 3 | 0 | 1 | 9 | 21 | 1.6 | 10 |
| Bolitobini | 16 | 6 | 2 | 17 | 18 | 8 | 5 | 4 | 3 | 79 | 6.2 | |
| 16. Ischnosoma fimbriatum Campbell | 13 | 5 | 2 | 16 | 16 | 8 | 4 | 4 | 2 | 70 | 5.5 | 4 |
| 17. Ischnosoma pictum (Horn) | 3 | 1 | 0 | 1 | 2 | 0 | 1 | 0 | 1 | 9 | 0.7 | 15 |
| ALEOCHARINAE | 34 | 13 | 23 | 14 | 6 | 56 | 53 | 46 | 437 | 682 | 53.4 | |
| Aleocharini | 0 | 0 | 0 | 0 | 0 | 0 | 2 | 2 | 0 | 4 | 0.3 | |
| 18. Aleochara (Xenochara) fumata Gravenhorst (*) | 0 | 0 | 0 | 0 | 0 | 0 | 1 | 0 | 0 | 1 | 0.1 | 20 |
| 19. Aleochara (Coprochara) verna Say (*) | 0 | 0 | 0 | 0 | 0 | 0 | 0 | 1 | 0 | 1 | 0.1 | 20 |
| 20. Aleochara sp. n. [undescribed] | 0 | 0 | 0 | 0 | 0 | 0 | 1 | 1 | 0 | 2 | 0.2 | 19 |
| Oxypodini | 7 | 2 | 2 | 2 | 3 | 3 | 1 | 2 | 19 | 41 | 3.2 | |
| 21. Oxypoda frigida Bernhauer | 0 | 0 | 0 | 1 | 1 | 0 | 0 | 0 | 1 | 3 | 0.2 | 18 |
| 22. Oxypoda grandipennis (Casey) | 0 | 0 | 0 | 0 | 0 | 0 | 0 | 1 | 18 | 19 | 1.5 | 12 |
| 23. Oxypoda lacustris Casey | 0 | 0 | 1 | 0 | 0 | 2 | 0 | 0 | 0 | 3 | 0.2 | 18 |
| 24. Oxypoda operta Sjöberg | 1 | 0 | 0 | 0 | 0 | 0 | 0 | 0 | 0 | 1 | 0.1 | 20 |
| 25. Oxypoda pseudolacustris Klimaszewski | 6 | 2 | 1 | 1 | 2 | 1 | 1 | 1 | 0 | 15 | 1.2 | 13 |
| Homalotini | 1 | 0 | 0 | 0 | 0 | 0 | 0 | 0 | 0 | 1 | 0.1 | |
| 26. Leptusa opaca Casey | 1 | 0 | 0 | 0 | 0 | 0 | 0 | 0 | 0 | 1 | 0.1 | 20 |
| Placusini | 0 | 0 | 0 | 0 | 0 | 2 | 0 | 0 | 0 | 2 | 0.2 | |
| 27. Placusa incompleta Sjöberg | 0 | 0 | 0 | 0 | 0 | 2 | 0 | 0 | 0 | 2 | 0.2 | 19 |
| Athetini | 26 | 11 | 21 | 12 | 3 | 51 | 50 | 42 | 417 | 633 | 49.5 | |
| 28. Atheta capsularis Klimaszewski | 0 | 0 | 0 | 3 | 0 | 13 | 37 | 31 | 321 | 405 | 31.7 | 1 |
| 29. Atheta klagesi Bernhauer | 0 | 0 | 9 | 0 | 2 | 28 | 4 | 5 | 15 | 63 | 4.9 | 6 |
| 30. Atheta regisalmonis (Lohse) | 0 | 0 | 0 | 0 | 0 | 0 | 0 | 0 | 1 | 1 | 0.1 | 20 |
| 31. Atheta remulsa Casey | 0 | 0 | 0 | 0 | 0 | 0 | 0 | 1 | 1 | 2 | 0.2 | 19 |
| 32. Atheta strigosula Casey | 0 | 0 | 0 | 0 | 0 | 2 | 1 | 0 | 64 | 67 | 5.2 | 5 |
| 33. Atheta terranovae Klimaszewski & Langor | 0 | 0 | 0 | 0 | 0 | 0 | 0 | 0 | 3 | 3 | 0.2 | 18 |
| 34. Atheta ventricosa Bernhauer | 0 | 0 | 11 | 0 | 1 | 3 | 2 | 1 | 1 | 19 | 1.5 | 12 |
| 35. Atheta sp. | 1 | 0 | 0 | 0 | 0 | 0 | 0 | 0 | 1 | 2 | 0.2 | 19 |
| 36. Atheta (Microdota) sp.1 | 1 | 0 | 0 | 0 | 0 | 0 | 0 | 0 | 1 | 2 | 0.2 | 19 |
| 37. Liogluta aloconotoides Lohse | 0 | 0 | 0 | 7 | 0 | 5 | 2 | 0 | 6 | 20 | 1.6 | 11 |
| 38. Lypoglossa franclemonti Hoebeke (*) | 22 | 10 | 1 | 2 | 0 | 0 | 3 | 2 | 0 | 40 | 3.1 | 8 |
| 39. Mocyta fungi (Gravenhorst) | 0 | 1 | 0 | 0 | 0 | 0 | 0 | 0 | 0 | 1 | 0.1 | 20 |
| 40. Mocyta breviuscula (Mäklin) | 0 | 0 | 0 | 0 | 0 | 0 | 0 | 0 | 3 | 3 | 0.2 | 18 |
| 41. Seeviersiella globicollis (Bernhauer) | 2 | 0 | 0 | 0 | 0 | 0 | 1 | 2 | 0 | 5 | 0.4 | 17 |
| Geostibini | 0 | 0 | 0 | 0 | 0 | 0 | 0 | 0 | 1 | 1 | 0.1 | |
| 42. Zyras obliquus (Casey) | 0 | 0 | 0 | 0 | 0 | 0 | 0 | 0 | 1 | 1 | 0.1 | 20 |
| STENINAE | 1 | 0 | 0 | 1 | 0 | 0 | 0 | 0 | 0 | 2 | 0.2 | |
| 43. Stenus austini Casey | 1 | 0 | 0 | 1 | 0 | 0 | 0 | 0 | 0 | 2 | 0.2 | 19 |
| PSEUDOPSINAE | 10 | 6 | 11 | 40 | 16 | 11 | 59 | 10 | 18 | 181 | 14.2 | |
| 44. Pseudopsis subulata Herman | 10 | 6 | 11 | 40 | 16 | 11 | 59 | 10 | 18 | 181 | 14.2 | 2 |
| PAEDERINAE | 1 | 2 | 0 | 0 | 0 | 0 | 0 | 0 | 0 | 3 | 0.2 | |
| Paederini | 1 | 2 | 0 | 0 | 0 | 0 | 0 | 0 | 0 | 3 | 0.2 | |
| 45. Lathrobium washingtoni Casey | 1 | 2 | 0 | 0 | 0 | 0 | 0 | 0 | 0 | 3 | 0.2 | 18 |
| STAPHYLININAE | 34 | 28 | 5 | 21 | 10 | 12 | 12 | 1 | 5 | 128 | 10 | |
| Xantholinini | 2 | 10 | 2 | 8 | 7 | 1 | 0 | 0 | 0 | 30 | 2.3 | |
| 46. Atrecus macrocephalus (Nordman) | 2 | 10 | 2 | 8 | 7 | 1 | 0 | 0 | 0 | 30 | 2.3 | 9 |
| Staphylinini | 32 | 18 | 3 | 13 | 3 | 11 | 12 | 1 | 5 | 98 | 7.7 | |
| Quediina | 11 | 3 | 1 | 8 | 1 | 10 | 8 | 0 | 5 | 47 | 3.7 | |
| 47. Quedius densiventris (Casey) | 4 | 1 | 0 | 4 | 0 | 2 | 6 | 0 | 3 | 20 | 1.6 | 11 |
| 48. Quedius (Raphirus) fulvicollis (Stephens) | 2 | 0 | 0 | 1 | 0 | 1 | 1 | 0 | 0 | 5 | 0.4 | 17 |
| 49.Quedius (Quedius) labradorensis Smetana | 5 | 1 | 1 | 3 | 1 | 7 | 1 | 0 | 2 | 21 | 1.6 | 10 |
| 50.Quedius (Quedius) plagiatus Mannerheim | 0 | 1 | 0 | 0 | 0 | 0 | 0 | 0 | 0 | 1 | 0.1 | 20 |
| Philonthina | 21 | 15 | 2 | 5 | 2 | 1 | 4 | 1 | 0 | 51 | 4 | |
| 51. Bisnius cephalicus (Casey) | 1 | 1 | 0 | 0 | 0 | 1 | 0 | 0 | 0 | 3 | 0.2 | 18 |
| 52. Gabrius brevipennis (Horn) | 20 | 14 | 2 | 5 | 1 | 0 | 4 | 1 | 0 | 47 | 3.7 | 7 |
| 53. Gabrius sp. | 0 | 0 | 0 | 0 | 1 | 0 | 0 | 0 | 0 | 1 | 0.1 | 20 |
List of ground beetle species (Carabidae) reported from the balsam fir/white birch dominated forests (2011) north of Quebec City, organized by subfamily, tribe, subtribe [when available], and species name. All specimens were captured in unbaited pitfall traps. Uncut forest = control (CO); Clearcut with debris (SOH); Clearcut with reduced debris (WTH); Total catch (Σ); Percentage of total catch (%); relative dominance rank (RDR); abundantly captured species in bold.
| Taxon | June | July | August | Catch | ||||||||
| WTH | SOH | CO | WTH | SOH | CO | WTH | SOH | CO | Σ | % | RDR | |
| CARABINAE | 0 | 0 | 0 | 0 | 0 | 0 | 0 | 1 | 1 | 2 | 0.5 | |
| Cychrini | 0 | 0 | 0 | 0 | 0 | 0 | 0 | 1 | 1 | 2 | 0.5 | |
| 1. Sphareoderus nitidicollis (Guérin-Ménenville) | 0 | 0 | 0 | 0 | 0 | 0 | 0 | 1 | 1 | 2 | 0.5 | 10 |
| TRECHINAE | 4 | 5 | 2 | 8 | 6 | 6 | 2 | 0 | 0 | 33 | 8.5 | |
| Trechini | 2 | 2 | 0 | 3 | 4 | 2 | 0 | 0 | 0 | 13 | 3.4 | |
| 2. Trechus apicalis (Motschulsky) | 2 | 1 | 0 | 3 | 4 | 1 | 0 | 0 | 0 | 11 | 2.8 | 6 |
| 3. Trechus crassiscapus (Lindroth) | 0 | 1 | 0 | 0 | 0 | 1 | 0 | 0 | 0 | 2 | 0.5 | 10 |
| Bembidiini | 2 | 3 | 2 | 5 | 2 | 4 | 2 | 0 | 0 | 20 | 5.2 | |
| 4. Bembidion grapii (Gyllenhal) | 1 | 0 | 0 | 0 | 0 | 0 | 1 | 0 | 0 | 2 | 0.5 | 10 |
| 5. Bembidion wingatei (Bland) | 1 | 3 | 2 | 5 | 2 | 4 | 1 | 0 | 0 | 18 | 4.7 | 5 |
| HARPALINAE | 75 | 38 | 69 | 48 | 27 | 44 | 26 | 14 | 11 | 352 | 91 | |
| Pterostichini | 72 | 34 | 57 | 30 | 25 | 36 | 20 | 12 | 7 | 293 | 75.7 | |
| 6. Pterostichus adstrictus (Eschscholtz) | 58 | 27 | 35 | 21 | 12 | 17 | 12 | 8 | 0 | 190 | 49.1 | 1 |
| 7. Pterostichus brevicornis (Kirby) | 0 | 0 | 1 | 0 | 0 | 0 | 1 | 0 | 0 | 2 | 0.5 | 10 |
| 8. Pterostichus coracinus (Newman) | 10 | 4 | 15 | 9 | 12 | 10 | 5 | 3 | 5 | 73 | 18.9 | 2 |
| 9. Pterostichus punctatissimus (Randall) | 4 | 3 | 6 | 0 | 1 | 9 | 2 | 1 | 2 | 28 | 7.2 | 4 |
| Harpalini | 0 | 0 | 0 | 5 | 0 | 0 | 2 | 1 | 0 | 8 | 2.1 | 8 |
| 10. Harpalus laticeps (LeConte) | 0 | 0 | 0 | 0 | 0 | 0 | 0 | 1 | 0 | 1 | 0.3 | 11 |
| 11. Harpalus ruficeps (DeGeer) | 0 | 0 | 0 | 3 | 0 | 0 | 1 | 0 | 0 | 4 | 1 | 8 |
| 12. Harpalus solitaris (Dejean) | 0 | 0 | 0 | 2 | 0 | 0 | 1 | 0 | 0 | 3 | 0.8 | 9 |
| Platynini | 3 | 4 | 12 | 13 | 2 | 8 | 4 | 1 | 4 | 51 | 13.2 | |
| 13. Agonum gratiosum (Mannerheim) | 0 | 0 | 1 | 0 | 0 | 0 | 0 | 0 | 0 | 1 | 0.3 | 11 |
| 14. Agonum retractum (LeConte) | 0 | 0 | 2 | 0 | 0 | 1 | 0 | 0 | 0 | 3 | 0.8 | 9 |
| 15. Calathus adrena (LeConte) | 0 | 0 | 1 | 0 | 1 | 0 | 0 | 0 | 0 | 2 | 0.5 | 10 |
| 16. Calathus ingrathus (Dejean) | 2 | 2 | 3 | 13 | 1 | 5 | 4 | 1 | 4 | 35 | 9 | 3 |
| 17. Platynus decentris (Say) | 1 | 2 | 5 | 0 | 0 | 2 | 0 | 0 | 0 | 10 | 2.6 | 7 |