ZooKeys 367: 65–84, doi: 10.3897/zookeys.367.6185
CLIMBER: Climatic niche characteristics of the butterflies in Europe
Oliver Schweiger 1, Alexander Harpke 1, Martin Wiemers 1, Josef Settele 1,2
1 Helmholtz Centre for Environmental Research – UFZ, Department of Community Ecology, Theodor-Lieser-Strasse 4, 06120 Halle, Germany
2 iDiv, German Centre for Integrative Biodiversity Research (iDiv) Halle-Jena-Leipzig, Deutscher Platz 5e, 04103 Leipzig, Germany

Corresponding author: Oliver Schweiger (oliver.schweiger@ufz.de)

Academic editor: V. Chavan

received 2 September 2013 | accepted 28 November 2013 | Published 6 January 2014


(C) 2014 Oliver Schweiger. This is an open access article distributed under the terms of the Creative Commons Attribution License (CC BY 4.0), which permits unrestricted use, distribution, and reproduction in any medium, provided the original author and source are credited.


For reference, use of the paginated PDF or printed version of this article is recommended.

Citation: Schweiger O, Harpke A, Wiemers M, Settele J (2014) CLIMBER: Climatic niche characteristics of the butterflies in Europe. ZooKeys 367: 65–84. doi: 10.3897/zookeys.367.6185 Resource ID: GBIF key: http://www.gbif.org/dataset/e2bcea8c-dfea-475e-a4ae-af282b4ea1c5

Resource Citation: Helmholtz Centre for Environmental Research - UFZ (2013). CLIMBER: Climatic niche characteristics of the butterflies in Europe. 397 records, Online at http://ipt.pensoft.net/ipt/resource.do?r=climber, version 1.3 (released on 3/12/2013), Resource ID: GBIF key: http://www.gbif.org/dataset/e2bcea8c-dfea-475e-a4ae-af282b4ea1c5, Data Paper ID: doi: 10.3897/zookeys.367.6185

Abstract

Detailed information on species’ ecological niche characteristics that can be related to declines and extinctions is indispensable for a better understanding of the relationship between the occurrence and performance of wild species and their environment and, moreover, for an improved assessment of the impacts of global change. Knowledge on species characteristics such as habitat requirements is already available in the ecological literature for butterflies, but information about their climatic requirements is still lacking. Here we present a unique dataset on the climatic niche characteristics of 397 European butterflies representing 91% of the European species (see Appendix). These characteristics were obtained by combining detailed information on butterfly distributions in Europe (which also led to the ‘Distribution Atlas of Butterflies in Europe’) and the corresponding climatic conditions. The presented dataset comprises information for the position and breadth of the following climatic niche characteristics: mean annual temperature, range in annual temperature, growing degree days, annual precipitation sum, range in annual precipitation and soil water content. The climatic niche position is indicated by the median and mean value for each climate variable across a species’ range, accompanied by the 95% confidence interval for the mean and the number of grid cells used for calculations. Climatic niche breadth is indicated by the standard deviation and the minimum and maximum values for each climatic variable across a species’ range. Database compilation was based on high quality standards and the data are ready to use for a broad range of applications.

It is already evident that the information provided in this dataset is of great relevance for basic and applied ecology. Based on the species temperature index (STI, i.e. the mean temperature value per species), the community temperature index (CTI, i.e. the average STI value across the species in a community) was recently adopted as an indicator of climate change impact on biodiversity by the pan-European framework supporting the Convention on Biological Diversity (Streamlining European Biodiversity Indicators 2010) and has already been used in several scientific publications. The application potential of this database ranges from theoretical aspects such as assessments of past niche evolution or analyses of trait interdependencies to the very applied aspects of measuring, monitoring and projecting historical, ongoing and potential future responses to climate change using butterflies as an indicator.

Keywords

Climate change, climate warming, CTI, global change, global warming, modelling, risk, trend, STI, Europe, butterflies, Lepidoptera, Papilionidae, Pieridae, Lycaenidae, Riodinidae, Nymphalidae, Hesperiidae

Introduction

Global change seriously threatens biodiversity at all organisational levels ranging from genetic diversity, performance and occurrence of single species, taxonomic, phylogenetic and functional diversity of communities and species assemblages to properties of whole ecosystems including the provision of ecosystem services for human well-being (Lavergne et al. 2010; Parmesan 2006; Potts et al. 2010; Schröter et al. 2005). But species are not equally at risk when facing global change (e.g. Settele et al. 2008). In the context of climate change, several species-specific ecological characteristics have been identified to determine vulnerability, including diets, habitat requirements, ecological specialisation and plasticity and the ecological characteristics of interacting species (Heikkinen et al. 2010; Pöyry et al. 2009; Schweiger et al. 2012; Visser 2008; Warren et al. 2001). Thus, good knowledge of the ecological characteristics relevant for the reaction of species and communities to particular drivers of global change is needed, which can then be utilised as powerful indicators for conservation planning and action.

One of the most important ecological characteristics to assess how species react to climate change obviously is the climatic niche. While knowledge on particular species characteristics such as habitat requirements is already available for some species groups, crucial publicly available information about climatic requirements is still lacking for the majority of the species. Here we present a unique dataset on climatic niche characteristics of 397 (91%) butterfly species in Europe, which have been shown to be particularly sensitive to changing climates (Hill et al. 2002; Settele et al. 2008; Warren et al. 2001). Based on projections of future suitable climatic conditions, Settele et al. (2008) showed that under the assumption of unlimited dispersal 7% of the European butterflies are at an extremely high or very high risk (i.e. a loss of more than 95% and 85%, respectively of their current range size until 2080), 6% are at high risk (>70% loss) and 18% are at risk (>50% loss; Fig. 1). However, the more realistic assumption of no dispersal (in the given amount of time) projected 33% of the butterflies to be at an extremely high or very high risk, 26% to be at high risk and 19% to be at risk (Fig. 1).

Figure 1.

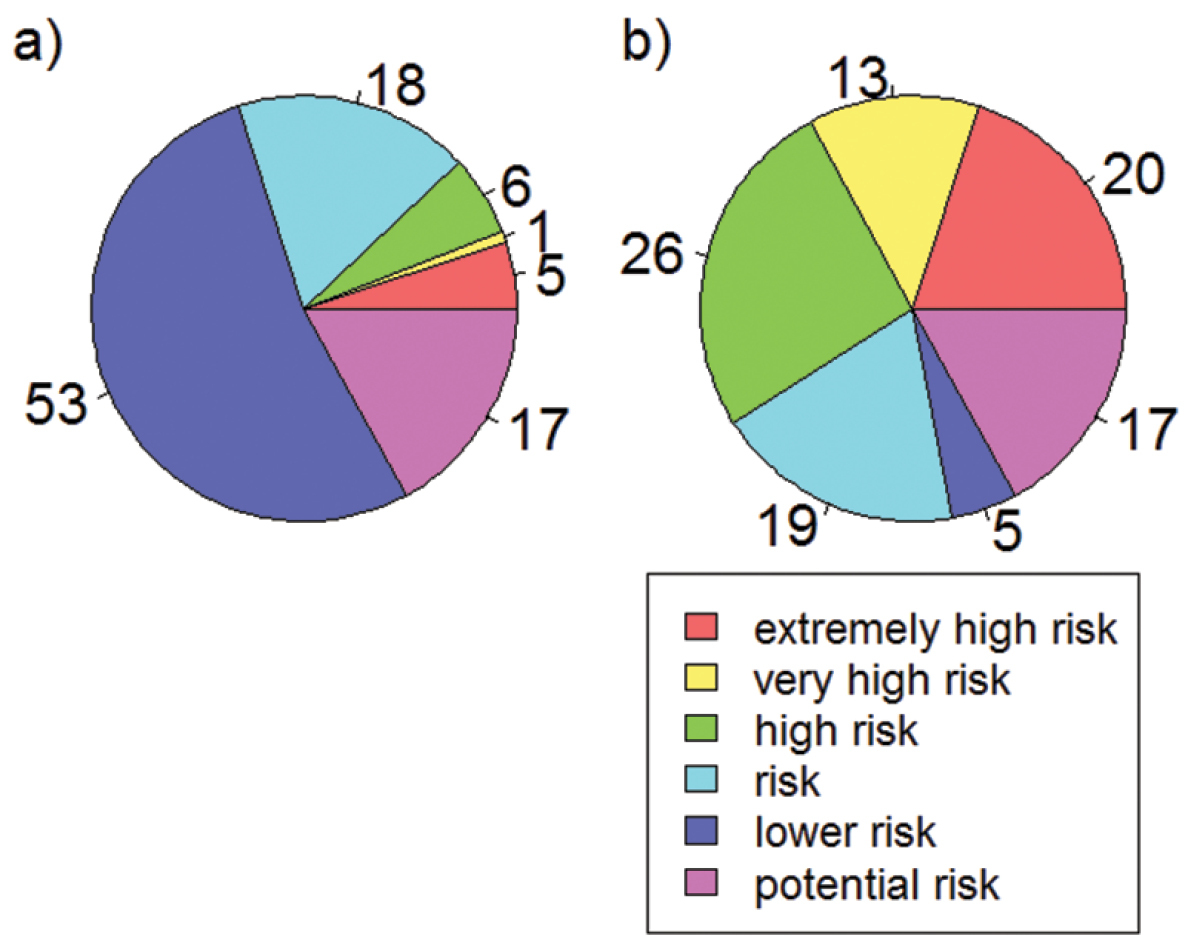
Proportion of species (%) with different climatic risk status after Settele at al. (2008) assuming full dispersal (a) and no dispersal capacity (b).

Based on detailed data on the distribution of European butterflies, which also led to the ‘Distribution Atlas of European Butterflies’ (Kudrna 2002), the ‘Climatic Risk Atlas of European Butterflies (Settele et al. 2008) and the ‘Distribution Atlas of Butterflies in Europe’ (Kudrna et al. 2011), we extracted measures of climatic conditions (indicating niche breadth and position) within the distributional range of each species. As a consequence of this approach, users of this dataset should be aware that the provided measures refer to the realised climatic niche and not to the fundamental niche (sensu Hutchinson 1957; but see discussion in Araújo and Guisan 2006). The extracted measures reflect two primary properties of climate, energy and water, which are known to affect butterfly species performance and distributions as a consequence of physiological limitations (Buckley et al. 2011; Roy et al. 2001). Most of these measures are quite independent from each other and cover different aspects of the climatic niche (Fig. 2).

Figure 2.

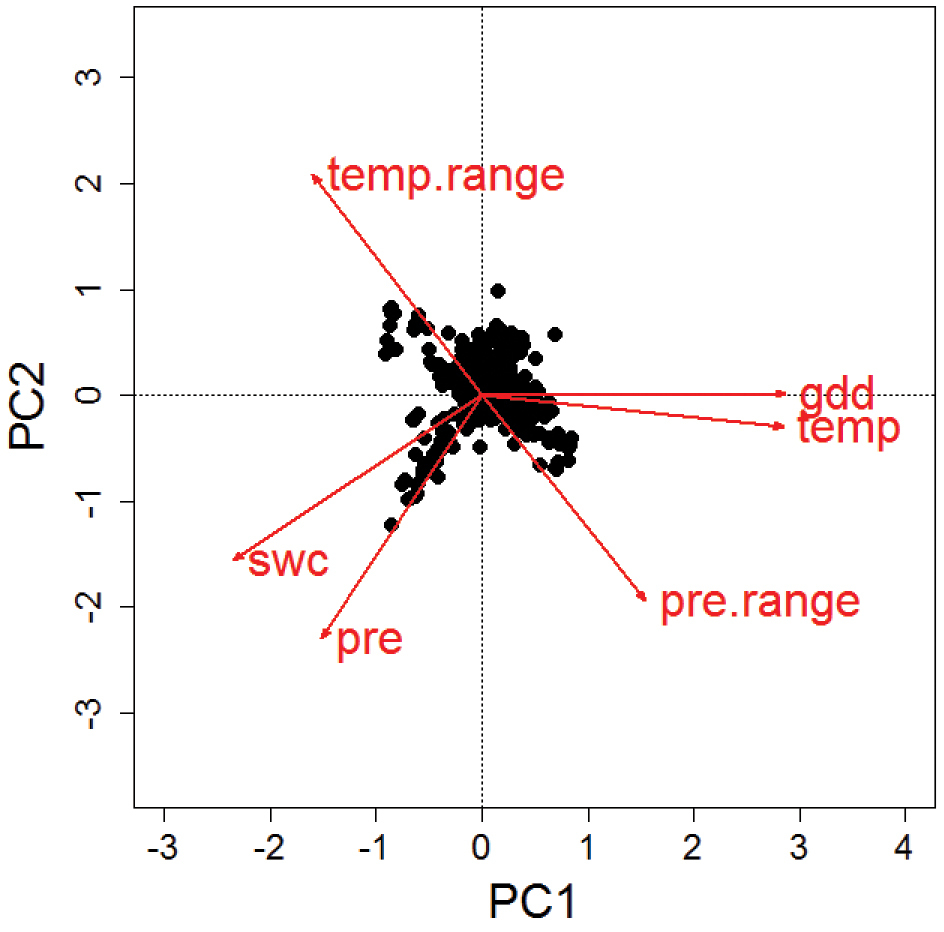
Results from a principal component analysis of the species-specific mean values of six different climate variables. Mean values per species have been calculated based on the observed records per 50 km × 50 km CGRS grid cell across a species’ European distribution. PC1 explained 58% and PC2 32% of the variability. Niche characteristics according to annual temperature (temp) and growing degree days until August (gdd) are highly correlated. Also, the two measures of water availability, annual precipitation (pre) and soil water content (swc) show some similarity, while the indicators of annual range in precipitation (pre.range) and temperature (temp.range) are negatively correlated. In spite of these similarities, aspects of energy, water and their annual variability can be assessed independently with a choice of at least three of the indicators.

By combining a comprehensive database on the distribution of European butterflies with publicly available climatic data in combination with a constantly high level of quality control at crucial steps of the data generation, CLIMBER represents a unique and ready-to-use dataset for a broad variety of potential applications. Analysis of phylogenetic signals in the climatic niche characteristics, for instance, can be used to assess past niche evolution which can lead to projections of potential future risks in the face of rapid climate change (for a comparable analysis for birds see Lavergne et al. 2013). Also, analyses relating climatic niche properties to other species traits can be helpful to assess interdependencies of different ecological characteristics, as has been done recently for birds and their temperature and habitat preferences (Barnagaud et al. 2012). So far the most powerful application of climatic niche characteristics provided in this dataset comes from the ‘species temperature index’ (STI). The STI is simply the mean temperature value per species across its range. Based on the STI, the ‘community temperature index’ (CTI) has been suggested as a powerful and robust tool to measure the response of local communities to temperature change (Devictor et al. 2008; Devictor et al. 2012a; Devictor et al. 2012b). The CTI is calculated as the average STI value across the species or specimens in a community and has been used to analyse the temporal response to climate warming of local bird and butterfly communities across Europe. One striking result of this study was the detection of time lag effects in the community response to climate warming and that these lag effects differed between the two species groups (Devictor et al. 2012a).

STI values for European butterflies can be of great value for governmental and non-governmental conservation organisations (Van Swaay et al. 2010; Van Swaay et al. 2008). Based on the STI, the CTI was recently adopted as an indicator of climate change impact on biodiversity by the pan-European framework supporting the Convention on Biological Diversity (Streamlining European Biodiversity Indicators 2010; http://ec.europa.eu/environment/nature/knowledge/eu2010_indicators). Thus, STI and corresponding CTI values can perfectly complement and enrich the analysis of all kind of butterfly monitoring schemes. To address the fact that temperature is not the only changing climatic factor or aspect of the climatic niche, we think that the additionally provided climatic niche characteristics concerning water availability and annual climatic variability can help to enrich the landscape of target-specific analyses and indicators (Fig. 2). By providing public access to this dataset, we hope to contribute to improvements of the scientific understanding of how climate change affects species and communities and to improve monitoring and conservation actions for climate change mitigation.

Metadata

For the description of the metadata we followed the standards suggested by Michener et al. (1997) in a slightly modified way.

Title

CLIMBER: Climatic niche characteristics of the butterflies in Europe

Contributors
Dataset owner

Oliver Schweiger, Alexander Harpke, Martin Wiemers, Josef Settele

Helmholtz Centre for Environmental Research – UFZ, Department of Community Ecology, Theodor-Lieser-Strasse 4, 06120 Halle, Germany

Contact person

Oliver Schweiger

Affiliation: Helmholtz Centre for Environmental Research – UFZ, Department of Community Ecology

Address: Theodor-Lieser-Strasse 4, 06120 Halle, Germany

Phone: +49 345 558 5306

Email: oliver.schweiger@ufz.de

Geographic, temporal and taxonomic coverage
Geographic coverage and spatial resolution

Climatic niche characteristics are provided for all butterfly species occurring within a European window of 11°W, 32°E longitude and 34°N, 72°N latitude (Fig. 3). Resolution of butterfly distribution and corresponding climate data used to calculate climatic niche characteristics corresponds to the 50 km × 50 km Common European Chorological Grid Reference System (CGRS; http://www.eea.europa.eu/data-and-maps/data/common-european-chorological-grid-reference-system-cgrs).

Figure 3.

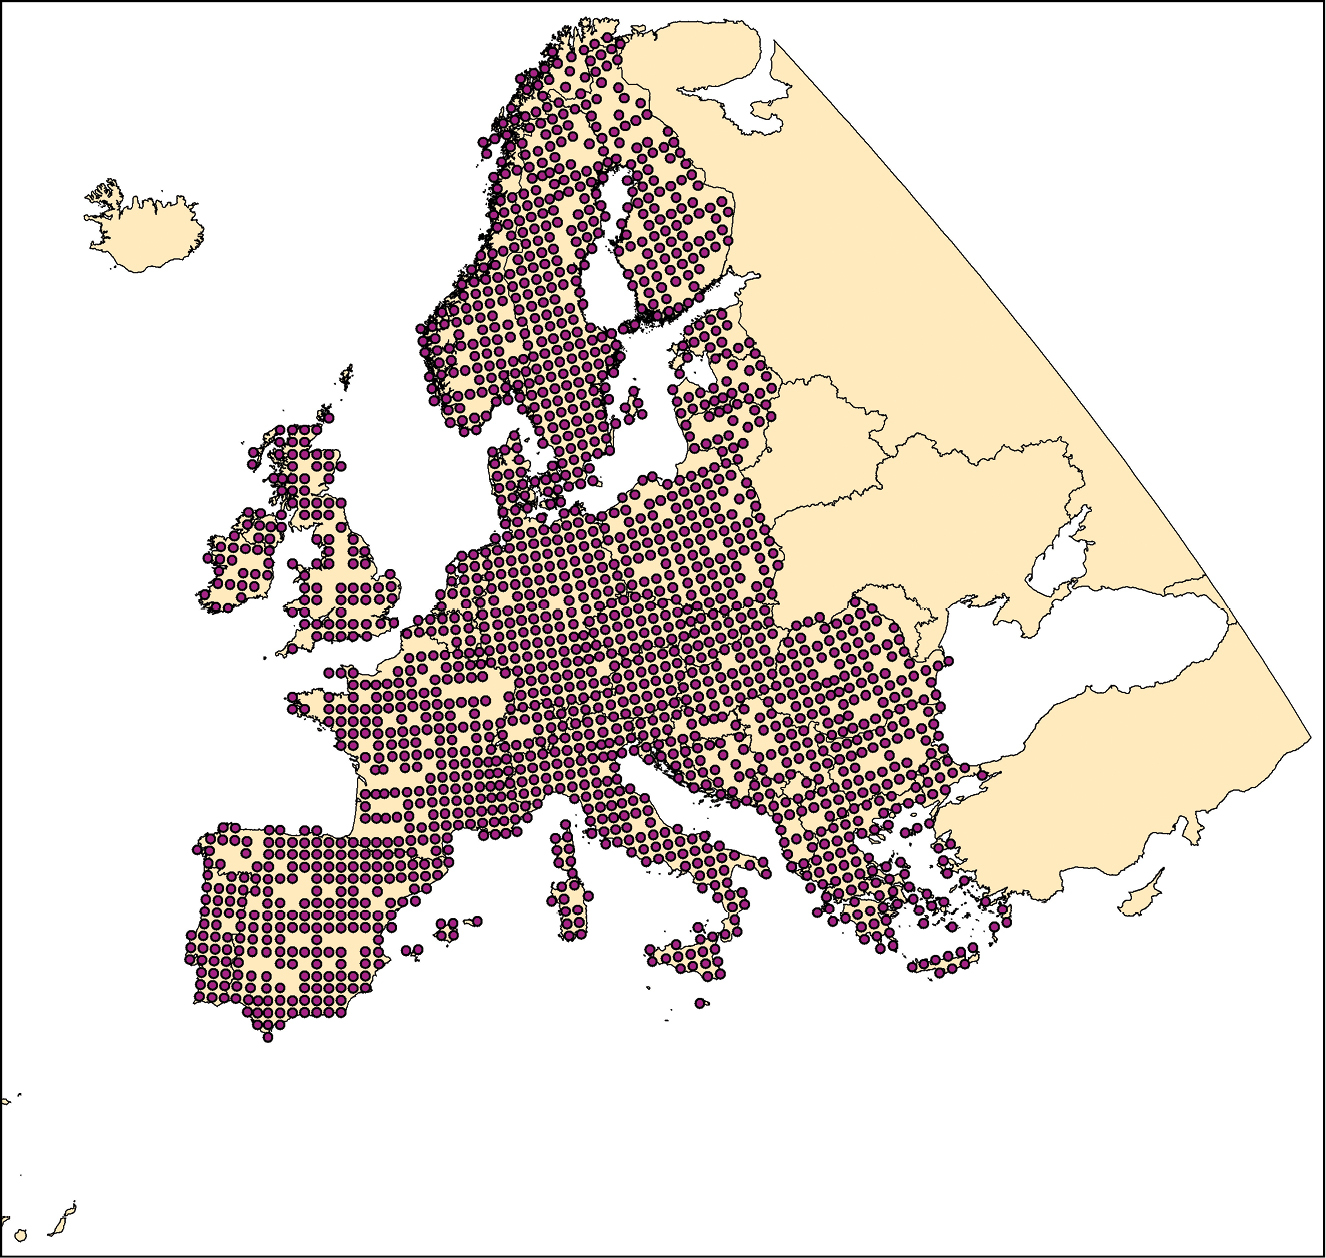
Geographic coverage used for the calculation of the climatic species characteristics. Purple dots indicate 50 km × 50 km CGRS grid cells with available species records.

The geographic window excludes data from the Atlantic islands under European administration (the Azores, Madeira and Canary Islands) as well as Cyprus and Iceland. Due to low levels of recording, data from Belarus, Ukraine, Moldova, and Russia were also excluded. Additionally, no climate data were available for two species with extremely local distributions on the Pontine Islands and the Greek island of Nissiros. These restrictions led to the exclusion of 38 of the European butterfly species listed in Kudrna et al. (2011), but confined to these regions (Table 1).

Table 1.

Species occurring in Europe and listed in Kudrna et al. (2011) but not considered for the assignment of climatic niche characteristics in this database.

Species European range
Azanus ubaldus (Stoll, 1782) Canary Islands
Catopsilia florella (Fabricius, 1775) Canary Islands
Chazara persephone (Hübner, [1805]) Ukraine
Chilades galba (Lederer, 1855) Cyprus
Cigaritis acamas (Klug, 1834) Cyprus
Cyclyrius webbianus (Brulle, 1839) Canary Islands
Euchloe eversi Stamm, 1963 Canary Islands
Euchloe grancanariensis Acosta, 2008 Canary Islands
Euchloe hesperidum Rothschild, 1913 Canary Islands
Glaucopsyche paphos Chapman, 1920 Cyprus
Gonepteryx cleobule (Hübner, 1825) Canary Islands
Gonepteryx eversi Rehnelt, 1974 Canary Islands
Gonepteryx maderensis Felder, 1863 Madeira
Gonepteryx palmae Stamm, 1963 Canary Islands
Hipparchia azorina (Strecker, 1899) Azores
Hipparchia bacchus Higgins, 1967 Canary Islands
Hipparchia cypriensis (Holik, 1949) Cyprus
Hipparchia gomera Higgins, 1967 Canary Islands
Hipparchia maderensis (Bethune-Baker, 1891) Madeira
Hipparchia sbordonii Kudrna, 1984 Pontine Islands
Hipparchia tamadabae Owen & Smith, 1992 Canary Islands
Hipparchia tilosi (Manil, 1984) Canary Islands
Hipparchia wyssii (Christ, 1889) Canary Islands
Hypolimnas misippus (Linnaeus, 1764) Canary Islands
Maniola cypricola (Graves, 1928) Cyprus
Maniola halicarnassus Thomas, 1990 Nissiros Island
Neolycaena rhymnus (Eversmann, 1832) Ukraine
Pararge xiphia (Fabricius, 1775) Madeira
Pararge xiphioides Staudinger, 1871 Canary Islands
Pieris cheiranthi (Hübner, 1808) Canary Islands
Pieris wollastoni Butler, 1866 Madeira
Polyommatus corydonius (Herrich-Schäffer, 1852) Ukraine
Polyommatus damocles (Herrich-Schäffer, 1844) Ukraine
Polyommatus damone (Eversmann, 1841) Ukraine
Pseudochazara euxina (Kusnezov, 1909) Ukraine
Thymelicus christi Rebel, 1894 Canary Islands
Tomares callimachus (Eversmann, 1848) Ukraine
Vanessa vulcania (Godart, 1819) Canary Islands & Madeira
Temporal reference period

Only butterfly distribution data from the period of 1981 to 2000 were considered due to low sampling intensity in earlier periods (Fig. 4) and to minimize errors due to ongoing range shifts as a response to recent climate change.

Figure 4.

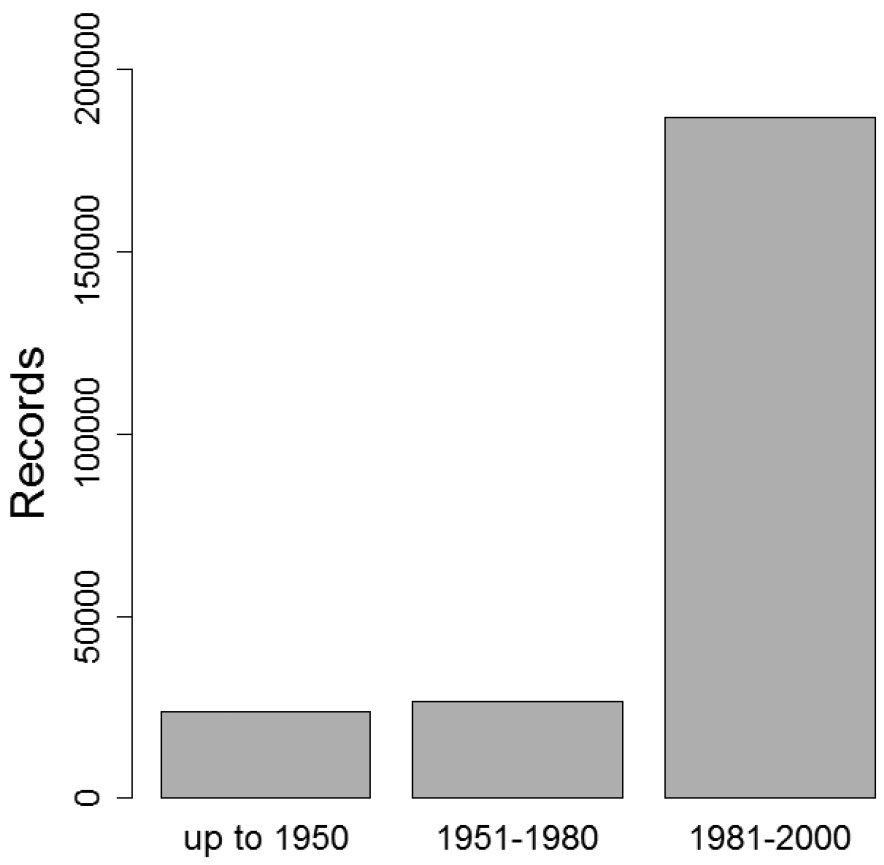
Temporal availability of records and corresponding sampling intensity. Only the period of 1981–2000 has been considered in CLIMBER.

Taxonomy
Taxonomic ranks

Phylum: Arthropoda

Subphylum: Hexapoda

Class: Insecta

Order: Lepidoptera

Superfamily: Papilionoidea (sensu Regier et al. 2013; Wahlberg et al. 2013)

Families: Hesperiidae, Lycaenidae, Nymphalidae, Papilionidae, Pieridae, Riodinidae

Common name: butterflies

Taxonomic coverage

The taxonomic coverage spans all butterfly species within the selected geographic window (397 species) and represents 91% of all European species (Fig. 5). Thirty-eight species from less well sampled Eastern European countries, Atlantic and small Mediterranean islands have not been considered (Fig. 5a). The taxonomy of European butterfly species follows Kudrna et al. (2011). Erroneous use of brackets around authors’ names was corrected in 15 cases (cf. Tshikolovets 2011; Table 2).

Figure 5.

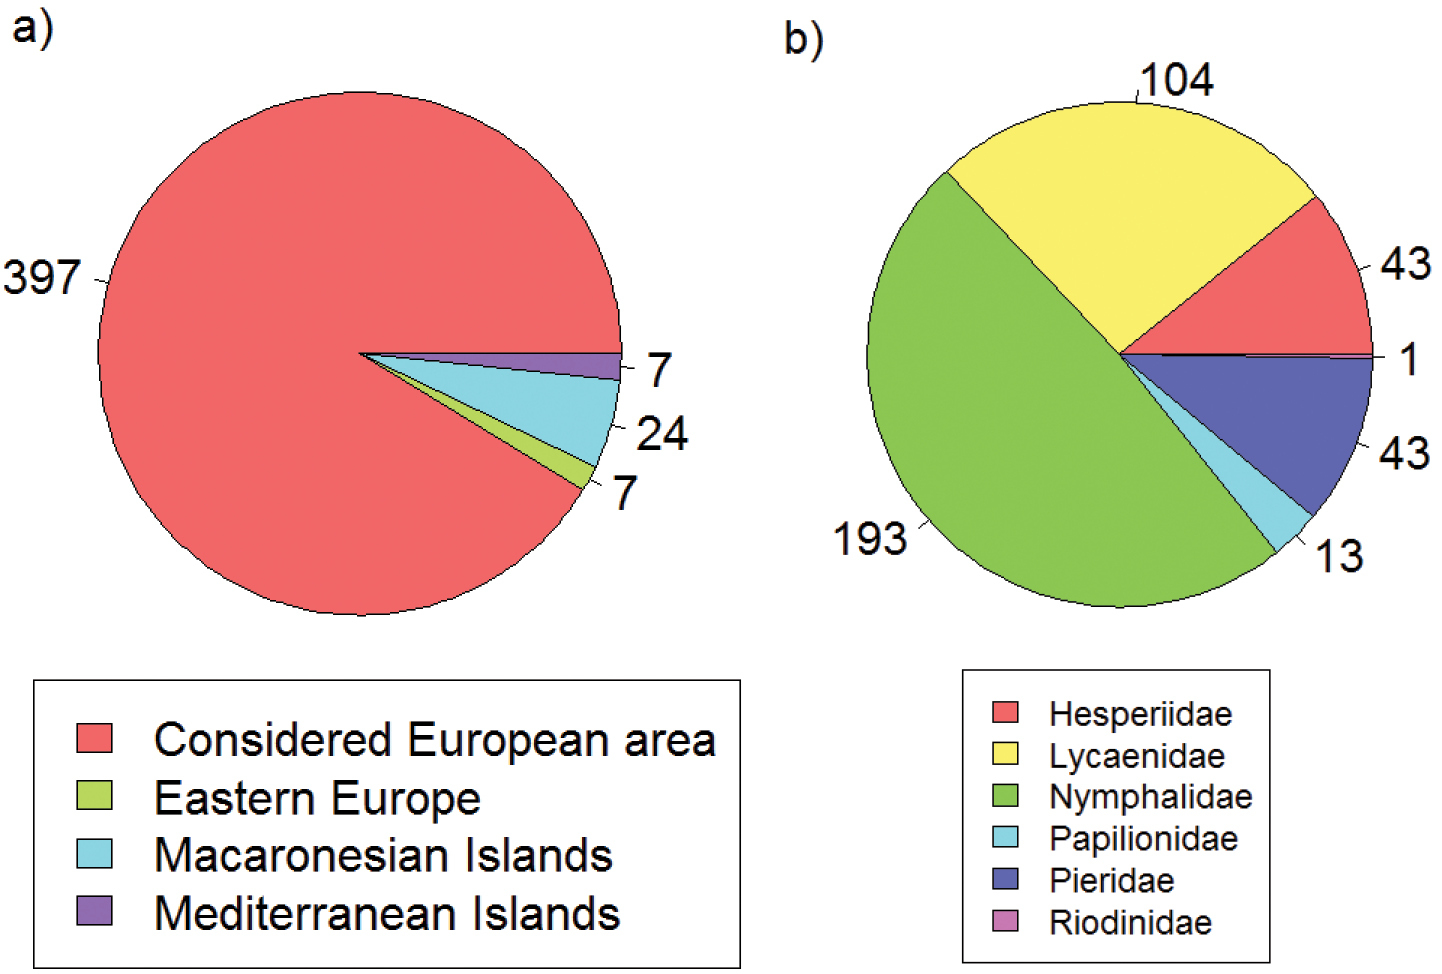
Taxonomic coverage according to the entire European butterfly fauna (a) and families (b). Values indicate number of species.

Table 2.

Corrected species names (cf. Tshikolovets 2011) in comparison toKudrna et al. (2011).

Corrected species names
Anthocharis damone Boisduval, 1836
Apatura metis Freyer, 1829
Argynnis elisa Godart, 1823
Aricia morronensis Ribbe, 1910
Cacyreus marshalli Butler, 1898
Colias aurorina Herrich-Schäffer, 1850
Erebia ottomana Herrich-Schäffer, 1847
Maniola chia Thomson, 1987
Maniola halicarnassus Thomson, 1990
Melitaea asteria Freyer, 1828
Melitaea varia Meyer-Dür, 1851
Pararge xiphioides Staudinger, 1871
Plebejus trappi (Verity, 1927)
Pseudochazara amymone Brown, 1976
Pseudochazara orestes Prins & Poorten, 1981

Aricia artaxerxes (Fabricius, 1793) and Aricia montensis Verity, 1928 are treated in CLIMBER as distinct species with parapatric distributions (see Sanudo-Restrepo et al. 2013). The latter species is confined to the Iberian Peninsula and North Africa.

For the local Macedonian endemic Pseudochazara amymone Brown, 1976 no data were available for the considered time period. After its first discovery in Greece in 1975, the species was not reliably recorded again until its recent rediscovery in Southern Albania (Eckweiler 2012). According to Eckweiler (2012), Pseudochazara amymone should be considered a subspecies of Pseudochazara mamurra (Herrich-Schäffer, [1846]), which is widespread in the Middle East.

The following species in our database actually comprise records of more than one species, most of which were recognized only recently, and are difficult or impossible to distinguish without genitalia examination or molecular methods.

Carcharodus alceae (Esper, 1780) probably contains data of the sibling species Carcharodus tripolinus (Verity, 1925) from the Southern Iberian Peninsula, differing only in genitalia characters.

Leptidea sinapis (Linnaeus, 1758) is a complex of three sibling species, and includes data of Leptidea juvernica Williams, 1946, and Leptidea reali Reissinger, 1990 (Dincă et al. 2011b; Dincă et al. 2013). Whereas Leptidea sinapis can be separated by their genitalia, the other two taxa can only be separated from each other by molecular characters. Leptidea reali seems to replace Leptidea juvernica in SW Europe, and both occur largely in sympatry with Leptidea sinapis.

Lycaena tityrus (Poda, 1761) includes data of Lycaena bleusei Oberthür, 1884 from Central Spain and Central Portugal, which appears to be a distinct species according to unpublished molecular data.

Melitaea athalia (Rottemburg, 1775) includes the Southwest European Melitaea nevadensis Oberthür, 1904 (syn. celadussa Fruhstorfer, 1910) which might only be a subspecies of the former. Molecular data are inconclusive regarding the taxonomic status of these parapatric taxa.

Melitaea phoebe (Goeze, 1779) recently turned out to be a complex of at least two largely sympatric species with distinctive larval colouration, and our data probably include records of Melitaea ornata Christoph, 1893 (syn. telona Fruhstorfer, 1908 and emipunica Verity, 1919) (see Toth et al. 2013; Toth and Varga 2011; Tshikolovets 2011).

Polyommatus icarus (Rottemburg, 1775) includes data of Polyommatus celina (Austaut, 1879), which was recognized as a distinct species from North Africa and the Canary Islands by molecular methods (Wiemers et al. 2010), but also occurs in Southern Spain, and appears to replace Polyommatus icarus in the Balearic Islands, Sardinia, and Sicily (Dincă et al. 2011a).

Pontia daplidice (Linnaeus, 1758) includes the data of the sibling species Pontia edusa (Fabricius, 1777), a parapatric taxon, which can only be distinguished by molecular methods (Geiger and Scholl 1982; John et al. 2013; Wiemers unpubl.).

Methods
Butterfly distribution data

Climatic niche characteristics of the butterflies in Europe are based on their European distribution. Butterfly distributions were available from about 7000 georeferenced localities and about 200, 000 database records. These records were stored in a database and constituted also the basis for ‘The Distribution Atlas of European Butterflies’ (Kudrna 2002) and, as an updated version, for the ‘Distribution Atlas of Butterflies in Europe’ (Kudrna et al. 2011; Fig. 6). The data are owned by the Helmholtz Centre for Environmental Research (and thus by the originators of CLIMBER). To avoid problems of occasional undersampling and imprecise geo-reference of some locations at the local scale, we re-sampled the localities to 1720 CGRS grid cells at a 50 km × 50 km resolution. Distribution data refer to the period of 1981–2000 and cover the abovementioned European window of 11°W, 32°E longitude and 34°N, 72°N latitude. We also provide an estimation of species range sizes by the number of grid cells used for calculating the climatic species characteristics.

Figure 6.

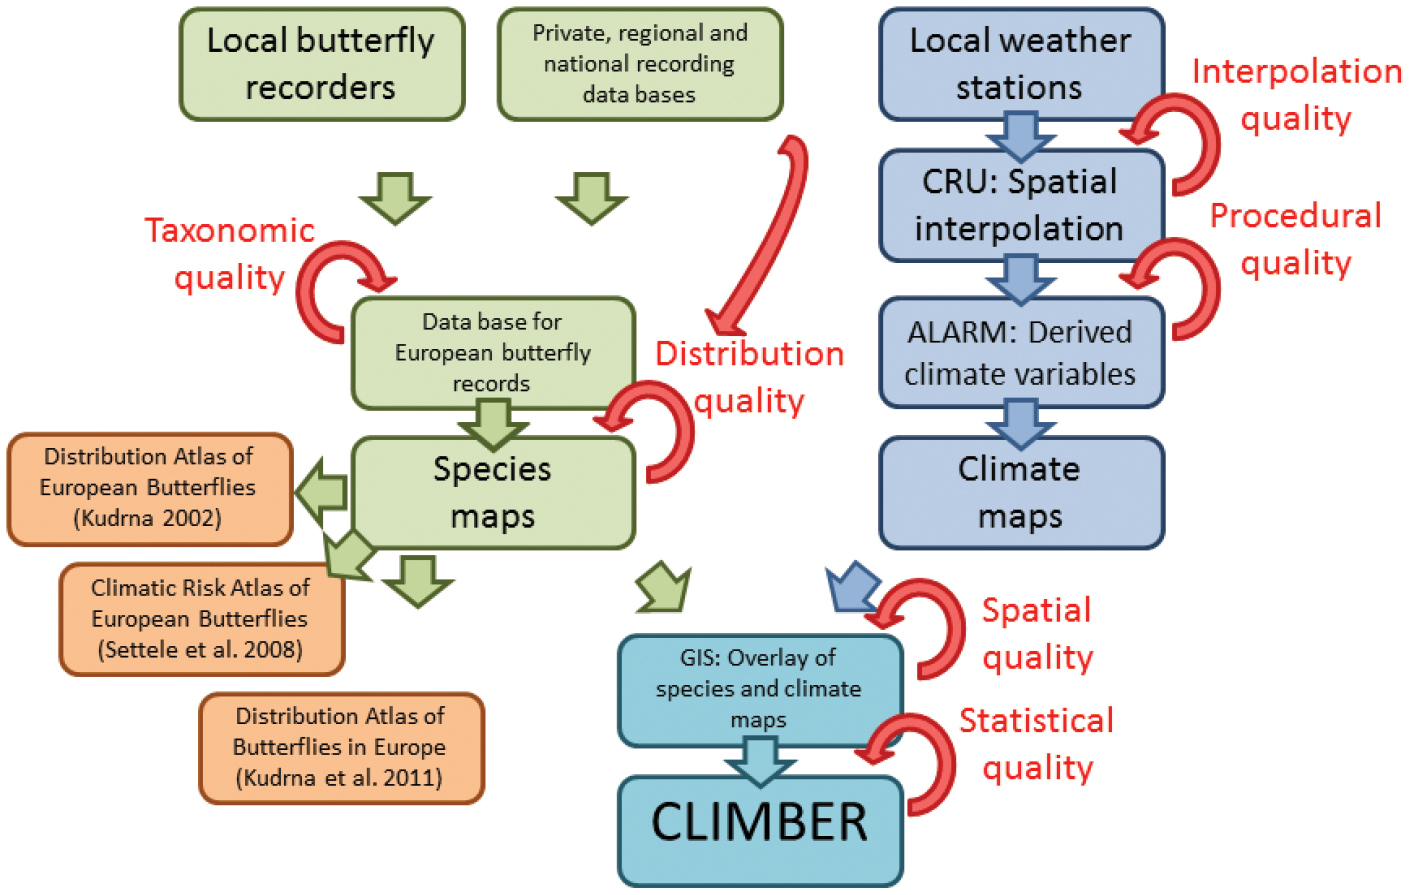
Work flow and data sources for the generation of CLIMBER. Butterfly distribution data are based on a database which combines information from local recorders and private, regional and national databases. Thereof, species distributional maps have been developed. Together with maps of original and derived climate variables, based on interpolated data from local weather stations, species distribution-climate relationships have been assessed in a GIS. Based on these relationships several statistics describing the climatic characteristics of 397 European butterfly species have been developed and stored in CLIMBER. Several steps of quality control ensure a high level of data accuracy. CRU; Climate Research Unit, University of East Anglia (http://www.cru.uea.ac.uk/). ALARM; EU, FP6 project ‘Assessing Large Scale Risks for Biodiversity with Tested Methods’ (http://www.alarmproject.net/climate/climate/).

Climate data

We used monthly, interpolated climate data (publicly available at http://www.alarmproject.net/climate/climate), originally provided via the ALARM project (Settele et al. 2012; Settele et al. 2005; Spangenberg et al. 2012) at a 10 arcmin grid resolution (Mitchell et al. 2004; New et al. 2000) and aggregated them to the CGRS grid (Fig. 6). For a detailed description of the climate data see Fronzek et al. (2012). The following basic climatic variables were used to assess aspects of the climatic niche: mean annual temperature (°C), range of annual temperature (°C), annual precipitation sum (mm), range of annual precipitation (mm), accumulated growing degree days with a base temperature of 5°C until February, April, June and August and soil water content for the upper horizon (0.5 m). Different time periods for calculating accumulated growing degree days enable the consideration of different phenologies and phenological aspects in the analysis of the climatic species characteristics. We do not provide growing degree days for periods ending later than August because these values are highly correlated with mean annual temperature in any case. Soil water content originated from the dynamic vegetation model LPJ-GUESS (Hickler et al. 2009; Hickler et al. 2004) which provides a process-based representation of the water balance in terrestrial ecosystems. According to the time period of the butterfly distribution data, we used averaged values for the period 1971–2000 for the climate data.

Calculation of the climatic niche characteristics

Climatic niche characteristics were calculated per butterfly species according to the climatic conditions across their respective ranges, i.e. across all grid cells in which a particular species occurs (see Devictor et al. 2012a; Schweiger et al. 2012; Van Swaay et al. 2010; Van Swaay et al. 2008; Fig. 6). The dataset comprises information for the position and breadth of the climatic niche. Niche position is indicated by the median and mean value for each climate variable across a species’ range, accompanied by the 95% confidence interval for the mean. Niche breadth is indicated by the standard deviation and the minimum and maximum values for each climatic variable across a species’ range.

Data verification

Several steps of quality control ensure a high level of data accuracy (Fig. 6). During the step of compiling butterfly records for Europe, taxonomic experts addressed problems of potential misidentification, synonymy and the taxonomic concept. Once the species distribution maps had been produced, internal and external control ensured the elimination of obviously wrong records (species outside their natural range). Climate data are based on original climate variables from the Climate Research Unit (CRU) of the University of East Anglia and derived climate variables generated by the ALARM project. Both, CRU and ALARM ensured a high level of internal and external quality control. Data quality for the calculation of the climatic niche characteristics for each butterfly species is high (about 200, 000 records for butterfly distribution; well recognised and commonly accepted climate data). Additionally, we provide the number of grid cells which have been used to calculate the climatic species characteristics and the standard deviation to assess uncertainty of the measures.

Data status and accessibility
Status

Data set version: v1.3

Latest update: 18.10.2013.

Metadata status: Metadata are complete and stored with the data.

Accessibility

Copyright restrictions: None.

Proprietary restrictions: This dataset is freely available for non-commercial scientific use.

Citation: Data users must cite this Data Paper properly in any publication that results from an analysis using the provided data as a whole or in parts as: Schweiger O, Harpke A, Wiemers M, Settele J (2013). CLIMBER: Climatic niche characteristics of the butterflies in Europe. ZooKeys 367: 65–84. doi: 10.3897/zookeys.367.6185

In addition to the Data Paper the resource should be cited as: Helmholtz Centre for Environmental Research - UFZ (2013). CLIMBER: Climatic niche characteristics

of the butterflies in Europe. 397 records, Online at http://ipt.pensoft.net/ipt/resource.do?r=climber, version 1.3 (released on 3/12/2013), Resource ID: GBIF key: http://www.gbif.org/dataset/e2bcea8c-dfea-475e-a4ae-af282b4ea1c5, Data Paper ID: doi: 10.3897/zookeys.367.6185

Collab

oration: Data users might consider collaboration and/or co-authorship with the data owners.

Storage location: http://ipt.pensoft.net/ipt/resource.do?r=climber

Data structure
Dataset file

File name: CLIMBER.v.1.3.csv

Size: 398 rows, 67 columns; 183 kB.

Format and storage mode: ASCII csv, semicolon-delimited; decimal separator: ‘.’.

Header information: First row provides variable names.

Alphanumeric attributes: Mixed.

Special characters: Missing values are indicated by NA.

Variable definition

Climatic niche characteristics are based on nine climate variables (Table 3). All climate variables represent average values for the period of 1971–2000. Seven statistics are available for each climate variable (Table 4).

Table 3.

Climatic variables used for the assessment of climatic niche characteristics of the butterflies in Europe.

Name Definition Unit Interpretation
range.size Distributional range size as number of occupied grids Grid cells Sample size
temp Mean annual temperature °C Temperature (STI)
range.ann.temp Annual range in monthly temperature (warmest month - coldest month) °C Continentality
precip Annual precipitation sum mm Precipitation
range.ann.precip Annual range in monthly precipitation sum (wettest month - driest month) mm Oceanity
gdd.feb Accumulated growing degree days above 5°C from January to February °C Temperature corrected for metabolic activity preconditions
gdd.apr Accumulated growing degree days above 5°C from January to April °C Temperature corrected for metabolic activity preconditions
gdd.june Accumulated growing degree days above 5°C from January to June °C Temperature corrected for metabolic activity preconditions
gdd.aug Accumulated growing degree days above 5°C from January to August °C Temperature corrected for metabolic activity preconditions
swc Soil water content of the upper horizon (0.5 m) No unit (0-1) Water availability
Table 4.

Statistics available for each climate variable describing the niche position and breadth for the butterflies in Europe.

Name Definition Interpretation
mean Mean value of climate variable across the species’ range ‘Optimal’ climatic conditions; niche position
ci.95.low Lower 95% confidence interval for the mean Uncertainty of the mean
ci.95.up Upper 95% confidence interval for the mean Uncertainty of the mean
min Minimum value of the climate variable across the species range Lower climatic limit
max Maximum value of the climate variable across the species range Upper climatic limit
sd Standard deviation of the climate variable across the species range Niche breadth

We also provide an estimation of species range size (range.size) to assess the number of grid cells used for calculating the climatic species characteristics. For a detailed description of swc see section Climate data. Annual measures are calculated over full 12 month periods, while accumulated growing degree days have been calculated for four periods from January to February, April, June and August to cover a variety of phenological aspects and life cycle stages.

Species range refers to the distributional range according to the 50 km × 50 km CGRS grid cells in which a species was recorded.

Data anomalies

Missing values: NA indicates that a species was only present in one grid cell and thus 95% confidence intervals and standard deviation could not be calculated.

Acknowledgements

Most of the distributional data were compiled by Dr. Otakar Kudrna, especially within the framework of Kudrna (2002) and Kudrna et al. (2011). We further acknowledge the support of European Commission Framework Programme (FP) 6 via the Integrated Project ALARM (GOCE-CT-2003-506675; Settele et al. 2005) and FP 7 via the Integrated Project SCALES (grant 226 852; Henle et al. 2010) and the Collaborative Project STEP (grant 244090 – STEP – CP – FP; Potts et al. 2011) and the FP6 BiodivERsA Eranet project CLIMIT (funded by DLR-BMBF (Germany), NERC and DEFRA (UK), ANR (France), Formas (Sweden) and Swedish EPA (Sweden); Settele and Kühn 2009; Thomas et al. 2009).

References References cited within metadata
Araújo MB, Guisan A (2006) Five (or so) challenges for species distribution modelling. Journal of Biogeography 33: 1677-1688.
Barnagaud JY, Devictor V, Jiguet F, Barbet-Massin M, Le Viol I, Archaux F (2012) Relating Habitat and Climatic Niches in Birds. PLoS ONE 7(3): e32819. doi: 10.1371/journal.pone.0032819
Buckley LB, Waaser SA, MacLean HJ, Fox R (2011) Does including physiology improve species distribution model predictions of responses to recent climate change? Ecology 92: 2214–2221. doi: 10.1890/11-0066.1
Heikkinen RK, Luoto M, Leikola N, Pöyry J, Settele J, Kudrna O, Marmion M, Fronzek S, Thuiller W (2010) Assessing the vulnerability of European butterflies to climate change using multiple criteria. Biodiversity and Conservation 19: 695-723. doi: 10.1007/s10531-009-9728-x
Henle K, Kunin WE, Schweiger O, Schmeller DS, Grobelnik V, Matsinos Y, Pantis J, Penev L, Potts SG, Ring I, Similä J, Tzanopoulos J, van den Hove S, Baguette M, Clobert J, Excoffier L, Framstad E, Grodzinska-Jurczak M, Lengyel S, Marty P, Moilanen A, Porcher E, Storch D, Steffan-Dewenter I, Sykes MT, Zobel M, Settele J (2010) Securing the conservation of biodiversity across administrative levels and spatial, temporal, and ecological scales - research needs and approaches of the SCALES project. GAIA - Ecological Perspectives for Science and Society 19: 187-193.
Hill JK, Thomas CD, Fox R, Telfer MG, Willis SG, Asher J, Huntley B (2002) Responses of butterflies to twentieth century climate warming: implications for future ranges. Proceedings of the Royal Society of London Series B-Biological Sciences 269: 2163-2171. doi: 10.1098/rspb.2002.2134
Hutchinson GE (1957) Concluding remarks. Cold Spring Harbor Symposium on Quantitative Biology 22: 415-427. doi: 10.1101/SQB.1957.022.01.039
Lavergne S, Evans MEK, Burfield IJ, Jiguet F, Thuiller W (2013) Are species’ responses to global change predicted by past niche evolution? Philosophical Transactions of the Royal Society B-Biological Sciences 368. doi: 10.1098/rstb.2012.0091
Lavergne S, Mouquet N, Thuiller W, Ronce O (2010) Biodiversity and Climate Change: Integrating Evolutionary and Ecological Responses of Species and Communities. Annual Review of Ecology, Evolution, and Systematics 41: 321-350. doi: 10.1146/annurev-ecolsys-102209-144628
Michener WK, Brunt JW, Helly JJ, Kirchner TB, Stafford SG (1997) Nongeospatial metadata for the ecological sciences. Ecological Applications 7: 330-342. doi: 10.1890/1051-0761(1997)007[0330:NMFTES]2.0.CO;2
Parmesan C (2006) Ecological and evolutionary responses to recent climate change. Annual Review of Ecology Evolution and Systematics 37: 637-669. doi: 10.1146/annurev.ecolsys.37.091305.110100
Potts SG, Biesmeijer JC, Bommarco R, Felicioli A, Fischer M, Jokinen P, Kleijn D, Klein AM, Kunin WE, Neumann P, Penev LD, Petanidou T, Rasmont P, Roberts SPM, Smith HG, Sorensen PB, Steffan-Dewenter I, Vaissiere BE, Vila M, Vujic A, Woyciechowski M, Zobel M, Settele J, Schweiger O (2011) Developing European conservation and mitigation tools for pollination services: approaches of the STEP (Status and Trends of European Pollinators) project. Journal of Apicultural Research 50: 152-164. doi: 10.3896/IBRA.1.50.2.07
Potts SG, Biesmeijer JC, Kremen C, Neumann P, Schweiger O, Kunin WE (2010) Global pollinator declines: trends, impacts and drivers. Trends in Ecology & Evolution 25: 345-353. doi: 10.1016/j.tree.2010.01.007
Pöyry J, Luoto M, Heikkinen RK, Kuussaari M, Saarinen K (2009) Species traits explain recent range shifts of Finnish butterflies. Global Change Biology 15: 732-743. doi: 10.1111/j.1365-2486.2008.01789.x
Roy DB, Rothery P, Moss D, Pollard E, Thomas JA (2001) Butterfly numbers and weather: predicting historical trends in abundance and the future effects of climate change. Journal of Animal Ecology 70: 201-217. doi: 10.1046/j.1365-2656.2001.00480.x
Schröter D, Cramer W, Leemans R, Prentice IC, Araújo MB, Arnell NW, Bondeau A, Bugmann H, Carter TR, Gracia CA, de la Vega-Leinert AC, Erhard M, Ewert F, Glendining M, House JI, Kankaanpaa S, Klein RJT, Lavorel S, Lindner M, Metzger MJ, Meyer J, Mitchell TD, Reginster I, Rounsevell M, Sabate S, Sitch S, Smith B, Smith J, Smith P, Sykes MT, Thonicke K, Thuiller W, Tuck G, Zaehle S, Zierl B (2005) Ecosystem service supply and vulnerability to global change in Europe. Science 310: 1333-1337. doi: 10.1126/science.1115233
Settele J, Carter TR, Kühn I, Spangenberg JH, Sykes MT (2012) Scenarios as a tool for large-scale ecological research: experiences and legacy of the ALARM project. Global Ecology and Biogeography 21: 1-4. doi: 10.1111/j.1466-8238.2011.00720.x
Settele J, Kühn E (2009) Insect Conservation. Science 325: 41-42. doi: 10.1126/science.1176892
Spangenberg JH, Bondeau A, Carter TR, Fronzek S, Jaeger J, Jylhä K, Kühn I, Omann I, Paul A, Reginster I, Rounsevell M, Schweiger O, Stocker A, Sykes MT, Settele J (2012) Scenarios for investigating risks to biodiversity. Global Ecology and Biogeography 21: 5-18. doi: 10.1111/j.1466-8238.2010.00620.x
Thomas JA, Simcox DJ, Clarke RT (2009) Successful Conservation of a Threatened Maculinea Butterfly. Science 325: 80-83. doi: 10.1126/science.1175726
Visser ME (2008) Keeping up with a warming world; assessing the rate of adaptation to climate change. Proceedings of the Royal Society B-Biological Sciences 275: 649-659. doi: 10.1098/rspb.2007.0997
Warren MS, Hill JK, Thomas JA, Asher J, Fox R, Huntley B, Roy DB, Telfer MG, Jeffcoate S, Harding P, Jeffcoate G, Willis SG, Greatorex-Davies JN, Moss D, Thomas CD (2001) Rapid responses of British butterflies to opposing forces of climate and habitat change. Nature 414: 65-69. doi: 10.1038/35102054
References used to develop the dataset
Dincă V, Dapporto L, Vila R (2011a) A combined genetic-morphometric analysis unravels the complex biogeographical history of Polyommatus icarus and Polyommatus celina common blue butterflies. Molecular Ecology 20: 3921-3935. doi: 10.1111/j.1365-294X.2011.05223.x
Dincă V, Lukhtanov VA, Talavera G, Vila R (2011b) Unexpected layers of cryptic diversity in wood white Leptidea butterflies. Nature Communications 2: 324. doi: 10.1038/ncomms1329
Dincă V, Wiklund C, Lukhtanov VA, Kodandaramaiah U, Noren K, Dapporto L, Wahlberg N, Vila R, Friberg M (2013) Reproductive isolation and patterns of genetic differentiation in a cryptic butterfly species complex. Journal of Evolutionary Biology. doi: 10.1111/jeb.12211
Devictor V, Julliard R, Couvet D, Jiguet F (2008) Birds are tracking climate warming, but not fast enough. Proceedings of the Royal Society B-Biological Sciences 275: 2743-2748. doi: 10.1098/rspb.2008.0878
Eckweiler W (2012) New discoveries of Pseudochazara mamurra amymone Brown, 1976 (Lepidoptera: Nymphalidae, Satyrinae). Nachrichten des Entomologischen Vereins Apollo, NF 33: 1-4.
Fronzek S, Carter TR, Jylha K (2012) Representing two centuries of past and future climate for assessing risks to biodiversity in Europe. Global Ecology and Biogeography 21: 19-35. doi: 10.1111/j.1466-8238.2011.00695.x
Geiger H, Scholl A (1982) Pontia daplidice (Lepidoptera, Pieridae) in Südeuropa - eine Gruppe von zwei Arten. Mitteilungen der Schweizerischen Entomologischen Gesellschaft 55: 107-114.
Hickler T, Fronzek S, Araújo MB, Schweiger O, Thuiller W, Sykes M (2009) An ecosystem-model-based estimate of changes in water availability differs from water proxies that are commonly used in species distribution models. Global Ecology and Biogeography 18: 304-313. doi: 10.1111/j.1466-8238.2009.00455.x
Hickler T, Smith B, Sykes MT, Davis MB, Sugita S, Walker K (2004) Using a generalized vegetation model to simulate vegetation dynamics in northeastern USA. Ecology 85: 519-530. doi: 10.1890/02-0344
John E, Wiemers M, Makris C, Russell P (2013) The Pontia daplidice (Linnaeus, 1758)/Pontia edusa (Fabricius, 1777) complex (Lepidoptera: Pieridae): confirmation of the presence of Pontia daplidice in Cyprus, and of Cleome iberica DC. as a new host-plant for this species in the Levant. Entomologist’s Gazette 64: 69-78.
Kudrna O (2002) The distribution atlas of European butterflies. Apollo Books, Stenstrup, 343 pp.
Kudrna O, Harpke A, Lux K, Pennerstorfer J, Schweiger O, Settele J, Wiemers M (2011) Distribution atlas of butterflies in Europe. Gesellschaft für Schmetterlingsschutz, Halle, Germany, 576 pp.
Mitchell TD, Carter TR, Jones PD, Hulme M, New M (2004) A comprehensive set of high-resolution grids of monthly climate for Europe and the globe: the observed record (1901–2000) and 16 scenarios (2001–2100). Tyndall Centre for for Climate Change Research, University of East Anglia, Norwich, UK, 30 pp.
New M, Hulme M, Jones P (2000) Representing twentieth-century space-time climate variability. Part II: Development of 1901-96 monthly grids of terrestrial surface climate. Journal of Climate 13: 2217-2238. doi: 10.1175/1520-0442(2000)013<2217:RTCSTC>2.0.CO;2
Regier JC, Mitter C, Zwick A, Bazinet AL, Cummings MP, Kawahara AY, Sohn JC, Zwickl DJ, Cho S, Davis DR, Baixeras J, Brown J, Parr C, Weller S, Lees DC, Mitter KT (2013) A large-scale, higher-level, molecular phylogenetic study of the insect order Lepidoptera (moths and butterflies). PLoS ONE 8(3): e58568. doi: 10.1371/journal.pone.0058568
Sanudo-Restrepo CP, Dinca V, Talavera G, Vila R (2013) Biogeography and systematics of Aricia butterflies (Lepidoptera, Lycaenidae). Molecular Phylogenetics and Evolution 66: 369-379. doi: 10.1016/j.ympev.2012.10.010
Settele J, Hammen V, Hulme P, Karlson U, Klotz S, Kotarac M, Kunin W, Marion G, O’Connor M, Petanidou T, Peterson K, Potts S, Pritchard H, Pyšek P, Rounsevell M, Spangenberg J, Steffan-Dewenter I, Sykes M, Vighi M, Zobel M, Kühn I (2005) ALARM: Assessing LArge-scale environmental Risks for biodiversity with tested Methods. Gaia-Ecological Perspectives for Science and Society 14: 69-72.
Settele J, Kudrna O, Harpke A, Kühn I, van Swaay C, Verovnik R, Warren M, Wiemers M, Hanspach J, Hickler T, Kühn E, van Halder I, Veling K, Vleigenhart A, Wynhoff I, Schweiger O (2008) Climatic risk atlas of European butterflies. BioRisk 1: 1-710. doi: 10.3897/biorisk.1
Toth JP, Varga K, Vegvari Z, Varga Z (2013) Distribution of the Eastern knapweed fritillary (Melitaea ornata Christoph, 1893) (Lepidoptera: Nymphalidae): past, present and future. Journal of Insect Conservation 17: 245-255. doi: 10.1007/s10841-012-9503-2
Toth JP, Varga Z (2011) Inter- and intraspecific variation in the genitalia of the ‘Melitaea phoebe group’ (Lepidoptera, Nymphalidae). Zoologischer Anzeiger 250: 258-268. doi: 10.1016/j.jcz.2011.05.002
Tshikolovets VV (2011) Butterflies of Europe and the Mediterranean area. Tshikolovets Publications, Kiev, 544 pp.
Wahlberg N, Wheat CW, Peña C (2013) Timing and Patterns in the Taxonomic Diversification of Lepidoptera (Butterflies and Moths). PLoS ONE 8(11): e80875. doi: 10.1371/journal.pone.0080875
Wiemers M, Stradomsky BV, Vodolazhsky DI (2010) A molecular phylogeny of Polyommatus s. str. and Plebicula based on mitochondrial COI and nuclear ITS2 sequences (Lepidoptera: Lycaenidae). European Journal of Entomology 107: 325-336.
Publications based on this dataset
Devictor V, Van Swaay C, Brereton T, Brotons L, Chamberlain D, Heliölä J, Herrando S, Julliard R, Kuussaari M, Lindstöm A, Reif J, Roy DB, Schweiger O, Settele J, Stefanescu C, Van Strien A, Van Turnhout C, Vermouzek S, WallisDeVries MF, Wynhoff I, Jiguet F (2012a) Differences in the climatic debts of birds and butterflies at a continental scale. Nature Climate Change 2: 121-124. doi: 10.1038/nclimate1347
Devictor V, van Swaay C, Brereton T, Brotons L, Chamberlain D, Heliola J, Herrando S, Julliard R, Kuussaari M, Lindstrom A, Reif J, Roy DB, Schweiger O, Settele J, Stefanescu C, Van Strien A, Van Turnhout C, Vermouzek Z, De Vries MW, Wynhoff I, Jiguet F (2012b) Uncertainty in thermal tolerances and climatic debt. Nature Climate Change 2: 638-639. doi: 10.1038/nclimate1668
Schweiger O, Heikkinen RK, Harpke A, Hickler T, Klotz S, Kudrna O, Kühn I, Pöyry J, Settele J (2012) Increasing range mismatching of interacting species under global change is related to their ecological characteristics. Global Ecology and Biogeography 21: 88-99. doi: 10.1111/j.1466-8238.2010.00607.x
Van Swaay CAM, Harpke A, Van Strien A, Fontaine B, Stefanescu C, Roy D, Maes D, Kühn E, Ounap E, Regan EC, Svitra G, Heliölä J, Settele J, Musche M, Warren MS, Plattner M, Kuussaari M, Cornish N, Schweiger O, Feldmann R, Julliard R, Verovnik R, Roth T, Bereton T (2010) The impact of climate change on butterfly communities 1990–2009. Wageningen, 22 pp.
Van Swaay CAM, Van Strien A, Julliard R, Schweiger O, Bereton T, Heliölä J, Kuussaari M, Roy D, Stefanescu C, Warren MS, Settele J (2008) Developing a methodology for a European Butterfly Climate Change Indicator. Wageningen, 29 pp.
Appendix

Database of the climatic niche characteristics of the butterflies in Europe (CLIMBER). (doi: 10.3897/zookeys.367.6185.app) File format: Comma-separated values file (csv).