


(C) 2013 Alba Ardura. This is an open access article distributed under the terms of the Creative Commons Attribution License (CC BY 4.0), which permits unrestricted use, distribution, and reproduction in any medium, provided the original author and source are credited.
For reference, use of the paginated PDF or printed version of this article is recommended.
Citation: Ardura A, Planes S, Garcia-Vazquez E (2013) Applications of DNA barcoding to fish landings: authentication and diversity assessmente. In: Nagy ZT, Backeljau T, De Meyer M, Jordaens K (Eds) DNA barcoding: a practical tool for fundamental and applied biodiversity research. ZooKeys 365: 49–65. doi: 10.3897/zookeys.365.6409
DNA barcoding methodologies are being increasingly applied not only for scientific purposes but also for diverse real-life uses. Fisheries assessment is a potential niche for DNA barcoding, which serves for species authentication and may also be used for estimating within-population genetic diversity of exploited fish. Analysis of single-sequence barcodes has been proposed as a shortcut for measuring diversity in addition to the original purpose of species identification. Here we explore the relative utility of different mitochondrial sequences (12S rDNA, COI, cyt b, and D-Loop) for application as barcodes in fisheries sciences, using as case studies two marine and two freshwater catches of contrasting diversity levels. Ambiguous catch identification from COI and cyt b was observed. In some cases this could be attributed to duplicated names in databases, but in others it could be due to mitochondrial introgression between closely related species that may obscure species assignation from mtDNA. This last problem could be solved using a combination of mitochondrial and nuclear genes. We suggest to simultaneously analyze one conserved and one more polymorphic gene to identify species and assess diversity in fish catches.
Species identification, freshwater fisheries, marine fisheries, genetic diversity, mitochondrial DNA markers
DNA barcoding is increasingly important in natural sciences. For ecologists it is a tool with many utilities (e.g.
Despite the potential importance of genetics in fisheries, the application of DNA analyses in real cases is not so easy. The economic aspect is crucial: increasing costs are making fisheries not only ecologically, but also economically unsustainable (e.g.
The potential taxonomic diversity of fish catches is enormous, since in biodiversity hotspots unknown species are landed (
The objective of this study was to assess the utility of well-known public databases for identifying catches from very different fisheries, comparing genes and species for determining if there is sufficient information available for routine genetic analysis of fish catches that informs about species composition. The main areas where generating new data are necessary, if any, will be identified from the shortcomings detected in this small-scale exercise. We have employed standard primer sets for PCR amplification of four mtDNA gene fragments, then estimated standard parameters of genetic diversity and evaluated their utility for identifying landings using GenBank and BOLD. We have also estimated intrapopulation diversity in order to assess possible applications of these markers for monitoring demographic changes. Our case studies were two marine and two freshwater catches of contrasting diversity for the standard COI DNA barcode (
Mediterranean Sea. It is a marine biodiversity hotspot with 713 fish species inventoried (FishBase; www.fishbase.org). Samples were obtained from fish markets in the Languedoc-Roussillon region (Gulf of Lion, France), in the north-western Mediterranean coast.
Cantabric Sea. Less diverse than the Mediterranean Sea, it contains 148 fish species inventoried. Catch from commercial fisheries was sampled from fish markets in Asturias (North of Spain).
Amazon River. It is the main freshwater biodiversity hotspot of the world (1218 inventoried fish species). We have sampled catches obtained in different fish markets of Manaus (Brazil). This is the area where the two main Amazonian drainages (the rivers Negro and Solimões) join.
Narcea River (North of Spain). As other North Iberian rivers, it exhibits reduced biodiversity with only 17 fish species inventoried. Fisheries are strongly targeted and focused on sport angling of salmonids. Samples were obtained in situ from fishermen in the lower reach of the river.
The two most exploited species (those that yield more tonnes in official catch statistics) from each site were chosen for this study. They were: mackerel Scomber scombrus (Goode, 1884) and anchovy Engraulis encrasicolus (Linnaeus, 1758) from the Mediterranean Sea; mackerel and albacore tuna Thunnus alalunga (Bonnaterre, 1778) from the Cantabric Sea; Curimatá Prochilodus nigricans (Spix & Agassiz, 1829) and jaraquí Semaprochilodus insignis (Jardine & Schomburgk, 1841) from the Amazon River; Atlantic salmon Salmo salar (Linnaeus, 1758) and brown trout Salmo trutta (Linnaeus, 1758) from the Narcea River. These species do not exhibit population sub-division in the fishing areas considered. The West Mediterranean and the Eastern Atlantic Ocean populations of mackerel seem to form a panmictic unit (
Ten samples were analyzed per species.
DNA extraction was automatized with QIAxtractor robot following the manufacturer’s protocol (QIAGEN DX Universal DNA Extraction Tissue Sample CorProtocol), which yields high quality DNA suitable for a wide variety of downstream applications. The procedure is divided into two sections: digestion and extraction. The digestion process favors tissue dissociation and liquid suspension, and is ready for extraction.
Briefly, a 96 well round well lysis block (Sample Block) is loaded with 420 µl DX Tissue Digest (containing 1% v/v DX Digest Enzyme) manually or using the Tissue Digest Preload run file. Once the DX Tissue Digest is loaded with the sample, the sample block is sealed and incubated at 55 °C with agitation for at least 3 h. 220 µl of supernatant is transferred from the sample block in position C1 to the lysis plate in position B1. 440 µl of DX Binding with DX Binding Additive is added to the lysis plate. The lysate is then mixed 8 × and incubated at room temperature for 5 min. 600 µl of the lysate is added into the capture plate (Pre-mixed 8 ×). A vacuum of 35 kPa is applied for 5 min. 200 µl of DX Binding with DX Binding Additive is loaded into the capture plate. A vacuum of 35 kPa is applied for 5 min. 600 µl of DX Wash is loaded into the capture plate. A vacuum of 25 kPa applied for 1 min, repeated (2 iterations). 600 µl of DX Final Wash is loaded into the capture plate. A vacuum of 35 kPa is applied for 1 minute. A vacuum of 25 kPa is applied for 5 min to dry the plate. The carriage is moved to elution chamber. 200 µl of Elution buffer is loaded into the capture plate. The sample is then incubated for 5 min. A vacuum of 35 kPa is applied for 1 min.
We employed the QIAxtractor Software application. The tube was frozen at -20 °C for long-time preservation.
Fragments of four different mitochondrial genes were amplified by polymerase chain reaction (PCR): 12S rDNA, COI, cyt b and D-Loop (Table 1). We employed primers commonly used for fish published by
Species considered within each case study; common and specific names and classification. Numbers of nucleotides obtained for each mtDNA gene fragment (length in bp) and GenBank Accession Numbers.
| REGION | SPECIES | CLASSIFICATION (Order, Family) |
Mitochondrial regions (length in bp) |
GenBank A.N. | |
|---|---|---|---|---|---|
| Common name | Scientific name | ||||
| Amazon River | curimata | Prochilodus nigricans | Characiformes, Curimatidae | 12S rDNA (380) | JN007487–JN007496 |
| COI (605) | JN007727–JN007734; HM480806–HM480807 | ||||
| cyt b (293) | JN007647–JN007656 | ||||
| D–Loop (424) | JN007567–JN007576 | ||||
| jaraquí | Semaprochilodus insignis | Characiformes, Curimatidae | 12S rDNA (380) | JN007497–JN007506 | |
| COI (605) | JN007735–JN007744 | ||||
| cyt b (293) | JN007657–JN007666 | ||||
| D–Loop (424) | JN007577–JN007586 | ||||
| Cantabric Sea | mackerel | Scomber scombrus | Perciformes, Scombridae | ||
| 12S rDNA (382) | JN007507–JN007516 | ||||
| COI (605) | JN007745–JN007751; HM480797; HM480799; HM480819 | ||||
| cyt b (293) | JN007667–JN007676 | ||||
| D–Loop (412) | JN007587–JN007596 | ||||
| tuna | Thunnus alalunga | Perciformes, Scombridae | 12S rDNA (382) | JN007517–JN007526 | |
| COI (605) | JN007752–JN007761 | ||||
| cyt b (293) | JN007677–JN007687 | ||||
| D–Loop (412) | JN007597–JN007606 | ||||
| Mediterranean Sea | anchovy | Engraulis encrasicolus | Clupeiformes, Engraulidae | 12S rDNA (384) | JN007527–JN007536 |
| COI (605) | JN007762–JN007768; HM480814–HM480816 | ||||
| cyt b (293) | JN007687–JN007696 | ||||
| D–Loop (462) | JN007607–JN007616 | ||||
| mackerel | Scomber scombrus | Perciformes, Scombridae | 12S rDNA (384) | JN007537–JN007546 | |
| COI (605) | JN007769–JN007777; HM480797 | ||||
| cyt b (293) | JN007697–JN007706 | ||||
| D–Loop (462) | JN007617–JN007626 | ||||
| Narcea River | Atlantic salmon | Salmo salar | Salmoniformes, Salmonidae | 12S rDNA (439) | JN007547–JN007556 |
| COI (635) | JN007778–JN007787 | ||||
| cyt b (322) | JN007707–JN007716 | ||||
| D–Loop (460) | JN007627–JN007636 | ||||
| brown trout | Salmo trutta | Salmoniformes, Salmonidae | 12S rDNA (439) | JN007557–JN007566 | |
| COI (635pb) | JN007788–JN007797 | ||||
| cyt b (322) | JN007717–JN007726 | ||||
| D–Loop (460) | JN007637–JN007646 | ||||
The PCR conditions were the following:
12S rDNA: an initial denaturation at 95 °C for 10 min, then 35 cycles of denaturation at 94 °C for 1 min, annealing at 57 °C for 1 min and extension at 72 °C for 1.5 min, followed by a final extension at 72 °C for 7 min.
COI: an initial denaturation at 94 °C for 5 min, then 10 cycles of denaturation at 94 °C for 1 min, annealing at 64–54 °C for 1 min and extension at 72 °C for 1.5 min, followed by 25 cycles of denaturation at 94 °C for 1 min, annealing at 54 °C for 1 min and extension at 72 °C for 1.5 min, finally a final extension at 72 °C for 5 min.
cyt b: an initial denaturation at 94 °C for 5 min, then 10 cycles of denaturation at 94 °C for 1 min, annealing at 60–50 °C for 1 min and extension at 72 °C for 1.5 min, followed by 25 cycles of denaturation at 94 °C for 1 min, annealing at 54 °C for 1 min and extension at 72 °C for 1.5 min, finally a final extension at 72 °C for 5 min.
D-Loop: an initial denaturation at 94 °C for 5 min, then 10 cycles of denaturation at 94 °C for 1 min, annealing at 57 °C for 1 min and extension at 72 °C for 1.5 min, followed by 25 cycles of denaturation at 94 °C for 1 min, annealing at 54 °C for 1 min and extension at 72 °C for 1.5 min, finally a final extension at 72 °C for 5 min.
Sequencing was carried out by the DNA sequencing service GATC Biotech (Germany).
Sequences were visualized and edited employing the BioEdit Sequence Alignment Editor software (
Putative proteins (amino acid sequences) from the COI and cyt b sequences were inferred with the software MEGA v4.0 (
The sequences obtained were compared with those existing in the public database GenBank using the BLAST tool (http://blast.ncbi.nlm.nih.gov/Blast.cgi?PROGRAM=blastn&BLAST_PROGRAMS=megaBlast&PAGE_TYPE=BlastSearch). Species were identified based on maximum BLAST scores with matching sequences, corresponding to 100% coverage and 100% identity. When the haplotype was new (i.e. not present in GenBank and BOLD), a 100% coverage with 99% identity, or in a few cases 98% identity, was found for the matching sequence. COI barcodes were also compared against the BOLD database, uploading them in the BOLD identification system in FASTA format at http://www.boldsystems.org/index.php/IDS_OpenIdEngine. The system retrieves matching sequences with the corresponding % similarity (matching nucleotides) and gives the most likely species for the query sequence. If matching sequences from more than one species are retrieved with a similar probability, then the system displays all the possible putative species the query can be assigned to.
The two databases were accessed for species identification in September 2013.
Three well-known diversity indices were employed: number of haplotypes, haplotype diversity and nucleotide diversity. They were calculated with the DnaSP software (
Haplotype diversity is a measure of population variation, as the probability of two randomly chosen haplotypes in the sample being different. It is calculated with the formula described by
Nucleotide diversity indicates how different sequences are to each other. Its value is higher when sequences belong to distant taxa. It is defined as the average number of nucleotide differences per site between any two DNA sequences chosen randomly from the sample population, and is symbolised as π (
We have also used the simplest diversity measure Nh/n (number of haplotypes divided by the number of samples analysed).
For three study areas, the two most harvested species belonged to the same family (Table 1), viz. Curimatidae, Salmonidae and Scombridae in the Amazon River, Narcea River and Cantabric Sea, respectively. In the Mediterranean Sea, the two most harvested species were respectively anchovy Engraulis encrasicolus (Engraulidae) and mackerel Scomber scombrus (Scombridae).
PCR yielded positive amplifications in all cases, and sequences of different length were obtained for each marker and species analyzed: 380–439, 605–635, 293–322, 412–462 base pairs (bp) for 12S rDNA, COI, cyt b and D-Loop respectively (Table 1). The concatenated sequences were thus 1692–1856 bp long. The sequences obtained were submitted to the GenBank where they are available with the accession numbers reported in Table 1.
Clear and unambiguous species identification from significant matches with the databases was not always possible (Table 2). All the 12S rDNA sequences yielded a 100% identity score with at least one GenBank reference sequence (other than those generated in the present study) belonging to only one species, and were hence considered as being unambiguously identified. However, the results were less clear for the other genes and also varied among species. All mackerel samples were well-identified by the four genes and the two databases, whereas tuna retrieved more than one species with identical scores or match probabilities (Thunnus alalunga, Thunnus thynnus and Thunnus orientalis) for all cyt b and many COI and D-Loop sequences (Table 3). One D-Loop sequence retrieved Thunnus albacares as the closest match (Table 3). Ambiguous results (more than one putative species) were obtained from BOLD also for anchovy (COI sequences assigned to any of Engraulis encrasicolus, Engraulis eurystole, Engraulis australis and Engraulis japonicus species), brown trout (assigned indistinctly to Salmo trutta and Salmo ohridanus by BOLD), curimatá (Prochilodus nigricans, Prochilodus rubrotaeniatus, Prochilodus lineatus, Prochilodus costatus) and jaraquí (Semiprochilodus insignis, Semiprochilodus taeniurus, Curimata inornata). In GenBank ambiguous COI species identifications occurred for five tuna haplotypes that yielded identical and maximum matching scores with Thunnus alalunga and Thunnus orientalis sequences, and for jaraquí (Semaprochilodus insignis and Semaprochilodus taeniurus sequences yielded identical and maximum matching scores with our haplotypes). For cyt b of jaraquí (Table 3) the problem was not ambiguity but lack of external reference sequences in GenBank, viz. all the sequences yielding > 91% matching scores with ours were from the present study, and the closest identity with an external sequence (91%, unlikely the same species for a conserved coding gene) occurred with the sequence AY791437 of Prochilodus nigricans.
Species identification based on the assayed genes in the four considered catches, measured as the number of individuals that are unambiguously assigned to a species in GenBank (all genes) and BOLD (COI). Databases accessed in September 2013.
| COI | 12S rDNA | cyt b | D-Loop | ||
|---|---|---|---|---|---|
| GenBank | BOLD | GenBank | GenBank | GenBank | |
| Cantabric Sea | |||||
| mackerel | 10 | 10 | 10 | 10 | 10 |
| tuna | 5 | 0 | 10 | 0 | 6 |
| % catch | 75% | 50% | 100% | 50% | 80% |
| Mediterranean Sea | |||||
| anchovy | 10 | 0 | 10 | 10 | 10 |
| mackerel | 10 | 10 | 10 | 10 | 10 |
| % catch | 100% | 50% | 100% | 100% | 100% |
| Narcea River | |||||
| Atlantic salmon | 10 | 10 | 10 | 10 | 10 |
| brown trout | 10 | 0 | 10 | 10 | 10 |
| % catch | 100% | 50% | 100% | 100% | 100% |
| Amazon River | |||||
| curimatá | 10 | 0 | 10 | 10 | 10 |
| jaraquí | 0 | 0 | 10 | 0 | 10 |
| % catch | 50% | 0% | 100% | 50% | 100% |
Ambiguous or inconclusive matches between sequences in this study and reference sequences in GenBank (all sequences) and BOLD (COI). The species retrieved from each database (with maximum score for GenBank) are presented. + : Sequences for which there are > 5 entries in GenBank with a maximum score.
| GenBank | BOLD | |
|---|---|---|
| Sequences of this study | COI | |
| JN007753, 54, 59, 60, 61 | Thunnus alalunga | Thunnus alalunga, Thunnus orientalis, Thunnus obesus, Thunnus thynnus, Thunnus atlanticus |
| JN007752, 55, 56, 57, 58 | Thunnus alalunga, Thunnus thynnus | Thunnus alalunga, Thunnus orientalis, Thunnus obesus, Thunnus thynnus, Thunnus atlanticus |
| HM480814–15, JN007765–68 | Engraulis encrasicolus | Engraulis encrasicolus, Engraulis eurystole, Engraulis australis |
| HM480816, JN007762–64 | Engraulis encrasicolus | Engraulis encrasicolus, Engraulis capensis, Atherina breviceps |
| JN007788 + | Salmo trutta | Salmo trutta, Salmo ohridanus |
| JN007727 + | Prochilodus nigricans | Prochilodus nigricans, Prochilodus rubrotaeniatus |
| JN007743 + | Semaprochilodus insignis, Semaprochilodus taeniurus | Semaprochilodus insignis, Semaprochilodus taeniurus, Curimata inornata |
| cyt b | ||
| JN007677 + | Thunnus alalunga, Thunnus orientalis | |
| JN007657 + | None out of this study | |
| D-Loop | ||
| JN007604 | Thunnus albacares | |
| JN007600–02 | Thunnus alalunga, Thunnus thynnus | |
As expected, the four DNA regions exhibited different degrees of variability (Table 4). The non-coding D-Loop (58 haplotypes in total) was more variable than the two protein coding loci (31 and 27 haplotypes for cyt b and COI respectively) and the ribosomal 12S rDNA gene (15 haplotypes). The four marine species, the Amazonian jaraquí (Semiprochilodus insignis) and the north Spanish brown trout (Salmo trutta) exhibited ten different haplotypes in total considering the concatenated mitochondrial sequences analyzed. Fewer haplotypes were obtained for the Amazonian Prochilodus nigricans (6 haplotypes) and the Spanish Salmo salar (two haplotypes). In this latter species polymorphism occurred in the 12S rDNA gene, but not in the D-Loop, which was the most variable region in the other species. Overall nucleotide diversity was higher for marine than for freshwater settings for all markers as well as the concatenated sequence (Table 4). The highest Hd for both 12S rDNA and COI genes corresponded to the Amazonian samples, whereas marine catches were most variable at the less conserved cyt b and especially at the D-Loop. The least diverse Narcea River exhibited higher Hd at the highly conserved 12S rDNA than the two marine catches, due to Atlantic salmon polymorphism (likely due to a mixture of lineages remaining from past stocks transfers from North European populations; e.g.
Sequence diversity in each species. Nh, Hd and π are the number of haplotypes, haplotype diversity and nucleotide diversity, respectively.
| Locus | Parameter | Species | |||||||
|---|---|---|---|---|---|---|---|---|---|
| anchovy | mackerel (Cant.) | mackerel (Med.) | curimatá | A. salmon | brown trout | jaraquí | tuna | ||
| 12S rDNA | Nh | 2 | 1 | 2 | 2 | 2 | 2 | 3 | 1 |
| n = 380-439 | Hd | 0.2 | 0 | 0.467 | 0.467 | 0.356 | 0.356 | 0.378 | 0 |
| π | 0.052 | 0 | 0.124 | 0.123 | 0.081 | 0.081 | 0.105 | 0 | |
| COI | Nh | 2 | 4 | 5 | 4 | 1 | 2 | 3 | 6 |
| n = 605-635 | Hd | 0.2 | 0.533 | 0.8 | 0.733 | 0 | 0.556 | 0.689 | 0.778 |
| π | 0.165 | 0.265 | 1.249 | 0.154 | 0 | 0.088 | 0.136 | 0.191 | |
| cyt b | Nh | 3 | 4 | 8 | 1 | 1 | 5 | 6 | 3 |
| n = 293-322 | Hd | 0.378 | 0.533 | 0.956 | 0 | 0 | 0.822 | 0.778 | 0.689 |
| π | 0.205 | 0.273 | 1.82 | 0 | 0 | 0.469 | 0.394 | 0.88 | |
| D-Loop | Nh | 8 | 10 | 10 | 6 | 1 | 5 | 8 | 10 |
| n = 412-462 | Hd | 0.978 | 1 | 1 | 0.867 | 0 | 0.867 | 0.956 | 1 |
| π | 1.893 | 2.126 | 3.655 | 0.65 | 0 | 0.358 | 1.268 | 6.362 | |
| All coding | Nh | 4 | 6 | 10 | 5 | 2 | 8 | 8 | 7 |
| n = 1278-1396 | Hd | 0.533 | 0.778 | 1 | 0.8 | 0.356 | 0.956 | 0.956 | 0.911 |
| π | 0.141 | 0.188 | 1.048 | 0.111 | 0.025 | 0.174 | 0.186 | 0.293 | |
| All loci | Nh | 10 | 10 | 10 | 6 | 2 | 10 | 10 | 10 |
| n = 1682-1856 | Hd | 1 | 1 | 1 | 0.867 | 0.356 | 1 | 1 | 1 |
| π | 0.588 | 0.644 | 1.738 | 0.244 | 0.019 | 0.219 | 0.449 | 1.744 | |
The trade-off between using the same genetic analysis for simultaneously authenticating specimens and rapidly evaluating population diversity is that conserved species-specific sequences may not exhibit enough polymorphism. This is exemplified in Figure 1 and in the total number of variants of each marker found in this study, with 58 D-Loop versus only 15 12S rDNA haplotypes. Comparison between DNA regions for polymorphic information – measured as mean variation for each gene as in Figure 1 – yielded, despite small sample sizes, highly significant differences for all parameters when the six sequences were considered at the same time (p = 0.011, p = 0.006 and p = 0.000, for Hd, π and Nh/n, respectively). Most polymorphisms were provided by the non-coding D-Loop (Figure 1), and adding more nucleotides (concatenated sequence of all loci) did not increase significantly the level of polymorphism (p = 0.639, p = 0.109 and p = 0.428, for Hd, π and Nh/n, respectively). As expected, in relation with its length, the D-Loop was the most informative gene for quantifying diversity.
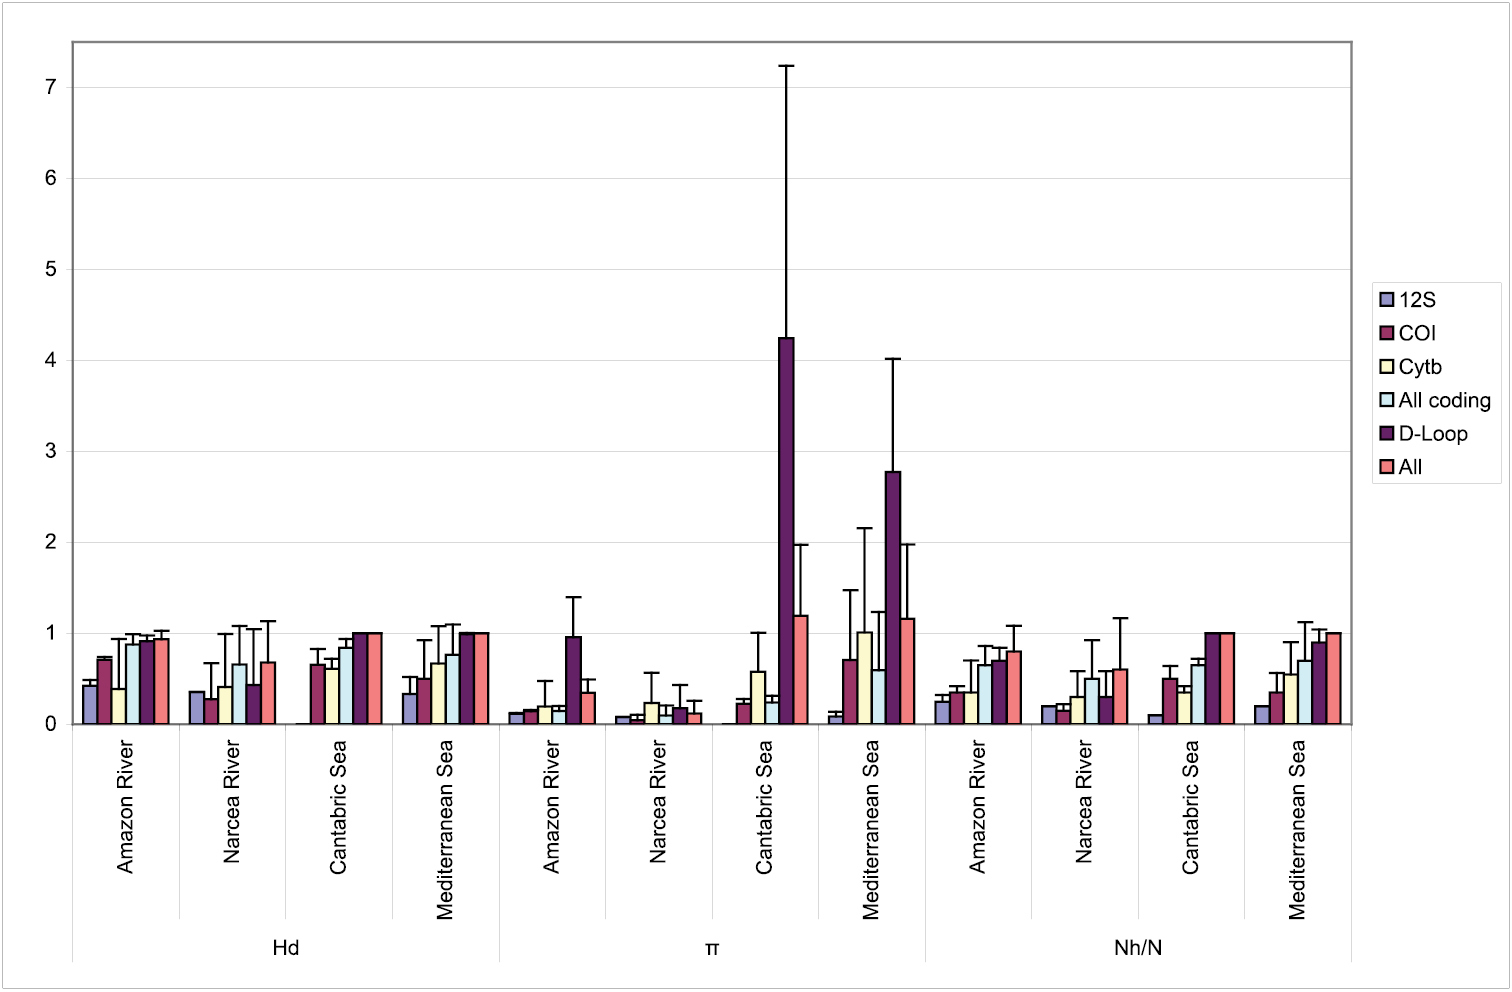
Summary of population genetic diversity retrieved fromeach mitochondrial region separately (12S rDNA, COI, cyt b, D-Loop), from the coding and from all regions concatenated (All), in the four case studies. Mean (standard deviation as vertical bars) is provided for Nh/n, Hd and π (mean number of different haplotypes per species, haplotype diversity and nucleotide diversity respectively).
The results presented in this study illustrate how genetic methodologies could be applied in practice for monitoring fish catches. They also suggest some caveats of the current databases that should be considered in order to improve their built-in tools for species identification, especially if massive sequencing is envisaged. We have found ambiguous catch identifications in several cases. This is due to the fact that some identical haplotypes (sequences) are labeled in the databases with different specific names. Duplicated names at species level are a problem well recognized in reference databases such as GenBank (e.g.
On the other hand, analyzing two DNA regions of different level of variability and recording simple polymorphism data in a database are easy actions that can be done very fast employing massive sequencing methodologies. They would hopefully allow to ascertaining the species and early detecting variation losses in catch. In a moment of stock overexploitation (
Taking into account the number of existing sequences in databases, that is essential for species identification, and the polymorphic information provided by the different mitochondrial regions examined, the use of more than one gene and preferably a combination of nuclear and mitochondrial sequences would be recommended for routine genetic monitoring of fish catches. Incorporating new sequencing technologies will speed up large-scale genetic analysis of catch.
This study has been funded by the Asturias Government, SV-PA-13-ECOEMP-41. We are grateful to three anonymous reviewers of Zookeys for useful comments on the manuscript.