ZooKeys 365: 129–147, doi: 10.3897/zookeys.365.5728
Incorporating trnH-psbA to the core DNA barcodes improves significantly species discrimination within southern African Combretaceae
Jephris Gere 1, Kowiyou Yessoufou 1,2, Barnabas H. Daru 1, Ledile T. Mankga 1, Olivier Maurin 1, Michelle van der Bank 1
1 African Centre for DNA Barcoding, Department of Botany & Plant Biotechnology, University of Johannesburg, PO Box 524, South Africa
2 C4 EcoSolutions, 9 Mohr Road Tokai, Cape Town, South Africa 7945

Corresponding author: Jephris Gere (gerejephris@gmail.com)

Academic editor: K. Jordaens

received 1 June 2013 | accepted 13 September 2013 | Published 30 December 2013


(C) 2013 Jephris Gere. This is an open access article distributed under the terms of the Creative Commons Attribution License (CC BY 4.0), which permits unrestricted use, distribution, and reproduction in any medium, provided the original author and source are credited.


For reference, use of the paginated PDF or printed version of this article is recommended.

Citation: Gere J, Yessoufou K, Daru BH, Mankga LT, Maurin O, van der Bank M (2013) Incorporating trnH-psbA to the core DNA barcodes improves significantly species discrimination within southern African Combretaceae. In: Nagy ZT, Backeljau T, De Meyer M, Jordaens K (Eds) DNA barcoding: a practical tool for fundamental and applied biodiversity research. ZooKeys 365: 127–147. doi: 10.3897/zookeys.365.5728

Abstract

Recent studies indicate that the discriminatory power of the core DNA barcodes (rbcLa + matK) for land plants may have been overestimated since their performance have been tested only on few closely related species. In this study we focused mainly on how the addition of complementary barcodes (nrITS and trnH-psbA) to the core barcodes will affect the performance of the core barcodes in discriminating closely related species from family to section levels. In general, we found that the core barcodes performed poorly compared to the various combinations tested. Using multiple criteria, we finally advocated for the use of the core + trnH-psbA as potential DNA barcode for the family Combretaceae at least in southern Africa. Our results also indicate that the success of DNA barcoding in discriminating closely related species may be related to evolutionary and possibly the biogeographic histories of the taxonomic group tested.

Keywords

DNA barcoding, closely related species, Combretaceae, southern Africa

Introduction

Combretaceae is a medium-sized family within Myrtales, comprising about 500 species in 17 to 23 genera. It has long been referred to as a complex phylogenetic and taxonomic group (Tan et al. 2002, Maurin et al. 2010, Stace 2010, Jordaan et al. 2011). Based on morphological characters and phylogenetic analysis, the family Combretaceae has been recovered as monophyletic and sister to the rest of Myrtales (Brown 1810, Dahlgren and Thorne 1984, Tan et al. 2002, Sytsma et al. 2004, Maurin et al. 2010, Stace 2010). Members of Combretaceae are mainly trees, shrubs or lianas, occupying a wide range of habitats from savannas, forests, to woodlands (Maurin et al. 2010) and are distributed in tropical and subtropical regions across the globe. With ca. 350 species, Combretum Loefl., the largest genus in the family has its centre of diversity in Africa, with approximately 63 species described in southern Africa – south of the Zambezi river and includes South Africa, Zimbabwe, Namibia, Botswana, Lesotho, Swaziland, and Mozambique (Maurin et al. 2010, Jordaan et al. 2011).

The major distinguishing feature of the family is the presence of unicellular combretaceous hairs on the abaxial leaf surfaces, a diagnostic trait in many other species of Myrtales and even beyond the group e.g. the Cistaceae Juss. family, tribe Cisteae (Maurin et al. 2010, Stace 2010). However, other morphological features such as presence of trichomes, stalked glands, domatia, inflorescence, fruit shape, leaf and pollen morphology are also important for species delimitation in Combretaceae (Exell and Stace 1966, Stace 2007, 2010, Maurin et al. 2010, Jordaan et al. 2011). Nonetheless, all these characters are not adequate enough to delimit species within the family because none is unique to a specific clade. As a result, the family has experienced several splitting and lumping in the past (El Ghazlai et al. 1998, Tan et al. 2002, Maurin et al. 2010, Stace 2010, Jordaan et al. 2011). Also, the taxonomy is further confounded by the high morphological similarity between members of different sections. For instance, inflorescence and fruit shapes are very similar between species and across clades (Figures 1 and 2). Such homoplasious morphological similarities have also been identified as the root of difficulties in delimiting the genera; for example in the Combretum-Quisqualis clade (Jordaan et al. 2011). Consequently, it becomes necessary to search for an alternative method to augment traditional morphology-based taxonomy of Combretaceae.

Figure 1.

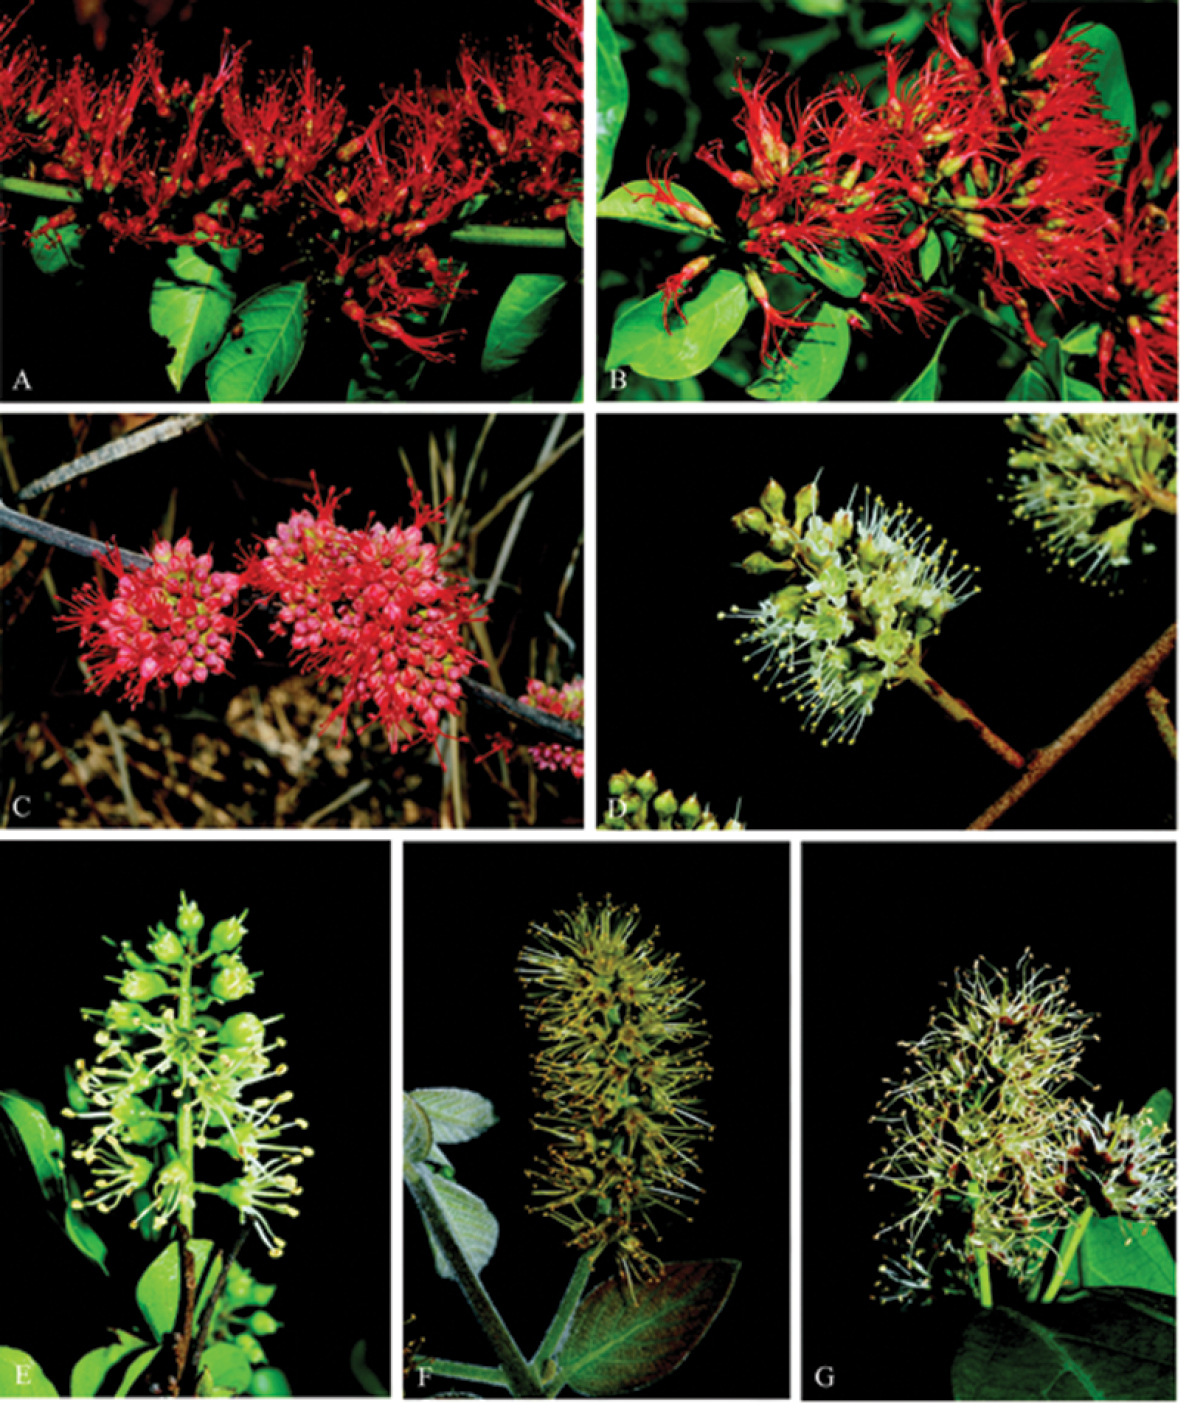
Selected inflorescences of seven Combretum species indicating closely related species evaluated based upon floral characters. A Combretum paniculatum B Combretum microphyllum C Combretum platypetalum D Combretum hereroense E Combretum apiculatum F Combretum molle G Combretum kraussii. All photographs by O. Maurin.

Figure 2.

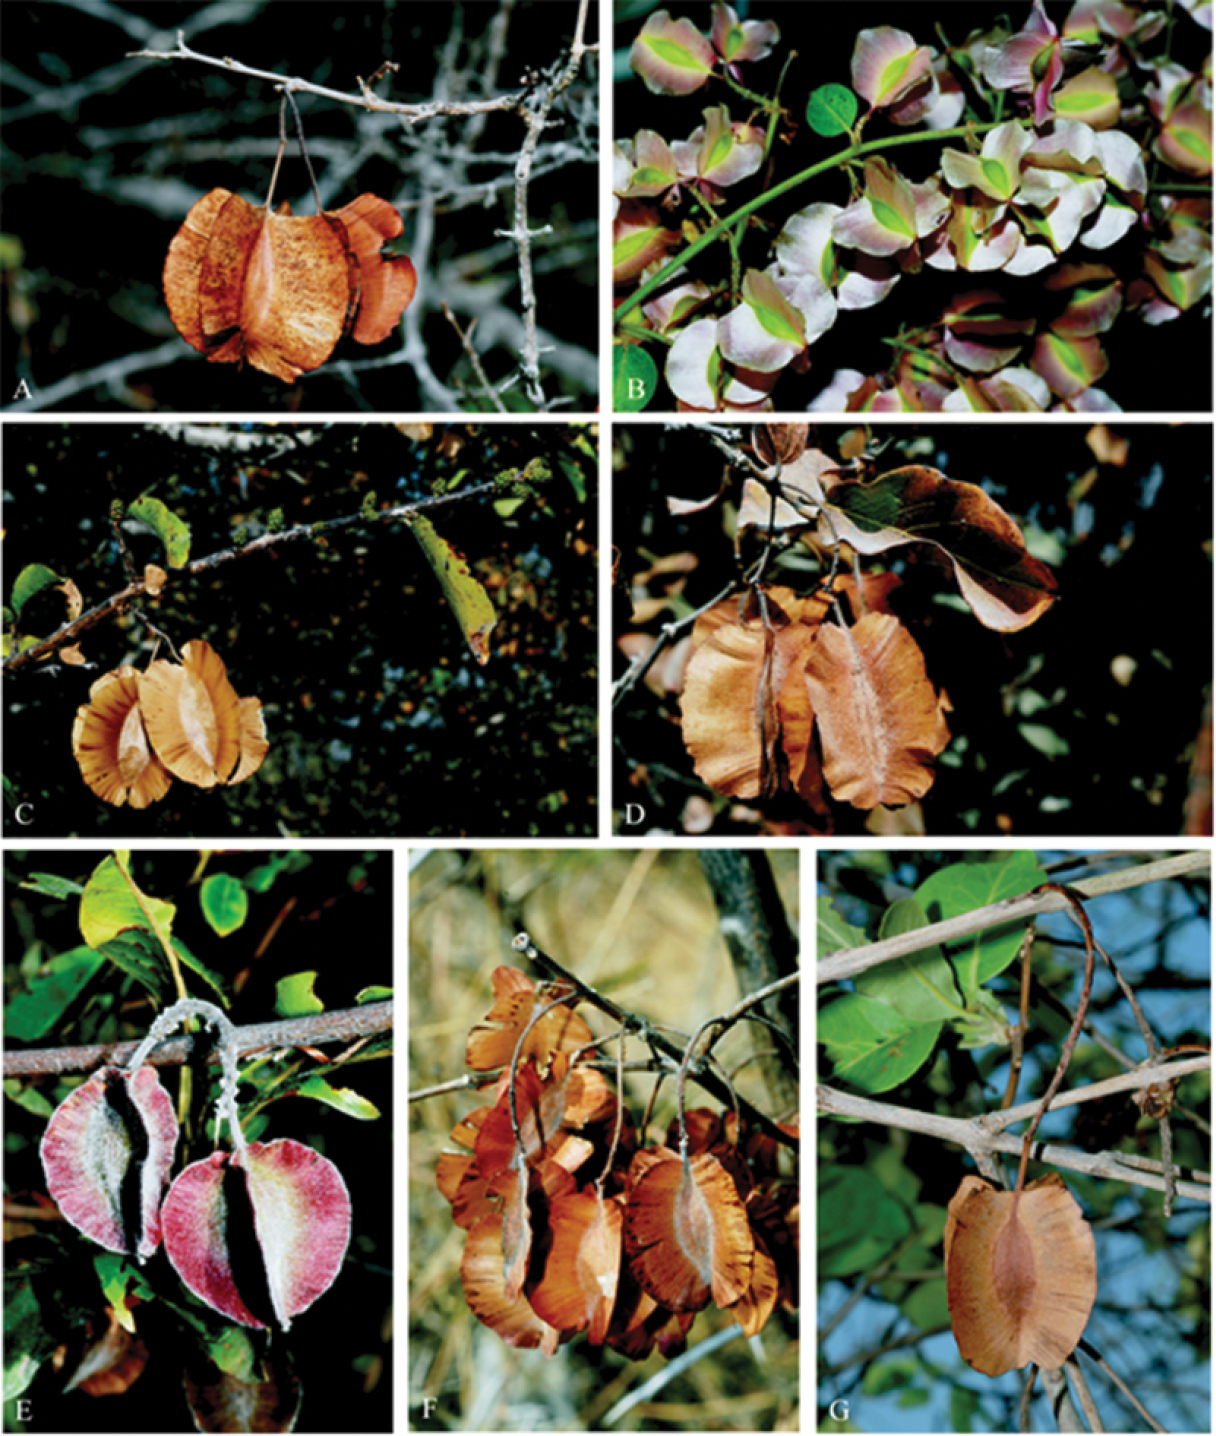
Selectedmature dry four-winged fruits of closely related species of genus Combretum. A Combretum mkuzense B Combretum microphyllum C Combretum englerii D Combretum apiculatum E Combretum moggii F Combretum albopunctatum G Combretum collinum. All photographs by O. Maurin.

Here, we propose that DNA barcoding may provide such a complementary tool to ease species delimitation within the group. DNA barcoding involves the use of a short and standardised DNA sequence that can help assign, even biological specimens devoid of diagnostic features, to species (Hebert et al. 2004, 2010, Hajibabaei et al. 2006, Roy et al. 2010, Van der Bank et al. 2012, Franzini et al. 2013). Two DNA regions defined as ‘core barcodes’, i.e. rbcLa and matK have been standardised as DNA barcodes for land plants (CBOL Plant Working Group 2009). In addition to the core barcodes, two other regions, trnH-psbA and nrITS were suggested as supplementary DNA barcodes for plants (Hollingsworth et al. 2011, Li et al. 2011). The rationale for adopting these two regions (rbcLa and matK) is high levels of recoverability of high-quality sequences and acceptable levels of species discrimination (Burgess et al. 2011). The discriminatory power of the core DNA barcodes for land plants was estimated at 70–80% (CBOL Plant Working Group 2009, Fazekas et al. 2009, Kress and Erickson 2007). However, a recent study suggests that efficacy of core barcodes may have been overestimated, arguing that taxon sampling has been biased towards less-related species (Clement and Donoghue 2012). Furthermore, barcoding efficacy is rarely evaluated in a phylogenetic context (but see Clement and Donoghue 2012), resulting in potentially biased estimates of discriminatory power.

In this study, we evaluated the efficacy of DNA barcoding as a tool to augment morphological species discrimination within Combretaceae. Specifically, we (1) assessed the potential of four markers to discriminate southern African species of the family, and (2) assessed the efficacy of barcodes across major clades including subgenera and sections within the largest genus Combretum.

Methods

Sampling includes one to six accessions of 58 species out of the 63 species representing the six genera of Combretaceae in southern Africa. These genera include Combretum (43 species included in this study), Lumnitzeria Wild. (one species included), Meiostemon Exell and Stace (one species included), and Quisqualis L. (one species included), Pteleopsis Engl. (two species included), and Terminalia (ninespecies included).

Collection details, taxonomy, voucher numbers, GPS coordinates, field pictures, and sequence data (only matK and rbcLa) are archived online on the BOLD system (www.boldsystems.org). Voucher information, name of herbarium, GenBank and BOLD accession numbers are listed in Appendix 1.

DNA extraction, amplification and alignment

Genomic DNA was extracted from silica gel-dried and herbarium leaf material following a modified cetyltrimethyl ammonium bromide (CTAB) method of Doyle and Doyle (1987). To ease the effects of high polysaccharide concentrations in the DNA samples, we added polyvinyl pyrolidone (2% PVP). Purification of samples was done using QIAquick purification columns (Qiagen, Inc, Hilden, Germany) following the manufacturer’s protocol.

All PCR reactions were carried out using Ready Master Mix (Advanced Biotechnologies, Epsom, Surrey, UK). We added 4.5% of dimethyl sulfoxide (DMSO) to the PCR reactions of nrITS to improve PCR efficiency. Amplification of rbcLa was done using the primer combination: 1F: 724R (Olmstead et al. 1992, Fay et al. 1998). For matK, the following primer combination was used 390F: 1326R (Cuénoud et al. 2002). Intergenic spacers trnH-psbA and psaA-ycf3 were amplified using the primers trnH: psbA (Sang et al. 1997) and PG1F: PG2R (Huang and Shi 2002), respectively. Intergenic spacer psaA-ycf3 was included in this study for the purpose of reconstructing phylogeny of Combretaceae. The nrITS region was amplified into two overlapping fragments using the following two pairs of internal primer combinations: 101F: 2R and 3F: 102R (White et al. 1990, Sun et al. 1994).

The following programme was used to amplify rbcLa and trnH-psbA: pre-melt at 94 °C for 60 sec, denaturation at 94 °C for 60 sec, annealing at 48 °C for 60 sec, extension at 72 °C for 60 sec (for 28 cycles), followed by a final extension at 72 °C for 7 min; for matK, the protocol consisted of pre-melt at 94 °C for 3 min, denaturation at 94 °C for 60 sec, annealing at 52 °C for 60 sec, extension at 72 °C for 2 min (for 30 cycles), final extension at 72 °C for 7 min. For nrITS and spacer psaA-ycf3 the protocol consisted of pre-melt at 94 °C for 1 min, denaturation at 94 °C for 60 sec, annealing at 48 °C for 60 sec, extension at 72 °C for 3 min (for 26 cycles), final extension at 72 °C for 7 min.

Purification of the amplified products was done using QIAquick columns (QIAgen, Germany) following the manufacturer’s manual. The purified products were then cycle-sequenced with the same primers used for amplification using BigDyeTM v3.1 Terminator Mix (Applied Biosystems, Inc, ABI, Warrington, Cheshire, UK). Cleaning of cycle-sequenced products was done using EtOH-NaCl, followed by sequencing on an ABI 3130xl genetic analyser.

Sequences were assembled, trimmed and edited using Sequencher v4.6 (Gene Codes Corp, Ann Arbor, Michigan, USA). Alignment was done using Multiple Sequence Comparison by Log-Expectation v3.8.31 (Edgar 2004) followed by subsequent manual adjustments to refine alignments.

Data analysis

Performance of DNA markers in species delimitation was tested at three taxonomic levels (family, subgenus, and section). At family level, we evaluated four single markers: rbcLa, matK, trnH-psbA, and nrITS. We also tested the core barcodes, i.e. rbcLa + matK (CBOL Plant Working Group 2009) and the following combinations: core + nrITS, core + trnH-psbA, and core + trnH-psbA + nrITS. Four criteria were used to assess their barcoding potential: presence of ‘barcode gap’ (Meyer and Paulay 2005), discriminatory power, species monophyly, and PCR success rate.

Barcode gap was evaluated in two ways: (1) we compared genetic variation within species (intraspecific genetic distance) versus between species (interspecific genetic distance). This comparison was based on the mean, median, and range of both distances; (2) in addition, we also used Meier et al.’s (2008) approach of evaluating the gap comparing the smallest interspecific distance with the greatest intraspecific distance. The genetic distances were calculated using the Kimura 2-parameter (K2P) model. We also assessed the index of sequence divergence, K, for each region, measured as the mean number of substitutions between any two sequences.

The discriminatory power of DNA regions was conducted using three distance-based methods including Near Neighbour, Best Close Match (Meier et al. 2006) and the BOLD identification criteria. A good barcode should exhibit the highest rate of correct species identification by assigning the highest proportion of DNA sequences to the corresponding species names. All the sequences were labelled according to species names prior to testing. For the Best Close Match test, we determined, for each dataset (family, subgenera and sections), the optimised genetic distance suitable as threshold for species delimitation. Optimised thresholds were determined using the function “localMinima” implemented in the R package Spider v1.1-1 (Brown et al. 2012).

We also used the PCR success rate to evaluate the DNA regions. This evaluation was conducted based on the percentage of successful amplification.

The test for species monophyly was conducted on a Neighbour-Joining (NJ) tree. We considered that a species is monophyletic when all individuals of the same species cluster on the NJ phylogram that we reconstructed. As such, the best barcode should provide the highest proportion of monophyletic species. We then evaluated for each DNA region and concatenated regions, the proportion of monophyletic (i.e. correct identification) and non-monophyletic species (incorrect identification). All our analyses were conducted in the R package Spider v1.1-1 (Brown et al. 2012).

Finally, we evaluated the barcoding potential in discriminating phylogenetically deliminated clades in the phylogeny of the genus that was reconstructed based on the combination of five DNA regions (rbcL, matK, trnH-psbA, psaA-ycf3 and nrITS). The phylogeny was reconstructed based on maximum parsimony (MP) implemented in PAUP* v4.0b10 (Swofford 2002). Tree searches were conducted using heuristic searches with 1 000 random sequence additions, retaining 10 trees per replicate, with tree-bisection-reconnection (TBR) branch swapping and MulTrees in effect (saving multiple equally parsimonious trees). Based on Maurin et al. (2010) we used Strephonema mannii Hook. f. and Strephonema pseudocola A. Chev. as outgroups. Node support was assessed using bootstrap (BP) values: BP > 70% for strong support (Hillis and Bull 1993, Wilcox et al. 2002).

At subgeneric and sectional levels, we only tested the performance of core barcodes and best gene combination identified using the three criteria mentioned above (barcode gap, discriminatory power and species monophyly).

Results

The overall characteristics of single and combined DNA regions are presented in Table 1. In general, our results indicate that the ranges and mean intraspecific distances were both lower than those of interspecific distances. Among single regions, rbcLa showed the lowest interspecific distance (mean = 0.009) with nrITS exhibiting the highest genetic variation between species (mean = 0.110). For all marker combinations, the mean interspecific distances varied between 0.011 and 0.014. Assessing the index of sequence divergence K for each region, we found that nrITS showed the highest divergence (K = 21) whereas trnH-psbA exhibited the lowest divergence (K = 3). For the combined regions, K varied between 10 and 13, with an average of 10 substitutions between sequence-pairs (Table 1).

Table 1.

Statistics of all gene regions for the southern African Combretaceae included in the study.

DNA regions No. of seq Seq length K Range inter Mean inter (±SD) Range intra Mean intra (±SD) Threshold (%)
rbcLa 152 552 4 0-0.09 0.009±0.012 0-0.08 0.002±0.009 0.04
matK 133 771 6 0-0.07 0.014±0.011 0-0.02 0.002±0.004 1.10
trnH-psbA 116 1034 3 0-0.15 0.047±0.035 0-0.03 0.003±0.007 1.80
nrITS 91 821 21 0-0.21 0.110±0.045 0-0.05 0.004±0.010 1.70
rbcLa+matK 129 1323 10 0-0.78 0.012±0.009 0-0.05 0.002±0.006 1.31
rbcLa+matK+trnH-psbA 87 2358 11 0-0.04 0.012±0.007 0-0.02 0.002±0.004 0.5
rbcLa+matK+nrITS 74 2144 9 0-0.04 0.011±0.006 0-0.02 0.002±0.004 0.70
rbcLa+matK+nrITS+trnH-psbA 70 3178 13 0-0.04 0.014±0.007 0-0.02 0.002±0.004 1.17

The distribution ranges of inter- versus intraspecific distances for all regions, showed a clear overlap between both distances (Figures 3a, b and 4), indicating the existence of a barcode gap. Comparing the smaller inter- versus the largest intraspecific distances for each region, our results further support the existence of barcode gap in all regions, but the proportion of sequences with barcode gap varied significantly with the regions tested (Table 2). Notably, the combination of all four regions exhibited the highest proportion of sequences with barcode gap (84%) followed by nrITS (73%), then core + nrITS (64%), and core + trnH-psbA (57%), with the lowest proportion found in rbcLa (13%) (Table 2).

Optimised genetic distances used as threshold for species delimitation in Best Close Match method are shown in Table 1. Apart from rbcLa (threshold = 0.04%), core + trnH-psbA (threshold = 0.5%) and core + nrITS (threshold = 0.7%), the thresholds for the remaining single and gene combinations were greater than 1%.

Figure 3.

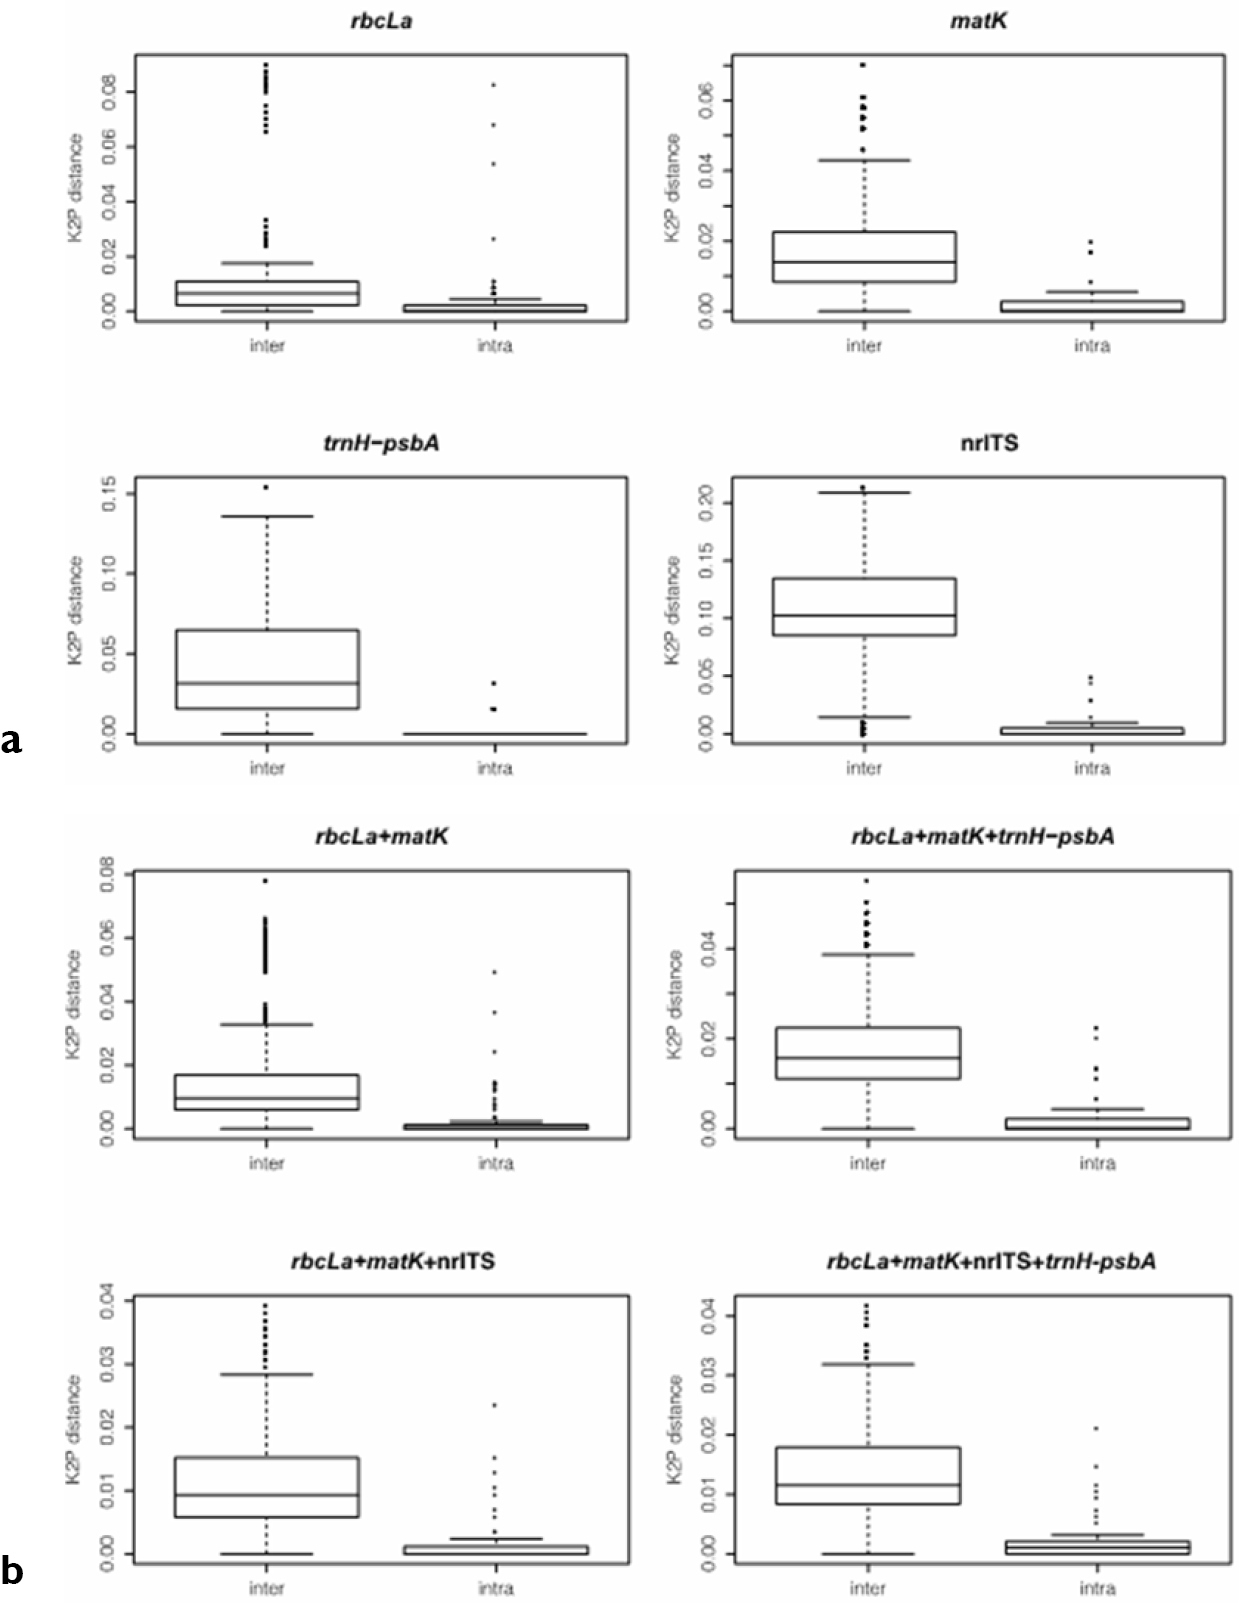
Comparisons of the distribution range of inter- versus intraspecific distances using boxplot a indicates comparison of single barcode gene regions b indicates the results of gene combinations.

Figure 4.

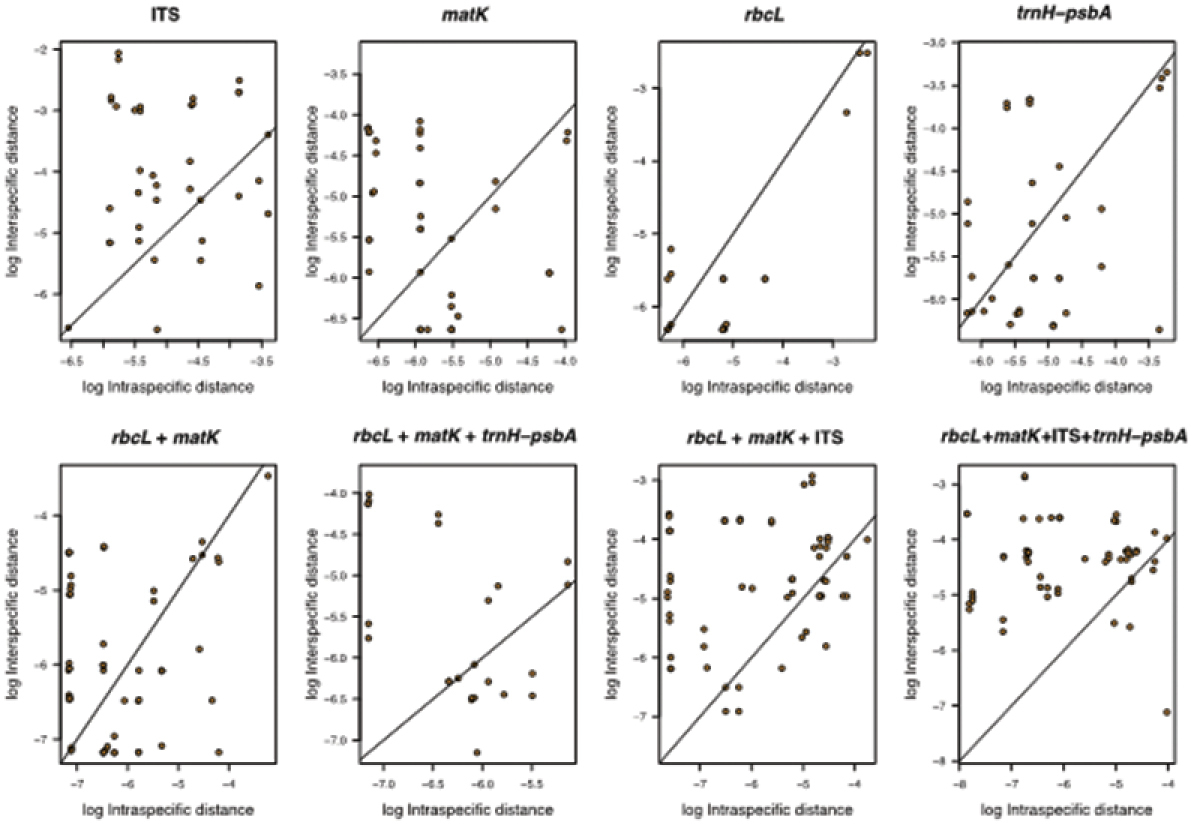
Relationships between inter- and intraspecific distances indicating barcoding gap for all regions tested.

Table 2.

Percentage barcode gap in all sequences for each region using the Meier et al. (2008) approach.

DNA region Number of sequences without gap Proportion of sequences with gap (%)
rbcLa 132 13
matK 86 35
trnH-psbA 54 53
nrITS 25 73
rbcLa+matK 82 36
rbcLa+matK+trnH-psbA 37 57
rbcLa+matK+nrITS 27 64
rbcLa+matK+nrITS+trnH-psbA 11 84

Our results for the discriminatory power analysis varied with the methods applied (Table 3) at family level. Based on the Near Neighbour method, nrITS provided the highest discriminatory power (65%) followed by rbcLa + matK + trnH-psbA + nrITS (64%), rbcLa + matK + trnH-psbA (62%), and rbcLa + matK (61%). The lowest discriminatory power was found for trnH-psbA (28%).

Table 3.

Identification efficacy of DNA barcodes using distance based methods. F = False and T = True.

DNA region Near Neighbour BOLD (1%) Best Close Match
F (%) T (%) Ambiguous (%) Correct (%) Incorrect (%) No ID (%) Ambiguous (%) Correct (%) Incorrect (%) No ID (%)
rbcLa 59 41 61 18 14 7 61 18 14 7
matK 46 54 81 11 7 1 47 38 14 1
trnH-psbA 72 28 65 22 10 3 18 60 18 4
nrITS 35 65 29 47 10 14 10 63 19 8
rbcLa+matK 39 61 86 10 2 2 35 51 12 2
rbcLa+matK+trnH-psbA 38 62 79 16 2 3 6 80 8 6
rbcLa+matK+nrITS 43 57 62 30 7 1 3 70 19 8
rbcLa+matK+nrITS+trnH-psbA 36 64 52 41 3 4 0 87 9 4

BOLD species delimitation criteria of 1% threshold provided the lowest rate of correct identification among all three methods used. However, we found that nrITS remains the most efficient region with 47% discriminatory power. The second most successful combination of regions were core + trnH-psbA + nrITS (41%) followed by core + nrITS (30%) and trnH-psbA (22%); the core barcodes were identified as the least performing regions (10%) with the highest proportion of ambiguity (86%).

In contrast to the two previous methods, the Best Close Match provided the highest rate of species discrimination for the combined dataset (core + trnH-psbA + nrITS) yielding the best discriminatory power (87%) with no ambiguity. This was followed by core + trnH-psbA (80%), core + nrITS (70%) and nrITS (63%), with the poorest performance for rbcLa (18%) at family level.

The last criterion used to evaluate the potential of DNA region was PCR efficiency. We found that rbcLa (87%) followed by trnH-psbA (85%) and matK (68%) were easy to amplify, with nrITS being the most difficult (47%; Figure 5).

Figure 5.

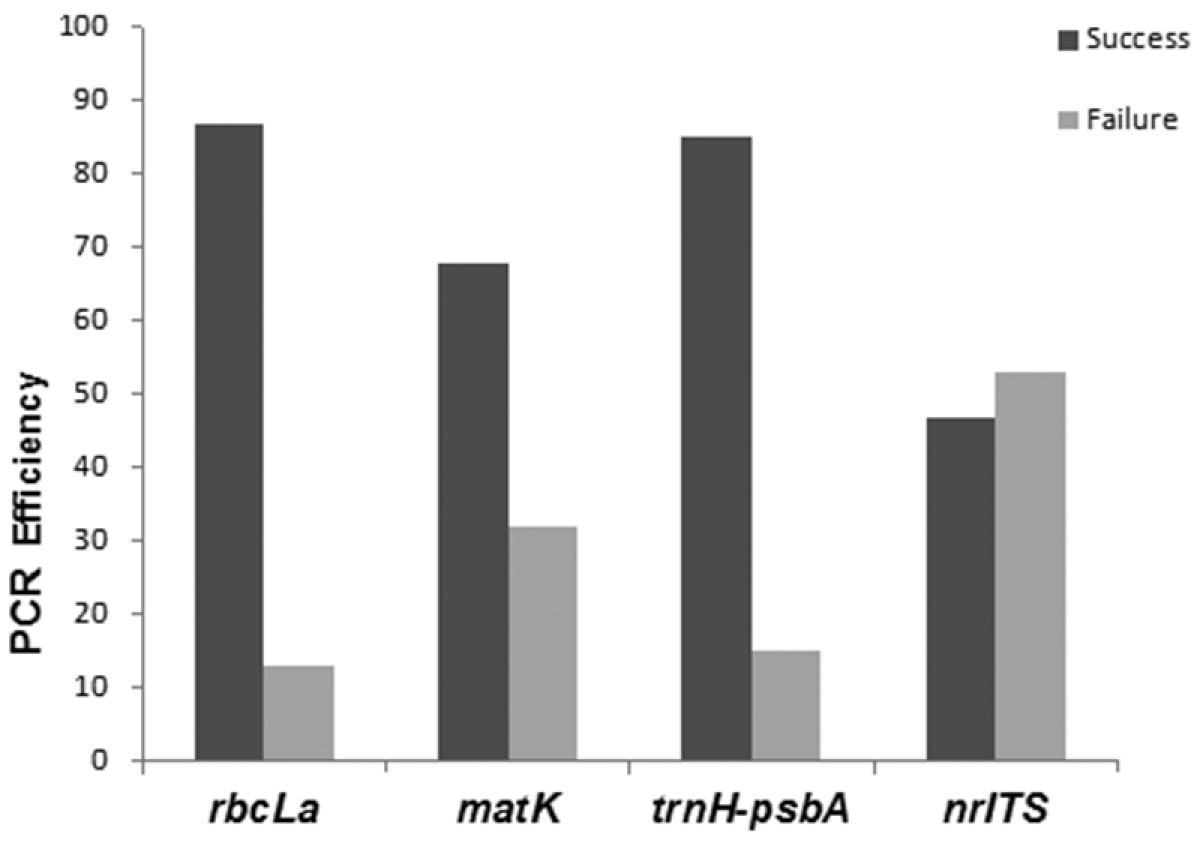
PCR efficiency for the four candidate barcodes (rbcLa, matK, trnH-psbA, nrITS).

We complemented previous analyses using species monophyly criteria after verifying the monophyly of Combretaceae. Among all regions, core + trnH-psbA isolated the highest proportion of monophyletic species (83%), followed by trnH-psbA (78%), nrITS (76%), and combination of all four regions (65%). Again, rbcLa provided the lowest performance in identifying species as monophyletic (37%; Figure 6).

Figure 6.

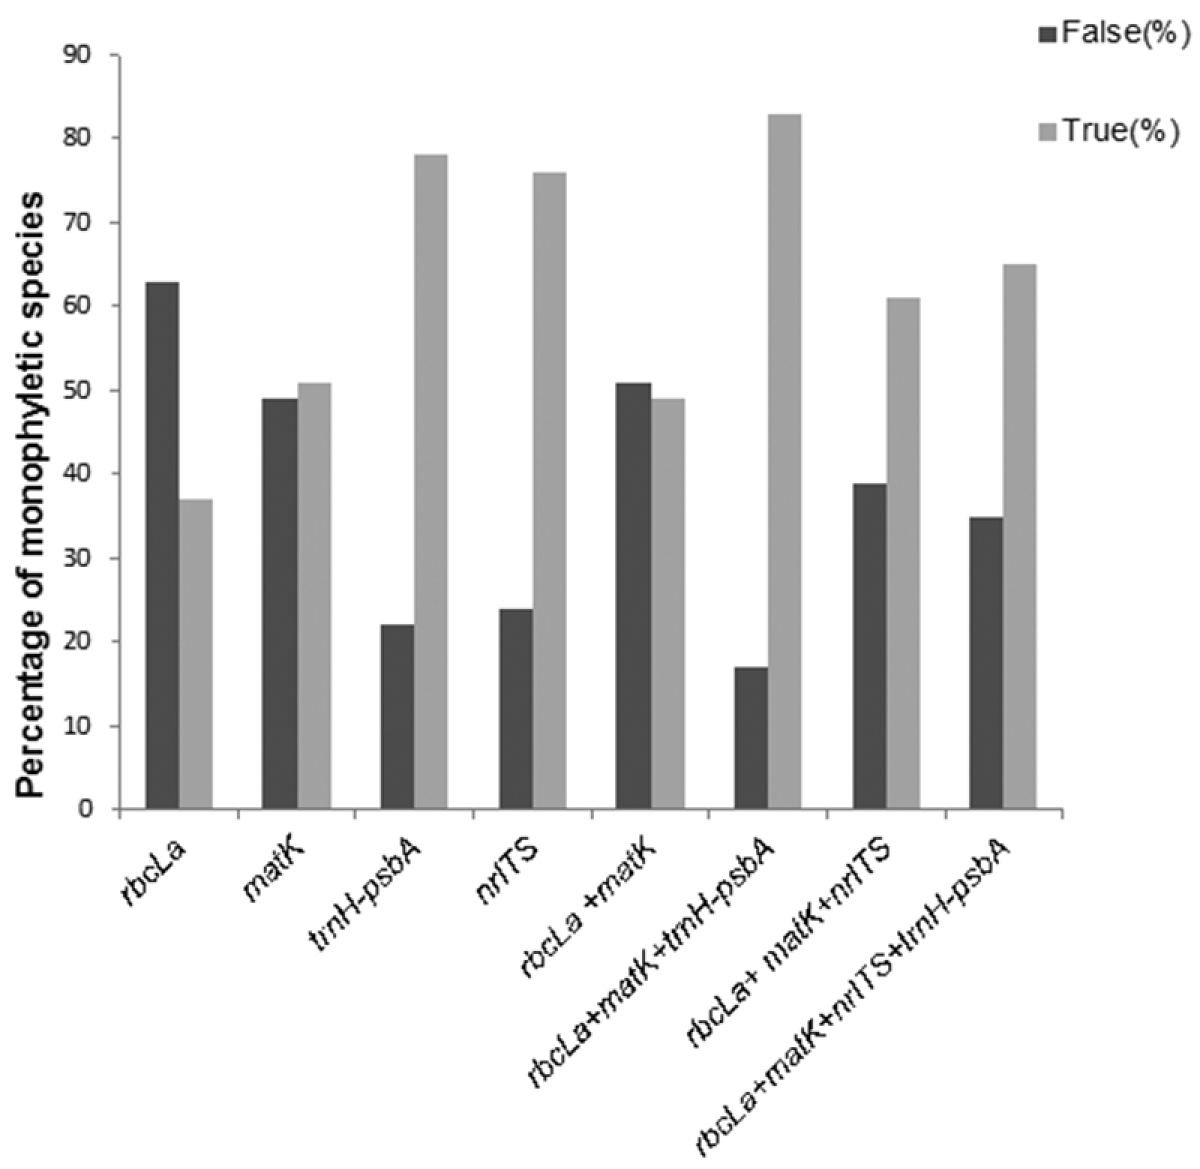
Gene performance based on monophyly criteria. False = proportion of non-monophyletic species; True = proportion of monophyletic species.

In summary, all regions provided evidence for barcode gaps (Figure 3a, b and 4), but the strength of evidence varied with approaches used. Furthermore, the Best Close Match method provided the highest identification accuracy among the three distance-based methods used irrespective of genes or combinations tested. Under this method, the two best potential barcodes for southern African Combretaceae were first, core+ trnH-psbA and second, core + trnH-psbA + nrITS. However, based on species monophyly criteria, the single region trnH-psbA and the combination core + trnH-psbA showed high barcode potential, with trnH-psbA being the second best easy-to-amplify region after rbcLa.

We further evaluated the potential of each region as candidate barcode using a phylogeny of southern African Combretaceae (Appendix 2). Our results are congruent to the corresponding subset in the most recent and largest phylogeny assembled for the family (Appendix 3). Our evaluation for the discriminatory power at subgeneric level using the thresholds determined for the family (1.31% for the core and 0.5% for the core + trnH-psbA) revealed that the core barcodes alone were able to correctly identify 78% of species within the subgenus Cacoucia. However, the core barcodes could discriminate only 50% of species within the subgenus Combretum. In particular, the discriminatory power of the core barcodes within both subgenera increased markedly to 100% when we added the trnH-psbA region (Table 4). This trend was consistent even when we applied the thresholds that have been optimised for the subgenera.

At sectional level, we observed similar trends – the addition of trnH-psbA increased the performances of the core barcodes drastically except for Macrostigmatea (Table 5): Angustimarginata (core: 11%; core + trnH-psbA: 86%); Ciliatipetala (core: 55%; core + trnH-psbA: 73%); Conniventia (core: 38%; core + trnH-psbA: 88%); Hypocrateropsis (core: 63%; core + trnH-psbA: 80%). However, Macrostigmatea (core 34%, core + trnH-psbA 44%) showed the least performance, even with the addition of trnH-psbA to the core barcode, with just 10% increment being observed. This trend is not sensitive to the thresholds applied for the family or the sections.

Table 4.

Comparisons of efficacy of core barcodes and best barcode within subgenera Combretum and Cacoucia.

Subgenus DNA region No. of seq Mean Inter (±SD) Threshold (%) Best Close Match
Ambiguous (%) Correct (%) Incorrect (%) No ID (%)
Cacoucia rbcLa+matK 23 0.004±0.002 1.31 13 78 9 0
rbcLa+matK+trnH-psbA 16 0.006±0.002 0.5 0 100 0 0
Combretum rbcLa+matK 84 0.009±0.009 1.31 36 50 12 2
rbcLa+matK+trnH-psbA 16 0.006±0.002 0.5 0 100 0 0
Table 5.

Comparisons of core barcodes and the best barcode within five sections of the subgenera Combretum and Cacoucia.

Sections DNA regions No. of seq Mean inter (±SD) Threshold (%) Best Close Match
Ambiguous (%) Correct (%) Incorrect (%) No ID (%)
Angustimarginata rbcLa+matK 19 0.007±0.014 2.6 58 11 26 5
rbcLa+matK+trnH-psbA 15 0.006±0.006 0.7 0 86 7 7
Ciliatipetala rbcLa+matK 20 0.004±0.002 0.3 45 55 0 0
rbcLa+matK+trnH-psbA 15 0.006±0.003 0.5 0 73 27 0
Conniventia rbcLa+matK 8 0.005±0.004 0.8 37 38 12 13
rbcLa+matK+trnH-psbA 8 0.010±0.006 2.4 0 88 12 0
Hypocrateropsis rbcLa+matK 8 0.012±0.005 1.31 25 63 12 0
rbcLa+matK+trnH-psbA 5 0.020±0.004 0.8 0 80 20 0
Macrostigmatea rbcLa+matK 15 0.002±0.001 0.1 53 34 13 0
rbcLa+matK+trnH-psbA 9 0.003±0.002 0.2 0 44 56 0

(Only sections with at least three different species are included).


Finally, we compared the mean number of substitutions between any two species within each section. We found that the mean number of substitutions between representatives of Macrostigmatea is lowest (mean = 4) whereas it ranges between 5 and 19 substitutions in other sections of subgenus Combretum.

Discussion

We evaluated genetic variation for both single and various combinations of rbcLa, matK, trnH-psbA and nrITS. Comparing ranges of intra- versus interspecific distances, our results indicate that all markers show a barcode gap (Meyer and Paulay 2005); and this is also true for the stringent Meier et al.’s (2008) approach, although the proportion of sequences with gap varies greatly with the marker used.

The discriminatory power of the DNA regions in species identification also varies with the distance-based methods applied. From the methods tested, Near Neighbour and Best Close Match yielded high performance, with the latter giving the best results for the possible three and four different gene combinations. The core barcodes were not recognised among the three best options, and its discriminatory power has been questioned in a number of studies (Hollingsworth et al. 2009, Pettengill and Neel 2010, Roy et al. 2010, Wang et al. 2010, Clement and Donoghue 2012). Based on all three distance methods, nrITS emerges as the most suitable single region (as indicated under both Near Neighbour and BOLD; see also Kress et al. 2005, Kress and Erickson 2007, Chen et al. 2010, Gao et al. 2010, Ren et al. 2010, China Plant BOL Group et al. 2011, Muellner et al. 2011, Pang et al. 2011, Wang et al. 2011, Liu et al. 2012, Yang et al. 2012). Among combined regions, core + nrITS + trnH-psbA (under Best Close Match) emerges as most suitable for barcoding Combretaceae.

However, our study indicates some important drawbacks that discount the inclusion of nrITS as a good barcode. For example, based on amplification success criteria, nrITS was the most difficult of all regions tested with rbcLa and trnH-psbA being the easiest regions to amplify. The technical hurdles in PCR amplification and sequencing of nrITS may be linked to the presence of retro-transposons and other repetitive elements within plant nuclear genomes, resulting in paralogous gene copies (Gao et al. 2010, Hollingsworth 2011, Hollingsworth et al. 2011, Li et al. 2011). This is likely the case for nrITS in Combretaceae as we found evidence of multiple copies that may not be identical to each other (see CBOL Plant Working Group 2009, Hollingsworth 2011, Hollingsworth et al. 2011, Yang and Berry 2011). As such, the addition of trnH-psbA to the core barcodes (rbcLa + matK + trnH-psbA) emerge as the best gene combination useful for species discovery and delimitation in Combretaceae (see also Newmaster and Ragupathy 2009, Petit and Excoffier 2009, Ragupathy et al. 2009, Wang et al. 2009, Arca et al. 2012).

Previous studies have shown that core barcodes are very limited in discriminating taxa that are phylogenetically closely related, and suggested that the efficacy of DNA barcodes should be tested within a phylogenetic context (Clement and Donoghue 2012). We tested this using subgenera and sections of the family Combretaceae. Our evaluation of the discriminatory power of the core barcodes at subgeneric level revealed a striking difference in the performance between the two Combretum subgenera, Combretum and Cacoucia. The difference noted for the discriminatory power of the core barcodes between the two subgenera may reflect differences in their evolutionary history. Indeed, the latest dated phylogeny of Combretaceae indicated that members of the subgenus Cacoucia are represented with longer terminal branches than those in subgenus Combretum (Maurin 2009).

While we found poor performance at sectional level, for example, in Angustimarginata, Macrostigmatea and Conniventia, this result is not unexpected due to a very low genetic variation one could expect within clades (see Ennos et al. 2005, Clement and Donoghue 2012). However, the addition of trnH-psbA to the core barcodes results in a drastic increase of identification rate at both subgenus and sectional levels, validating the utility of trnH-psbA to discriminate even closely related species, except for section Macrostigmatea (Newmaster and Ragupathy 2009, Petit and Excoffier 2009, Ragupathy et al. 2009, Wang et al. 2009, but see Zhang et al. 2012, Arca et al. 2012, Clement and Donoghue 2012).

The result for section Macrostigmatea reflects earlier tangle cited in previous studies regarding its composition (Stace 1980, Maurin et al. 2010, Jordaan et al. 2011). In our analysis, we included Spathulipetala within section Macrostigmatea based on suggestions from recent molecular evidence (Maurin et al. 2010). Morphological studies separate these two sections, Spathulipetala and Macrostigmatea (Stace 1980, Jordaan et al. 2011). Section Spathulipetala comprises two members, Combretum zeyheri Sond. and Combretum mkuzense J.D.Carr and Retief, which occur in the same geographical location and show close morphological similarity in their fruits (Jordaan et al. 2011). The inclusion of Combretum mkuzense, in this section has been controversial, with some authors (Exell 1978, Stace 1980) advocating for a tentative placement pending further investigation. However, recent molecular study shows close relationship between these two species (Combretum zeyheri and Combretum mkuzense) (Maurin et al. 2010), which gives support to earlier morphological treatment. On the other hand, the taxonomy of section Macrostigmatea appears to pose fewer challenges as compared to Spathulipetala. A recent molecular study (Maurin et al. 2010) suggests lumping of these two sections, Spathulipetala and Macrostigmatea as members appear embedded in one clade with a high bootstrap support of 100%. Earlier, Exell (1978) had reported that the sections are closely related, as they share similarities in scale size, scale fragmentation into fruit walls and fruit size.

Based on our results, the unclear taxonomy reported for section Macrostigmatea, is reflected, indicating a need for further molecular analyses involving more taxa and gene sequences to correctly determinemembers of this section. Our results also support the proposal of Exell (1978) to lump these two sections. The low performance of the core + trnH-psbA in fully discriminating the different species within this section is a strong indicator of the close phylogenetic similarity of the species. Our results indicate not only the utility of DNA barcoding data for discriminating species, but also to detect species that require further molecular analyses.

Conclusions

Our analysis indicates that the poor performance of the core barcodes at family level could not be generalised to lower levels: the core barcodes perform poorly in some sections but shows strong discriminatory power in others. Such findings may indicate that the success of DNA barcodes in discriminating closely related species at least in plants may correlate with the evolutionary distinctiveness of the group tested and, as recently indicated, (see Clement and Donoghue 2012) it may also possibly reflects different biogeographic history between clades of the taxonomic group Combretaceae. Overall, we propose the core + trnH-psbA as the best barcode for the family Combretaceae.

Acknowledgements

We thank the Government of Canada through Genome Canada and the Ontario Genomics Institute (2008-OGI-ICI-03), The International Development Research Centre (IDRC), Canada and the University of Johannesburg for financial support and various local and international authorities granting us plant collections permits. We thank three anonymous reviewers for providing valuable comments on an earlier draft of the manuscript.

References
Arca M, Hinsinger DD, Cruaud C, Tillier Bousquet J, Frascaria-Lacoste N (2012) Deciduous Trees and the Application of Universal DNA Barcodes: A Case Study on the Circumpolar Fraxinus. PLoS ONE 7: e34089. doi: 10.1371/journal.pone.0034089
Brown R (1810) Prodromius florae novae liollandiae et insulae van Diemen J. Johnson and Company London.
Brown SDJ, Collins RA, Boyer S, Lefort MC, Malumbres-Olarte J, Vink CJ (2012) Spider: An R package for the analysis of species identity and evolution, with particular reference to DNA barcoding. Molecular Ecology Resources 12: 562-565. doi: 10.1111/j.1755-0998.2011.03108.x
Burgess KS, Fazekas AJ, Kesanakurti PR, Graham SW, Husband BC, Newmaster SG, Percy DM, Hajibabaei M, Barrett SCH (2011) Discriminating plant species in a local temperate flora using the rbcL plus matK DNA barcode. Methods of Ecology and Evolution 2: 333-340. doi: 10.1111/j.2041-210X.2011.00092.x
CBOL Plant Working Group (2009) A DNA Barcode for land plants. Proceedings of the National Academy of Sciences of the USA 106: 12794-12797. doi: 10.1073/pnas.0905845106
Chen SL, Yao H, Han JP, Liu C, Song JY, Shi L, Zhu Y, Ma X, Gao T, Pang X, Luo K, Li Y, Li X, Jia X, Lin Y, Leo C (2010) Validation of the ITS2 region as a novel DNA barcode for identifying medicinal plant species. PLoS ONE 5: e8613. doi: 10.1371/journal.pone.0008613
China Plant BOL Group, Li DZ, Gao LM, Li HT, Wang H, Ge XJ, Liu JQ, Chen ZD, Zhou SL, Chen SL, Yang JB, Fu CX, Zeng CX, Yang HF, Zhu YJ, Sun YS, Chen SY, Zhao L, Wang K, Yang T, Duan GW (2011) Comparative analysis of a large dataset indicates that internal transcribed spacer (ITS) should be incorporated into the core barcode for seed plants. Proceedings of the National Academy of Sciences of the USA 108: 19641-19646. doi: 10.1371/journal.pone.0008613
Clement WL, Donoghue MJ (2012) Barcoding success as a function of phylogenetic relatedness in Viburnum, a clade of woody angiosperms. BMC Evolutionary Biology 12: 73.
Cuénoud P, Savolainen V, Chatrou LW, Powell M, Grayer RJ, Chase MW (2002) Molecular phylogenetics of Caryophyllales based on nuclear 18S rDNA and plastid rbcL, atpB, and matK DNA sequences. American Journal of Botany 89: 132-144. doi: 10.3732/ajb.89.1.132
Dahlgren R, Thorne RF (1984) The Order Myrtales: Circumscription, variation, and relationships. Annals of the Missouri Botanical Garden 71: 633-699. doi: 10.2307/2399158
Doyle JJ, Doyle JL (1987) A rapid isolation procedure for small amounts of leaf tissue. Phytochemical Bulletin 19: 11-15.
Edgar R (2004) MUSCLE: Multiple sequence alignment with high accuracy and high throughput. Nucleic Acids Research 32: 1792-1797. doi: 10.1093/nar/gkh340
El Ghazlai GEB, Tsuji S, El Ghazaly G, Nilsson S (1998) Combretaceae R. Brown. World Pollen Spore Flora 21: 1-40.
Ennos RA, French GC, Hollingsworth PM (2005) Conserving taxonomic complexity. Trends in Ecology & Evolution 20: 164-168. doi: 10.1016/j.tree.2005.01.012
Exell AW (1978) Combretum. In: Launert E (Ed) Flora Zambesiaca: London. Flora Zambesiaca Managing Committee 4: 100–183.
Exell AW, Stace CA (1966) Revision of the Combretaceae. Boletim da Sociedade Broteriana 40: 5-26.
Fay MF, Bayer C, Alverson WS, De Bruijn A, Chase MW (1998) Plastid rbcL sequence data indicate a close affinity between Diegodendron and Bixa. Taxon 47: 43-50. doi: 10.2307/1224017
Fazekas AJ, Burgess KS, Kesanakurti PR, Graham SW, Newmaster SG, Husband BC (2008) Multiple multilocus DNA barcodes from the plastid genome discriminate plant species equally well. PLoS ONE 3: e2802. doi: 10.1371/journal.pone.0002802
Fazekas AJ, Kesanakurti R, Burgess KS, Percy DM, Graham SW, Barrett SCH (2009) Are plant species inherently harder to discriminate than animal species using DNA barcoding markers? Molecular Ecology Resources 9: 130–139. doi: 10.1111/j.1755-0998.2009.02652.x
Franzini PZN, Dippenaar-Schoeman AS, Yessoufou K, Van der Bank FH (2013) Combined analyses of genetic and morphological data indicate more than one species of Cyrtophora (Araneae: Araneidae) in South Africa. International Journal of Modern Biology Research 1: 21-34.
Gao T, Yao H, Song JY, Liu C, Zhu YJ, Ma X, Pang X, Xu H, Chen S (2010) Identification of medicinal plants in the family Fabaceae using a potential DNA barcode ITS2. Journal of Ethnopharmacology 130: 116-121. doi: 10.1016/j.jep.2010.04.026
Hajibabaei M, Janzen DH, Burns JM, Hallwachs W, Hebert PDN (2006) DNA barcodes distinguish species of tropical Lepidoptera. Proceedings of the National Academy of Sciences of the USA 103: 9. doi: 10.1073/pnas.0510466103
Hebert PD, Stoeckle MY, Zemlak TS, Franci CM (2004) Identification of Birds through DNA Barcodes. PLoS Biology 2: e312. doi: 10.1371/journal.pbio.0020312
Hebert PDN, DeWaard JR, Landry JF (2010) DNA barcodes for 1/1000 of the animal kingdom. Biology Letters 6: 359-362. doi: 10.1098/rsbl.2009.0848
Hillis DM, Bull JJ (1993) An empirical test of bootstrapping as a method for assessing confidence in phylogenetic analysis. Systematic Biology 42: 182-192.
Hollingsworth ML, Clark A, Forrest LL, Richardson J, Pennington RT, Long DG, Cowan R, Chase MW, Gaudeul M, Hollingsworth PM (2009) Selecting barcoding loci for plants: evaluation of seven candidate loci with species-level sampling in three divergent groups of land plants. Molecular Ecology Resources 9: 439-457. doi: 10.1111/j.1755-0998.2008.02439.x
Hollingsworth PM (2011) Refining the DNA barcode for land plants. Proceedings of the National Academy of Sciences of the USA 108: 19451-19452. doi: 10.1073/pnas.1116812108
Hollingsworth PM, Graham SW, Little DP (2011) Choosing and using a plant DNA barcode. PLoS ONE 6: e19254. doi: 10.1371/journal.pone.0019254
Huang YL, Shi SH (2002) Phylogenetics of Lythraceae sensu lato: a preliminary analysis based on chloroplast rbcL gene, psaA-ycf3 spacer and nuclear rDNA internal transcribed spacer (ITS) sequences. International Journal of Plant Sciences 163: 215-225. doi: 10.1086/338392
Jordaan M, Van Wyk AE, Maurin O (2011) Generic status of Quisqualis (Combretaceae), with notes on the taxonomy and distribution of Q. parviflora. Bothalia 41: 161-169.
Kress WJ, Erickson DL (2007) A two-locus global DNA barcode for land plants: The coding rbcL gene complements the non-coding trnH-psbA spacer region. PLoS ONE 2: e508. doi: 10.1371/journal.pone.0000508
Kress WJ, Wurdack KJ, Zimmer EA, Weigt LA, Janzen DH (2005) Use of DNA barcodes to identify flowering plants. Proceedings of the National Academy of Sciences of the USA 102: 8369-8374. doi: 10.1073/pnas.0503123102
Liu C, Shi L, Xu X, Li H, Xing H, Liang D, Jiang K, Pang X, Song J, Chen S (2012) DNA Barcode Goes Two-Dimensions: DNA QR Code Web Server. PLoS ONE 7: e35146. doi: 10.1371/journal.pone.0035146
Maurin O (2009) A phylogenetic study of the family Combretaceae with emphasis on the genus Combretum in Africa. PhD Thesis. University of Johannesburg.
Maurin O, Chase MW, Jordaan M, Van der Bank M (2010) Phylogenetic relationships of Combretaceae inferred from nuclear and plastid DNA sequence data: implications for generic classification. Botanical Journal of the Linnean Society 162: 453-476. doi: 10.1111/j.1095-8339.2010.01027.x
Maurin O, Van Wyk AE, Jordaan M, Van der Bank M (2011) A new species of Combretum section Ciliatipetala (Combretaceae) from southern Africa, with a key to the regional members of the section. South African Journal of Botany 77: 105-111. doi: 10.1016/j.sajb.2010.06.003
Meier R, Shiyang K, Vaidya G, Ng PKL (2006) DNA barcoding and taxonomy in Diptera: a tale of high intraspecific variability and low identification success. Systematic Biology 55: 715-728. doi: 10.1080/10635150600969864
Meier R, Zhang G, Ali F (2008) The use of mean instead of smallest interspecific distances exaggerates the size of the “barcoding gap” and leads to misidentification. Systematic Biology 57: 809-813. doi: 10.1080/10635150802406343
Meyer CP, Paulay G (2005) DNA barcoding: Error rates based on comprehensive sampling. PLoS Biology 3: e422. doi: 10.1371/journal.pbio.0030422
Muellner AN, Schaefer H, Lahaye R (2011) Evaluation of candidate DNA barcoding loci for economically important timber species of the mahogany family (Meliaceae). Molecular Ecology Resources 11: 450-60. doi: 10.1111/j.1755-0998.2011.02984.x
Newmaster SG, Ragupathy S (2009) Testing plant barcoding in a sister species complex of pantropical Acacia (Mimosoideae, Fabaceae). Molecular Ecology Resources 9: 172-180. doi: 10.1111/j.1755-0998.2009.02642.x
Olmstead RG, Michaels HJ, Scott KM, Palmer JD (1992) Monophyly of the Asteridae and identification of their major lineages inferred from DNA sequences of rbcL. Annals of the Missouri Botanical Garden 2: 49-265.
Pang X, Song J, Zhu Y, Xu H, Huang LF, Chen SL (2011) Applying plant DNA barcodes for Rosaceae species identification. Cladistics 27: 165-170. doi: 10.1111/j.1096-0031.2010.00328.x
Petit RJ, Excoffier L (2009) Gene flow and species delimitation. Trends in Ecology and Evololution 24: 386-393. doi: 10.1016/j.tree.2009.02.011
Pettengill JB, Neel MC (2010) An evaluation of candidate plant DNA barcodes and assignment methods in diagnosing 29 species in the genus Agalinis (Orobanchaceae). American Journal of Botany 97: 1381-1406. doi: 10.3732/ajb.0900176
Ragupathy S, Newmaster SG, Murugesan M, Balasubramaniam V (2009) DNA barcoding discriminates a new cryptic grass species revealed in an ethnobotany study by the hill tribes of the Western Ghats in southern India. Molecular Ecology Resources 9: 164-171. doi: 10.1111/j.1755-0998.2009.02641.x
Ren BQ, Xiang XG, Chen ZD (2010) Species identification of Alnus (Betulaceae) using nrDNA and cpDNA genetic markers. Molecular Ecolology Resources 10: 594-605. doi: 10.1111/j.1755-0998.2009.02815.x
Roy S, Tyagi A, Shulka V, Kumar A, Singh UM, Chaudhary LB, Datt B, Bag SK, Singh PK, Nair NK, Husain T, Tuli R (2010) Universal plant DNA barcode loci may not work in complex groups: a case study with Indian Berberis species. PLoS ONE 5: e13674. doi: 10.1371/journal.pone.0013674
Sang T, Crawford DJ, Stuessy TF (1997) Chloroplast DNA phylogeny, reticulate evolution and biogeography of Paeonia (Paeoniaceae). American Journal of Botany 84: 1120-1136. doi: 10.2307/2446155
Stace CA (1980) The significance of the leaf epidermis in the taxanomy of the Combretaceae: conclusions. Botanical Journal of the Linnean Society 81: 327-339. doi: 10.1111/j.1095-8339.1980.tb01682.x
Stace CA (2007) Combretaceae. In: Kubitzki K (Ed) The families and genera of vascular plants. Springer, Berlin, 9: 67–82.
Stace CA (2010) Combretaceae. Terminalia and Buchenavia with Abul-Ridha Alwan. New York Botanical Garden Press (Flora Neotropica Monograph) 107.
Sun Y, Skinner DZ, Liang GH, Hulbert SH (1994) Phylogenetic analysis of sorghum and related taxa using internal transcribed space of nuclear ribosomal DNA. Theoretical and Applied Genetics 89: 26-32. doi: 10.1007/BF00226978
Swofford DL (2002) PAUP*. Phylogenetic Analysis Using Parsimony (*and Other Methods). 4b10 ed. Sinauer Associates, Sunderland, Massachusetts.
Sytsma KJ, Litt AL, Zjhra ML, Pires JC, Nepokroeff M, Conti E, Walker J, Wilson PG (2004) Clades, clocks and continents: historical and biogeographical analysis of Myrtaceae, Vochysiaceae and relatives in the Southern Hemisphere. International Journal of Plant Science 165: 85-105. doi: 10.1086/421066
Tan F, Shi S, Zhong Y, Gong X, Wang Y (2002) Phylogenetic relationships of Combretoideae (Combretaceae) inferred from plastid, nuclear gene and spacer sequences. Journal of Plant Resources 115: 475-481. doi: 10.1007/s10265-002-0059-1
Van der Bank HF, Greenfield R, Daru BH, Yessoufou K (2012) DNA barcoding reveals micro-evolutionary changes and river system level phylogeographic resolution of African Silver catfish, Schilbe intermedius (Actinopterygii: Siluriformes: Schilbeidae) from seven populations across different African river systems. Acta Ichthyologica et Piscatoria 42: 307-320. doi: 10.3750/AIP2012.42.4.04
Wang Q, Yu QS, Liu JQ (2011) Are nuclear loci ideal for barcoding plants? A case study of genetic delimitation of two sister species using multiple loci and multiple intraspecific individuals. Journal of Systematics and Evolution 49: 182-188. doi: 10.1111/j.1759-6831.2011.00135.x
Wang W, Wu Y, Yan Y, Ermakova M, Kerstetter R, Messing J (2010) DNA barcoding of the Lemnaceae, a family of aquatic monocots. BMC Plant Biology 10: 205. doi: 10.1186/1471-2229-10-205
Wang Y, Tao X, Liu H, Chen X, Qiu Y (2009) A two-locus chloroplast (cp) DNA barcode for indetification of different species in Eucalyptus. Acta Horticulturae Sinica 36: 1651-1658.
White TJ, Bruns T, Lee S, Taylor J (1990) Amplification and direct sequencing of fungal ribosomal RNA genes for phylogenetics. In: Innis MA, Gelfand DH, Sninsky JJ, White TJ (Eds) PCR Protocols: a guide to methods and applications. Academic Press, New York, USA, 315-322.
Wilcox TP, Zwickl DJ, Heath TA, Hillis DM (2002) Phylogenetic relationships of the dwarf boas and a comparison of Bayesian and bootstrap measures of phylogenetic support. Molecular Phylogenetics and Evolution 25: 361-371. doi: 10.1016/S1055-7903(02)00244-0
Yang JB, Wang YP, Möller M, Gao LM, Wu D (2012) Applying plant DNA barcodes to identify species of Parnassia (Parnassiaceae). Molecular Ecology Resources 2: 267-75. doi: 10.1111/j.1755-0998.2011.03095.x
Yang Y, Berry BE (2011) Phylogenetics of the Chamaesyce clade (Euphorbia, Euphorbiaceae): Reticulate evolution and long-distance dispersal in a prominent C4 lineage. American Journal of Botany 98: 1486-1503. doi: 10.3732/ajb.1000496
Zhang CY, Wang FY, Hai-Fei Y, Gang HH, Xue CM, Jun G (2012) Testing DNA barcoding in closely related groups of Lysimachia L. (Myrsinaceae). Molecular Ecology Resources 12: 98-108. doi: 10.1111/j.1755-0998.2011.03076.x
Appendix 1

Supplementary table S1. (doi: 10.3897/zookeys.365.5728.app1) File format: Microsoft Excel file (xls).

Explanation note: Full names, voucher information, GenBank and BOLD accession numbers for taxa used in this study. A dash (—) indicates DNA regions not sampled and DNA sequences obtained from GenBank are underlined. Voucher specimens are deposited in the following herbaria: JRAU, University of Johannesburg (UJ), Johannesburg, South Africa; MO, Missouri Botanical Garden, St Louis, USA.

Appendix 2

Supplementary figure S1. (doi: 10.3897/zookeys.365.5728.app2) File format: Microsoft Word file (docx).

Explanation note: One of most parsimonious trees obtained from the combined plastid and nuclear data (rbcLa, matK, trnH-psbA, and nrITS) set. Clades highlighted indicate the sections that were identified from the MP tree obtained from barcoding gene regions. Bootstrap percentages above 50% are shown above the branches.

Appendix 3

Supplementary figure S2. (doi: 10.3897/zookeys.365.5728.app3) File format: Microsoft Word file (docx).

Explanation note: One of most parsimonious trees with branch tips collapsed from the combined plastid and nuclear data (rbcL, matK, psaA-ycf3, trnH-psbA, and nrITS) set. Clades highlighted indicate sections that were identified from the MP tree obtained from barcoding gene regions. Above the branches are Bayesian posterior probability (PP) values (> 0.5) and below are bootstrap percentages above 50%.