


(C) 2013 Kurt Jordaens. This is an open access article distributed under the terms of the Creative Commons Attribution License (CC BY 4.0), which permits unrestricted use, distribution, and reproduction in any medium, provided the original author and source are credited.
For reference, use of the paginated PDF or printed version of this article is recommended.
Citation: Jordaens K, Sonet G, Braet Y, De Meyer M, Backeljau T, Goovaerts F, Bourguignon L, Desmyter S (2013) DNA barcoding and the differentiation between North American and West European Phormia regina (Diptera, Calliphoridae, Chrysomyinae). In: Nagy ZT, Backeljau T, De Meyer M, Jordaens K (Eds) DNA barcoding: a practical tool for fundamental and applied biodiversity research. ZooKeys 365: 149–174. doi: 10.3897/zookeys.365.6202
Phormia regina (the black fly) is a common Holarctic blow fly species which serves as a primary indicator taxon to estimate minimal post mortem intervals. It is also a major research model in physiological and neurological studies on insect feeding. Previous studies have shown a sequence divergence of up to 4.3% in the mitochondrial COI gene between W European and N American P. regina populations. Here, we DNA barcoded P. regina specimens from six N American and 17 W European populations and confirmed a mean sequence divergence of ca. 4% between the populations of the two continents, while sequence divergence within each continent was a ten-fold lower. Comparable mean mtDNA sequence divergences were observed for COII (3.7%) and cyt b (5.3%), but mean divergence was lower for 16S (0.4–0.6%). Intercontinental divergence at nuclear DNA was very low (≤ 0.1% for both 28S and ITS2), and we did not detect any morphological differentiation between N American and W European specimens. Therefore, we consider the strong differentiation at COI, COII and cyt b as intraspecific mtDNA sequence divergence that should be taken into account when using P. regina in forensic casework or experimental research.
Black fly, COI, COII, cyt b, 16S, 28S, ITS2
Forensic entomology uses the larval and pupal developmental stages of insects sampled on a corpse to estimate a minimum post-mortem interval (PMImin) of the corpse (
Currently, the most popular molecular method for organismal identification is DNA barcoding, which was promoted by
The monophyly of Calliphoridae has been questioned for many years (e.g.
Taxonomy of the subfamily Chrysomyinae (family Calliphoridae) with indication of the number of DNA sequences (the number of haplotypes is given in parentheses) for each of the species used in this study (numbers combined from this study and GenBank) and for each of the gene fragments studied. No. ind. = number of individuals; No. hapl. = number of haplotypes; No. spp. = number of species.
| Genus/species | COI | COII | 16S | cyt b | ITS2 | 28S | ||
|---|---|---|---|---|---|---|---|---|
| 251 bp | 350 bp | |||||||
| Chrysomyini | Chloroprocta Wulp, 1896 | |||||||
| Chloroprocta idioidea (Robineau-Desvoidy, 1830) | 2(2) | 1(1) | 1(1) | |||||
| Chrysomya Robineau-Desvoidy, 1830 | ||||||||
| Chrysomya albiceps (Wiedemann, 1819) | 3(2) | 1(1) | 2(1) | 2(1) | ||||
| Chrysomya bezziana Villeneuve, 1914 | 5(2) | 1(1) | 10(6) | 2(1) | 2(2) | |||
| Chrysomya cabrerai Kurahashi & Salazar, 1977 | 1(1) | |||||||
| Chrysomya chani Kurahashi, 1979 | 1(1) | 11(2) | ||||||
| Chrysomya chloropyga (Wiedemann, 1818) | 1(1) | 2(2) | ||||||
| Chrysomya defixa (Walker, 1856) | 1(1) | |||||||
| Chrysomya flavifrons (Aldrich, 1925) | 3(2) | 1(1) | 4(2) | |||||
| Chrysomya greenbergi Wells & Kurahashi, 1996 | 1(1) | |||||||
| Chrysomya incisularis (Macquart, 1851) | 9(2) | 2(2) | 1(1) | |||||
| Chrysomya latifrons (Malloch, 1927) | 6(2) | 1(1) | 5(1) | |||||
| Chrysomya megacephala (Fabricius, 1794) | 79(11) | 28(7) | 66(31) | 20(3) | 2(2) | 42(3) | 4(2) | |
| Chrysomya nigripes Aubertin, 1932 | 9(7) | 3(3) | 7(1) | |||||
| Chrysomya norrisi James, 1971 | 1(1) | 1(1) | ||||||
| Chrysomya pacifica Kurahashi, 1991 | 1(1) | 1(1) | ||||||
| Chrysomya pinguis (Walker, 1858) | 7(4) | 1(1) | 14(2) | |||||
| Chrysomya putoria (Wiedemann, 1830) | 2(2) | 1(1) | 1(1) | 2(1) | ||||
| Chrysomya rufifacies (Macquart, 1843) | 25(10) | 45(9) | 10(5) | 1(1) | 14(1) | 2(2) | ||
| Chrysomya saffranea (Bigot, 1877) | 7(2) | 1(1) | 8(2) | |||||
| Chrysomya semimetallica (Malloch, 1927) | 11(5) | 3(2) | 10(2) | |||||
| Chrysomya thanomthini Kurahashi & Tumrasvin, 1977 | 1(1) | |||||||
| Chrysomya varipes (Macquart, 1851) | 7(6) | 6(2) | 1(1) | |||||
| Chrysomya villeneuvi Patton, 1922 | 7(1) | |||||||
| Cochliomyia Townsend, 1915 | ||||||||
| Cochliomyia hominivorax (Coquerel, 1858) | 78(73) | 65(62) | 2(1) | 90(24) | 2(1) | |||
| Cochliomyia macellaria (Fabricius, 1775) | 3(3) | 1(1) | 1(1) | 4(1) | ||||
| Compsomyiops Townsend, 1918 | ||||||||
| Compsomyiops calipes (Bigot, 1877) | 1(1) | 1(1) | ||||||
| Compsomyiops fulvicrura (Robineau-Desvoidy, 1830) | 1(1) | 1(1) | 1(1) | |||||
| Hemilucilia Brauer, 1895 | ||||||||
| Hemilucilia segmentaria (Fabricius, 1805) | 1(1) | 1(1) | 1(1) | |||||
| Hemilucilia semidiaphana (Rondani, 1850) | 1(1) | 1(1) | 1(1) | |||||
| Paralucilia Brauer & Bergenstamm, 1891 | ||||||||
| Paralucilia paraensis (Mello, 1969) | 1(1) | |||||||
| Trypocalliphora Peus, 1960 | ||||||||
| Trypocalliphora braueri (Hendel, 1901) | 1(1) | |||||||
| Phormiini | Phormia Robineau-Desvoidy, 1830 | |||||||
| Phormia regina (Meigen, 1826) | 48(20) | 30(9) | 15(2) | 15(2) | 17(10) | 36(2) | 38(2) | |
| Protophormia Townsend, 1908 | ||||||||
| Protophormia terraenovae (Robineau-Desvoidy, 1830) | 17(7) | 1(1) | 2(2) | 1(1) | 1(1) | 4(2) | ||
| Protocalliphora Hough, 1899 | ||||||||
| Protocalliphora azurea (Fallen, 1817) | 2(2) | 1(1) | 1(1) | 1(1) | ||||
| Protocalliphora occidentalis Whitworth, 2003 | 1(1) | |||||||
| Protocalliphora sialia Shannon & Dobroscky, 1924 | 1(1) | 1(1) | ||||||
| Protocalliphora sp. | 1(1) | |||||||
| Total no. ind. | 339 | 194 | 95 | 39 | 32 | 263 | 66 | |
| Total no. hapl. | 180 | 108 | 42 | 9 | 20 | 55 | 21 | |
| Total no. spp. | 36 | 20 | 6 | 6 | 5 | 24 | ||
Phormia regina is a highly mobile species that is abundant in North American areas with cool spring and fall temperatures and in warmer areas, but then at higher altitudes (
Because high COI sequence divergences are often indicating species level differentiation (e.g.
Sixty-one adult individuals of Phormia regina were captured at several localities in N America (Indiana, Texas, Virginia, Washington, Wyoming) and W Europe (Belgium, France, Germany) and stored in > 70% ethanol (Appendix 1 – Supplementary table 1). The individuals were qualitatively scored for the color of 11 external characters (Table 2). In addition, we dissected the male copulatory organs of five W European and five N American individuals to study the general shape of the penis, cerci and surstyli (Figure 1).
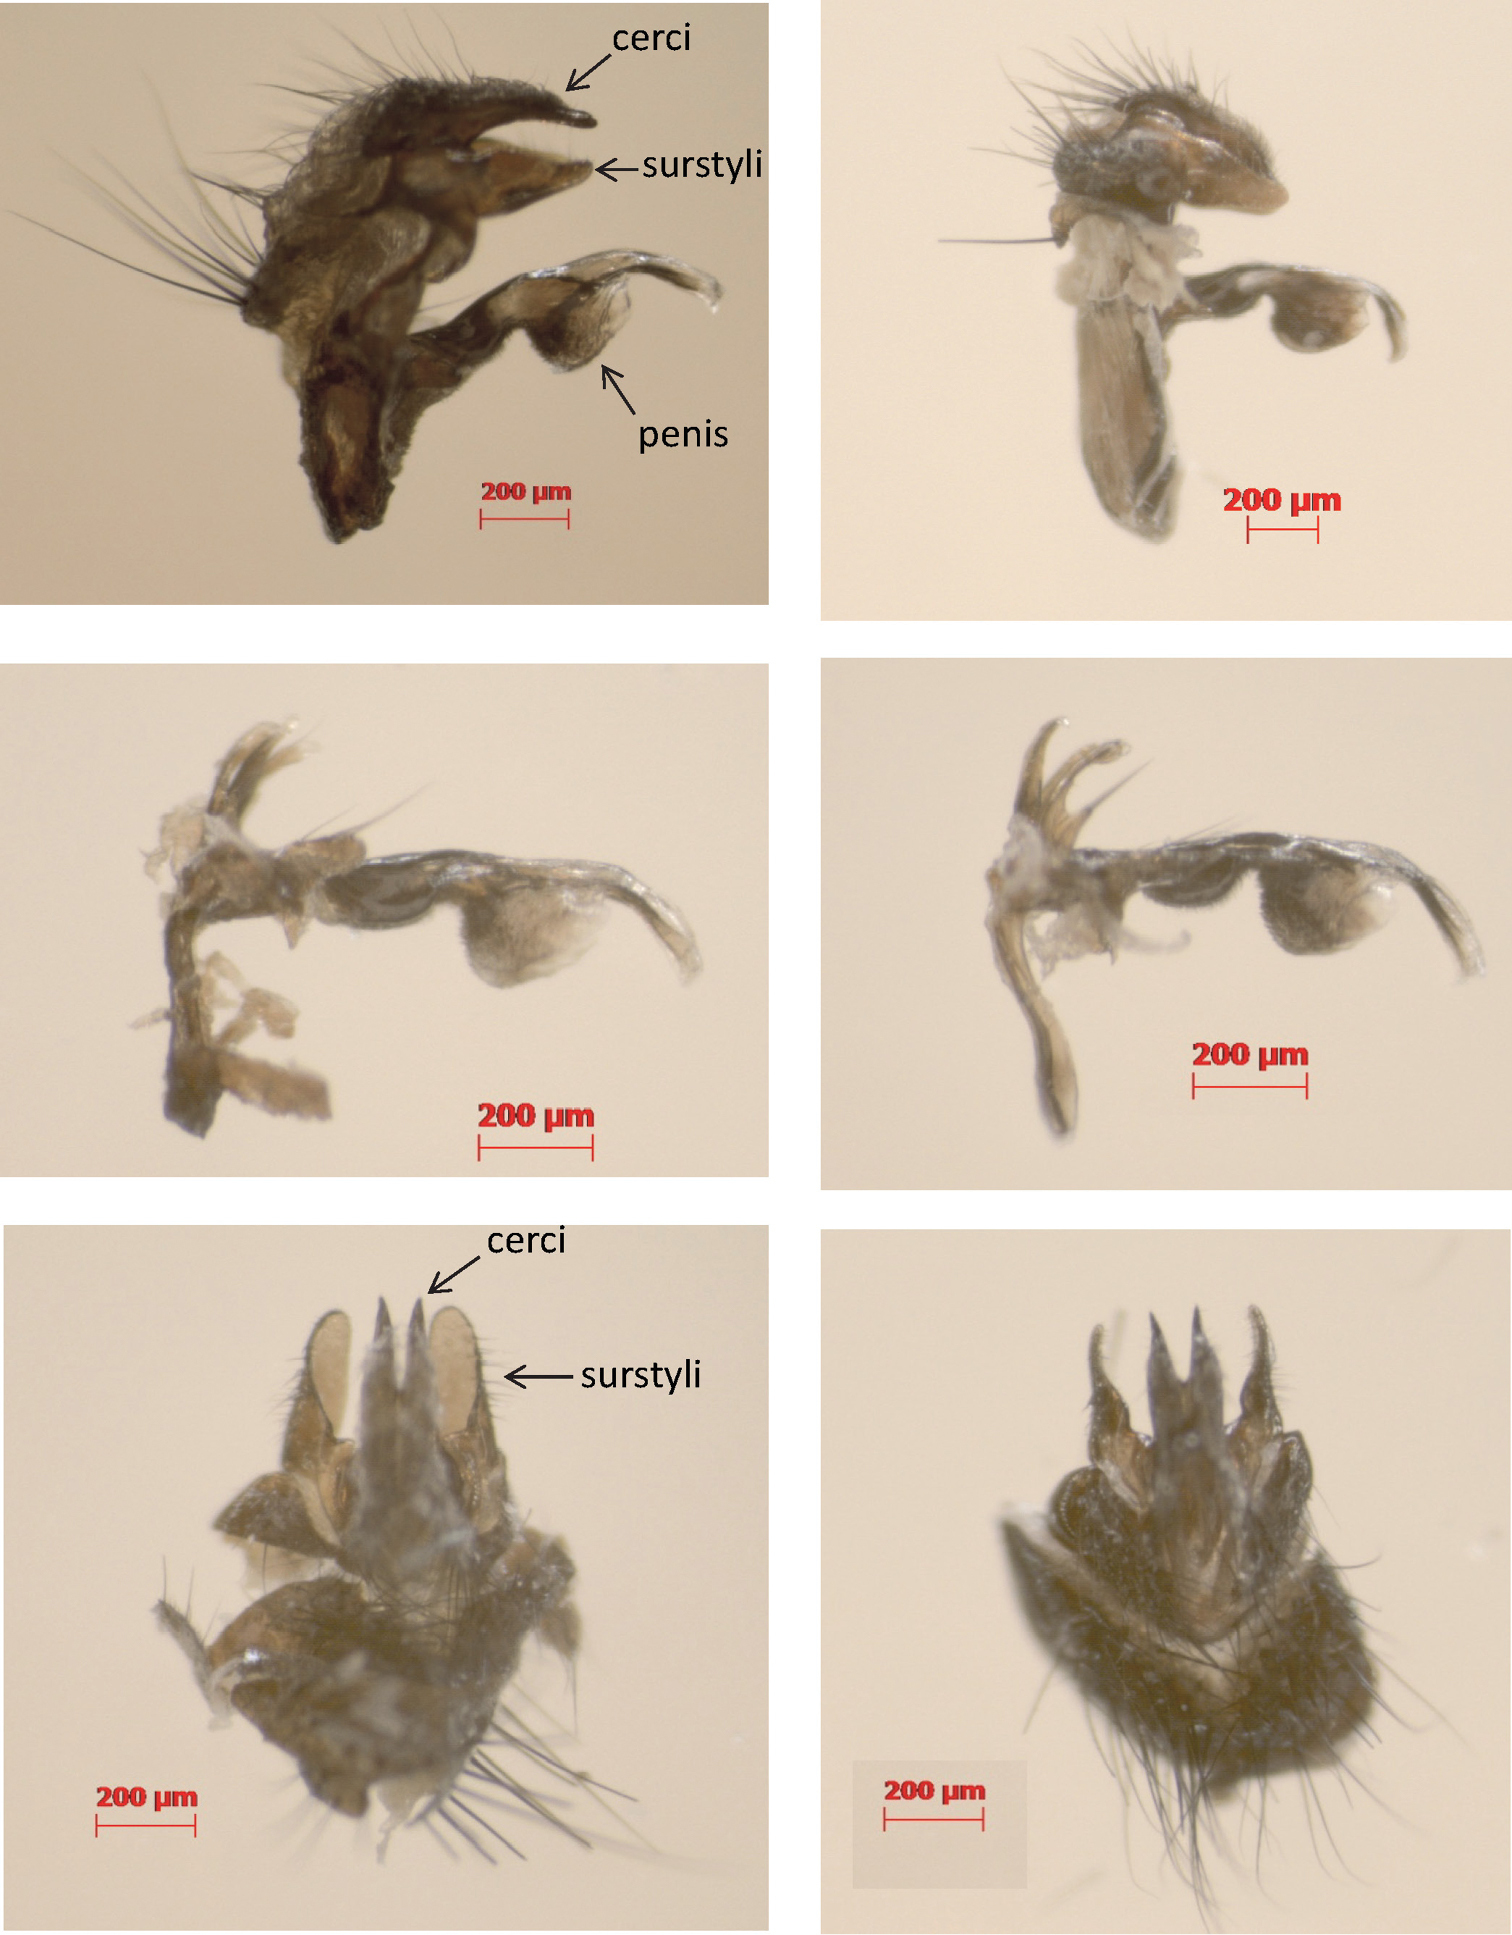
Lateral (top) and dorsal (bottom) view of the male copulatory organs of Phormia regina from W Europe (left) and N America (right) with a detail of the penis (middle).
Color scoring of eleven external morphological characters of adult W European and N American Phormia regina.
| Character | W Europe and N America |
|---|---|
| calypters | white |
| first spiraculum | white to yellow |
| thoracic dorsum | metallic green-bluish to dark green |
| scutellum | dark green |
| legs | black |
| abdomen | metallic green-bluish |
| facial ridge | red-brown |
| gena | black |
| postgena | black |
| first antennal segment | dark-brown to black |
| second antennal segment | white-grey |
DNA was extracted from on one or two legs. The remaining parts of the vouchers are kept at the NICC (National Institute of Criminalistics and Criminology – Brussels, Belgium) as pinned material. Genomic DNA was extracted using the NucleoSpin Tissue kit (Macherey-Nagel). A fragment of 721 bp from the 5’-end of the COI gene, including the standard barcode region (
Each 25 µl PCR reaction was prepared using 1 × PCR buffer, 0.2 mM dNTPs, 0.4 μM of each primer, 2.0 mM MgCl2, 0.5 U of Taq DNA polymerase (Platinum®, Invitrogen), 2–4 µl DNA template (DNA was stored in 100 µl of elution buffer) and enough mQ-H2O to complete the total PCR reaction volume. The thermal cycler program consisted of an initial denaturation step of 4 min at 94 °C, followed by 30–40 cycles of 45–60 s at 94 °C, 30–60 s at a fragment depending annealing temperature and 90 s at 72 °C; with a final extension of 7 min at 72 °C. The annealing temperatures were 45 °C for COI and COII, 48 °C for 16S and cyt b, 50 °C for ITS-2 and 55 °C for 28S. PCR products were cleaned using the NucleoFast96 PCR® kit (Macherey-Nagel) and bidirectionally sequenced on an ABI 3130 Genetic Analyzer (Applied Biosystems) using the BigDye® Terminator Cycle Sequencing Kit v3.1. Together with the Phormia regina specimens we also collected several Protophormia terraenovae specimens that were also sequenced to increase the number of material for comparison (Appendix 1 – Supplementary table 1). Sequences were assembled in SeqScape v2.5 (Applied Biosystems) and deposited in GenBank under accession numbers KF908069–KF908124 (COI), KF908126–KF908152 (COII), KF908153–KF908169 (cyt b), KF908054–KF908068 (16S), KF908170–KF908203 (ITS2), and KF908204–KF908237 (28S).
Phormiini and its sister clade Chrysomyini form the Chrysomyinae (
Description of the Phormia regina and other Chrysomyinae DNA sequences (including those retrieved from GenBank) for each of the gene fragments.
| Marker | COI | COII | 16S | cyt b | ITS2 (without indels) | 28S (without indels) | |
|---|---|---|---|---|---|---|---|
| 251 bp | 350 bp | ||||||
| Fragment size (bp) | 655 | 472 | 251 | 350 | 512 | 380 (224) | 633 (592) |
| Phormia regina | |||||||
| Total | |||||||
| No of sequences | 50 | 30 | 15 | 15 | 17 | 36 | 37 |
| No of haplotypes | 20 | 9 | 2 | 4 | 10 | 4 | 2 |
| North America (NA) | |||||||
| No of sequences | 27 | 27 | 11 | 11 | 10 | 25 | 23 |
| No of haplotypes | 14 | 7 | 1 | 3 | 7 | 1 | 2 |
| Mean intra-NA distances (%) | 0.004 | 0.004 | - | 0.004 | 0.005 | - | 0.002 |
| SE | 0.001 | 0.002 | - | 0.003 | 0.002 | - | 0.002 |
| min. – max. | 0.002–0.008 | 0.002–0.006 | - | 0.003–0.006 | 0.002–0.008 | - | 0.002 |
| Europe (EU) | |||||||
| No of sequences | 23 | 3 | 4 | 4 | 7 | 11 | 14 |
| No of haplotypes | 6 | 2 | 1 | 1 | 3 | 4(2) | 1 |
| Mean intra-EU distances (%) | 0.003 | 0.002 | - | - | 0.002 | 0.002 | - |
| SE | 0.001 | 0.002 | - | - | 0.007 | 0.002 | - |
| min. – max. | 0.002–0.008 | 0.002 | - | - | 0.002–0.010 | 0.002 | - |
| Mean p-distance between NA and EU | 0.04 | 0.037 | 0.004 | 0.006 | 0.053 | 0.001 | 0.001 |
| SE | 0.007 | 0.008 | - | 0.003 | 0.009 | 0.001 | 0.001 |
| min. – max. | 0.036–0.044 | 0.034–0.042 | 0.004 | 0.005–0.009 | 0.047–0.061 | 0–0.004 | 0–0.002 |
| Other Chrysomyinae | |||||||
| Mean intraspecific p-distance | 0.005 | 0.014 | 0.028 | 0.014 | 0.003 | 0.008 | 0.003 |
| SE | 0.009 | 0.014 | 0.009 | - | 0.002 | 0.005 | 0.004 |
| min. – max. | 0–0.042 | 0–0.037 | 0.018–0.036 | 0.014 | 0.002–0.005 | 0.004–0.015 | 0–0.010 |
| Mean interspecific p-distance | 0.066 | 0.046 | 0.038 | 0.023 | 0.079 | 0.085 | 0.007 |
| SE | 0.005 | 0.005 | 0.006 | 0.004 | 0.007 | 0.011 | 0.002 |
| min. – max. | 0.011–0.113 | 0.002–0.135 | 0.03–0.075 | 0.023–0.057 | 0.073–0.141 | 0.009–0.166 | 0–0.015 |
We did not detect morphological differences between N American and W European Phormia regina specimens in the 11 external color characters that we scored (Table 2). Also the male copulatory organs of W European and N American Phormia regina specimens were indistinguishable (Figure 1).
Basic information of the different datasets can be found in Table 3. There was only high bootstrap support for the monophyly of Chrysomyinae, Phormiini or Chrysomyini with 28S and a sister group relationship of Phormia regina and Protophormia terraenovae with ITS2. Yet, for all fragments, except for 28S, there was high bootstrap support for the monophyly of Phormia regina (Figures 2–4 and Appendix 1 – Supplementary figures 1–3).
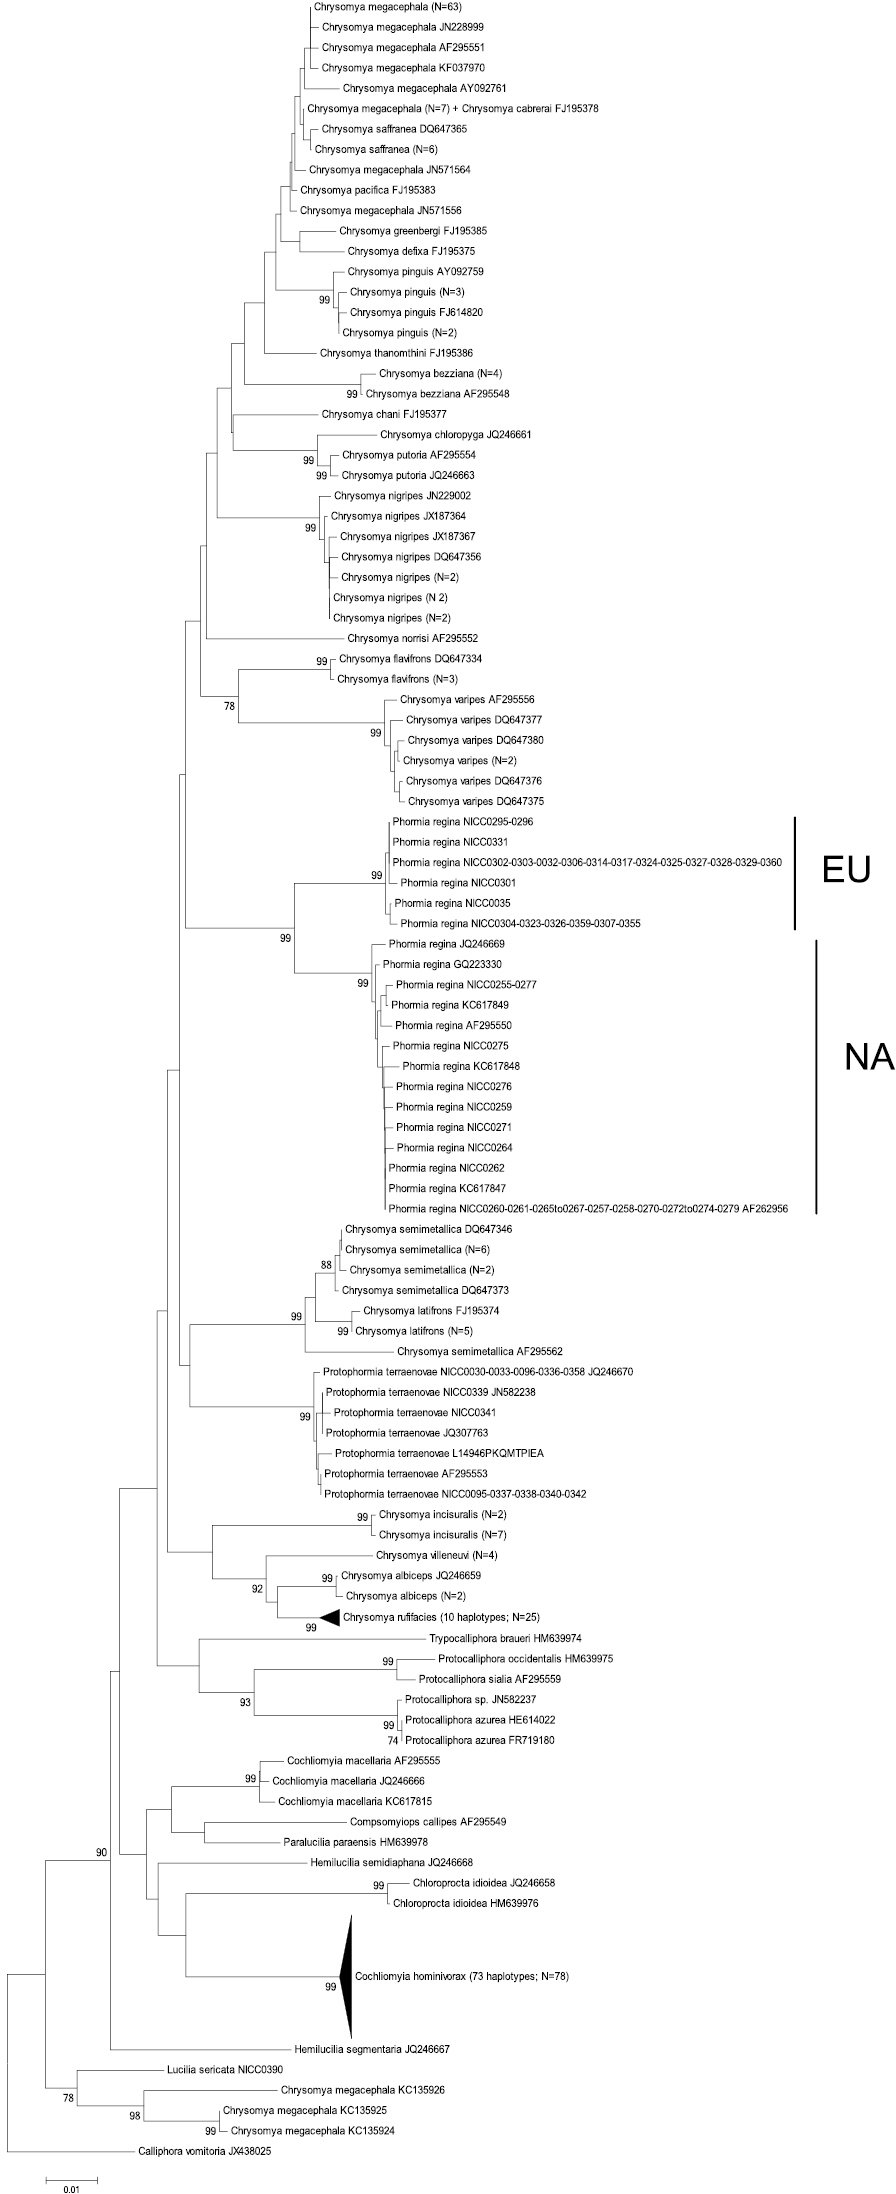
Neighbour-Joining tree (p-distances) of a 655 bp fragment of the mitochondrial cytochrome c oxidase subunit I (COI) gene. Bootstrap values ≥ 70% are shown at the nodes. N gives the number of specimens of that haplotype. EU = Phormia regina haplotypes from W Europe; NA = Phormia regina haplotypes from N America.
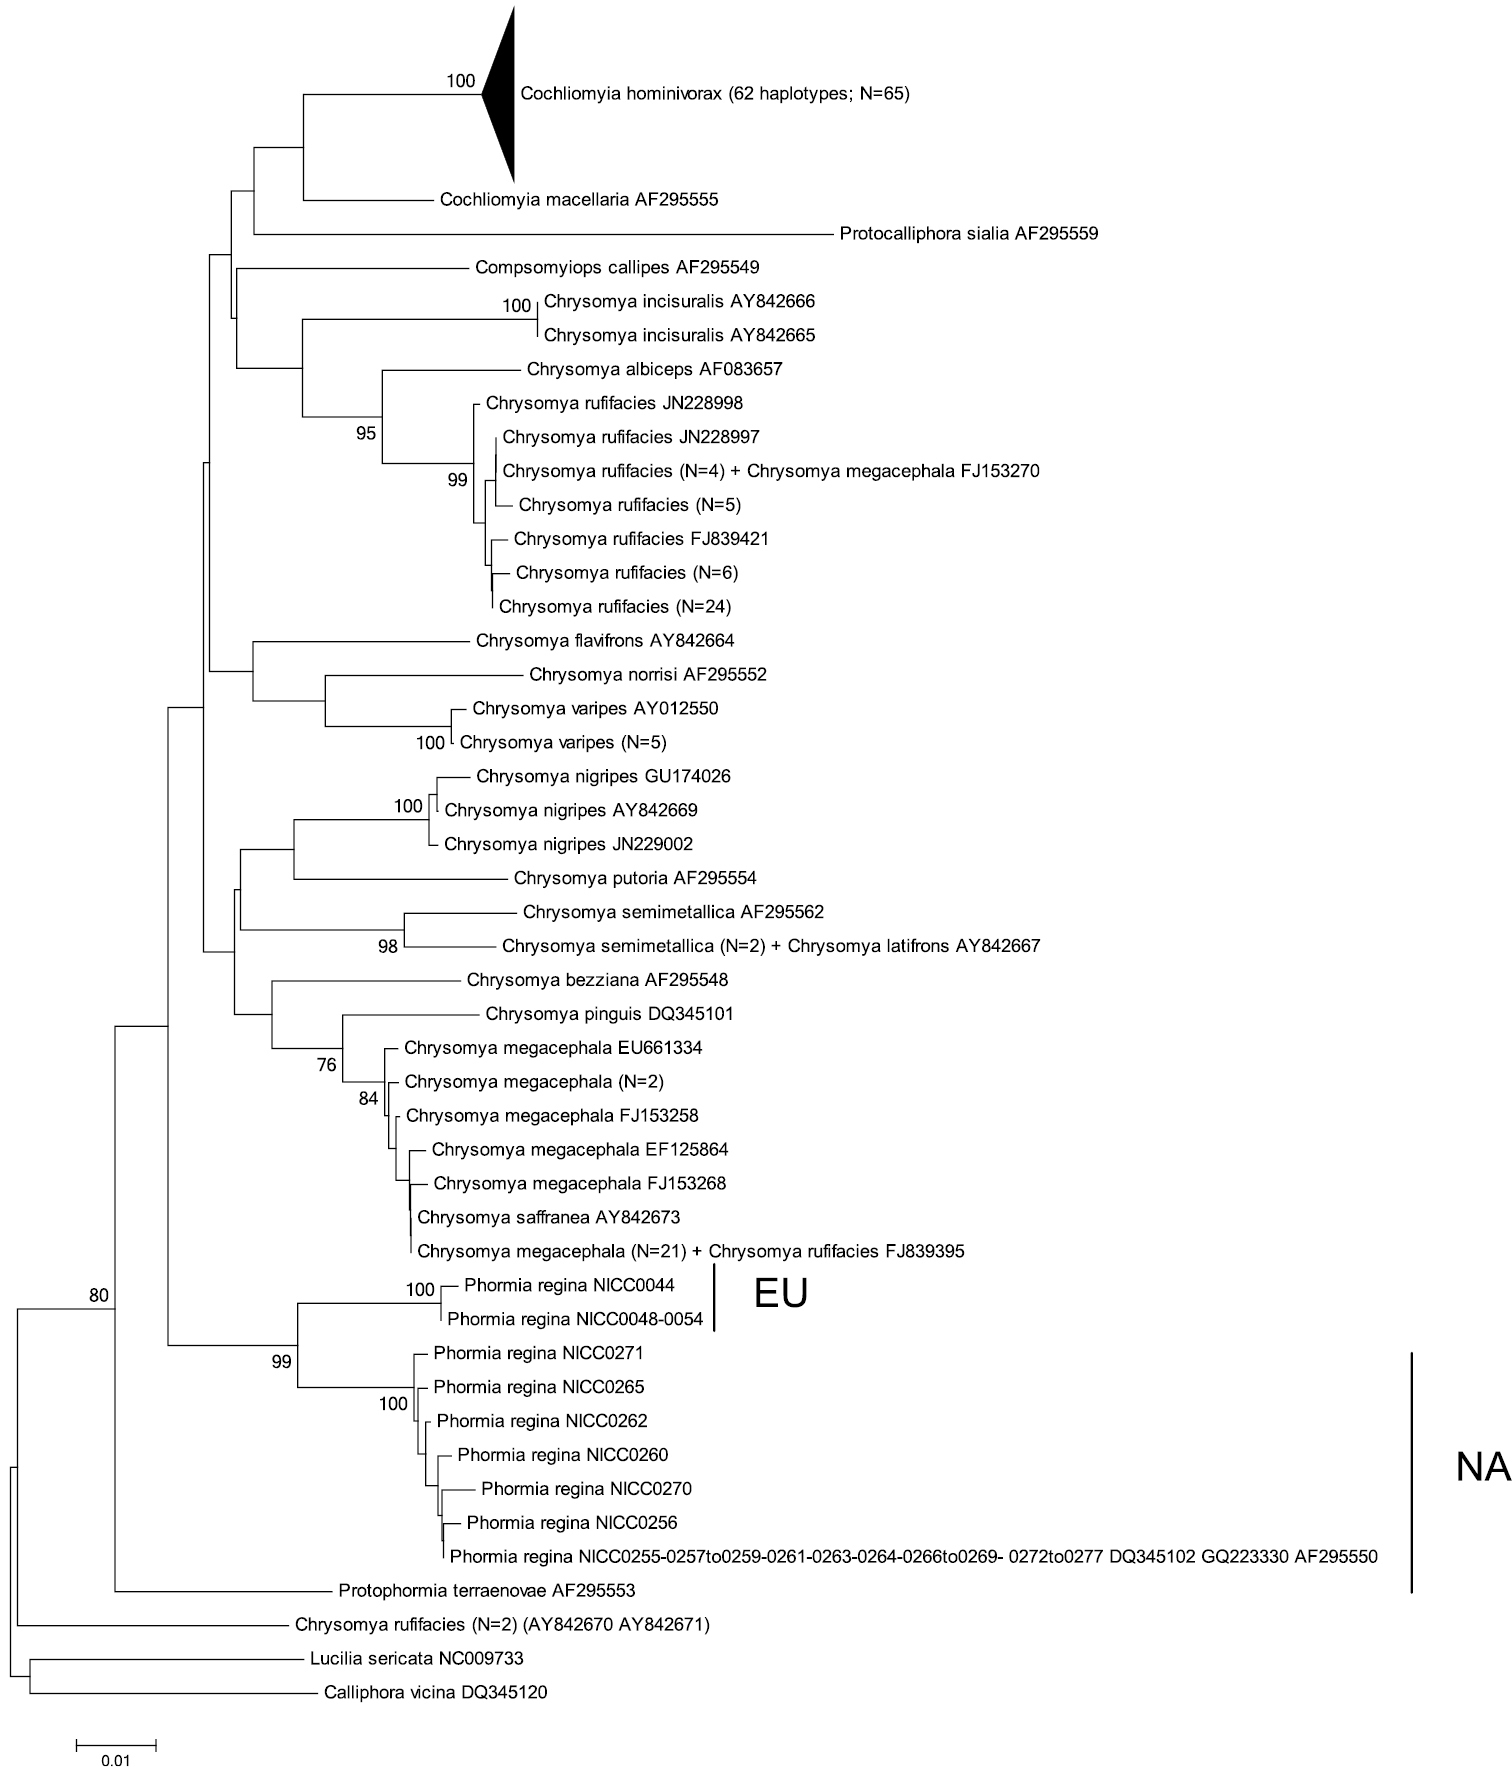
Neighbour-Joining tree (p-distances) of a 472 bp fragment of the mitochondrial cytochrome c oxidase subunit II (COII) gene. Bootstrap values ≥ 70% are shown at the nodes. N gives the number of specimens of that haplotype. EU = Phormia regina haplotypes from W Europe; NA = Phormia regina haplotypes from N America.
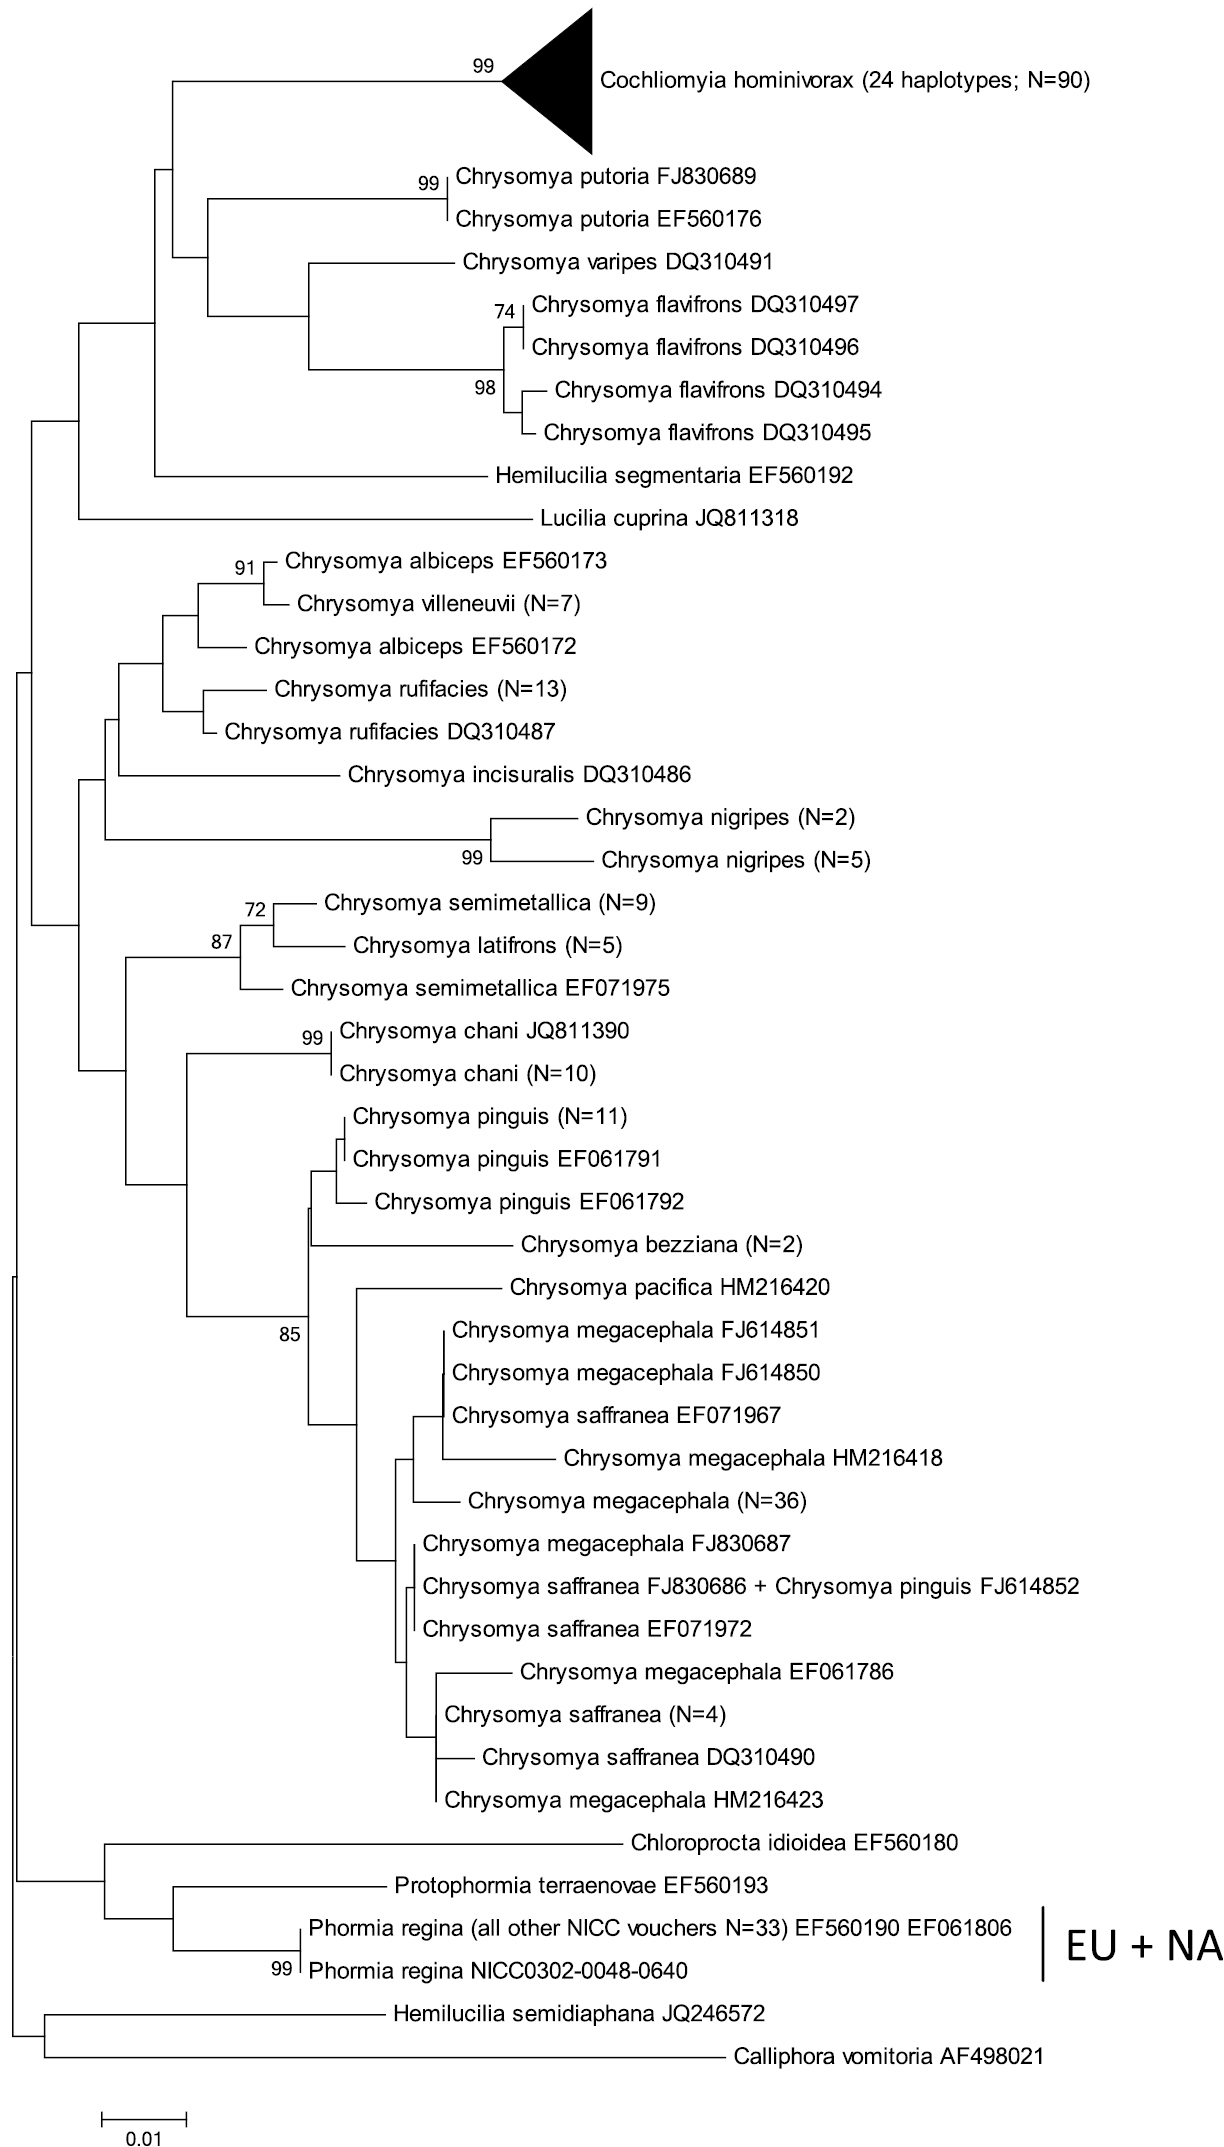
Neighbour-Joining tree (p-distances) of a 512 bp fragment of the mitochondrial cytochrome b (cyt b) gene. Bootstrap values ≥ 70% are shown at the nodes. N gives the number of specimens of that haplotype. EU = Phormia regina haplotypes from W Europe; NA = Phormia regina haplotypes from N America.
COI: The COI NJ-tree showed two supported clades within Phormia regina (Figure 2). One clade (EU = Europe) comprised six haplotypes from Europe (23 specimens sequenced), while the other clade (NA = North America) comprised 14 haplotypes from N America (27 specimens sequenced). The seven NA haplotypes available in GenBank clustered within the NA clade. The mean p-distance between the EU and NA Phormia regina haplotypes was 0.04 ± 0.007 (Table 3). Sequence divergence in Phormia regina within each continent was approximately a ten-fold lower, viz. EU: 0.003 ± 0.001 – NA: 0.004 ± 0.001.
The mean p-distances between Chrysomyinae species pairs were: between three Protocalliphora spp.: 0.05 ± 0.006, 23 Chrysomya taxa: 0.06 ± 0.005 (the three Chrysomya megacephala specimens with GenBank accession numbers KC135924, KC135925 and KC135926 were treated as a different taxon from the other Chrysomya megacephala specimens because of a strong sequences divergence, viz. mean p-distance = 0.089 ± 0.01; see Figure 2), Cochliomyia macellaria – Cochliomyia hominivorax: 0.068 ± 0.009, and Hemilucilia semidiaphana – Hemilucilia segmentaria: 0.078 ± 0.001. The mean intra- and interspecific p-distances between all Chrysomyinae species (excluding Phormia regina) were 0.005 ± 0.009 and 0.066 ± 0.005, respectively (Table 3).
COII: The two EU and seven NA haplotypes of Phormia regina (from 30 specimens) formed two strongly supported clades (Figure 3) separated by mean p-distance of 0.037 ± 0.008 (Table 3). The three COII sequences from GenBank (from NA specimens) had the same haplotype as our NA specimens. Sequence divergence in Phormia regina within each continent was approximately a ten-fold lower, viz. EU: 0.002 ± 0.002 – NA: 0.004 ± 0.002 (Table 3). The mean p-distance between the 14 Chrysomya taxa was 0.059 ± 0.007. We considered Chrysomya megacephala_FJ153270 and Chrysomya rufifacies_FJ839395 as misidentifications, and Chrysomya rufifacies_AY842670_AY842671 to be different from the other Chrysomya rufifacies individuals given the high sequence divergence (viz. mean p-distance = 0.10 ± 0.013). The mean p-distance between Cochliomyia macellaria and Cochliomyia hominivorax was 0.048 ± 0.009. The mean intra- and interspecific p-distances among all Chrysomyinae species (excluding Phormia regina) were 0.014 ± 0.014 and 0.046 ± 0.005, respectively (Table 3).
Cyt b: The three EU and seven NA haplotypes of Phormia regina (from 17 specimens) formed two strongly supported clades (Figure 4) with a mean p-distance of 0.053 ± 0.009 between these two clades (Table 3). There were no cyt b sequences of Phormia in GenBank. Sequence divergence in Phormia regina within each continent was approximately a ten-fold lower, viz. EU: 0.002 ± 0.007 – NA: 0.005 ± 0.002 (Table 3). The mean p-distance between the three Chrysomya species was 0.046 ± 0.005. The mean intra- and interspecific p-distances among all Chrysomyinae species (excluding Phormia regina) were 0.003 ± 0.002 and 0.079 ± 0.007, respectively (Table 3).
16S: For the 350 bp dataset, the three NA 16S haplotypes (from 15 specimens) (mean within NA p-distance = 0.004 ± 0.003; Table 3) formed a well-supported clade, and formed a monophyletic group with the single EU haplotype (Supplementary figure 1A). The mean p-distance between the NA and EU haplotypes was 0.006 ± 0.003. The mean p-distance between Chrysomya megacephala and Chrysomya rufifacies was 0.040 ± 0.009. The mean intra- and interspecific p-distances among all Chrysomyinae species (excluding Phormia regina) were 0.014 and 0.023 ± 0.004.
For the 251 bp dataset, all eleven NA specimens had the same haplotype with a p-distance of 0.004 to the EU haplotype (four specimens) (Supplementary figure 1B). The mean p-distance between Chrysomya megacephala and Chrysomya rufifacies was 0.059 ± 0.012. The mean intra- and interspecific p-distances among all Chrysomyinae species (excluding Phormia regina) were 0.028 ± 0.009 and 0.038 ± 0.006, respectively (Table 3).
ITS2: Excluding indels, all Phormia regina specimens (36 specimens) had the same haplotype (Supplementary figure 2), except for Phormia regina NICC0302 that had a C instead of a T at position 219 of the alignment (p-distance = 0.003). Phormia regina NICC0640 had a deletion at position 201, and Phormia regina NICC0048 had an insertion of a G at position 270 of the alignment. Both specimens were from the same locality (Liège – Belgium) in W Europe. The p-distance between Cochliomyia hominivorax and Cochliomyia macellaria was 0.008 ± 0.001, that between Hemilucilia segmentaria and Hemilucilia semidiaphana was 0.106 ± 0.018, and the mean p-distance among 16 Chrysomya species was 0.085 ± 0.010. The mean intra- and interspecific p-distances among all Chrysomyinae species (excluding Phormia regina) were 0.008 ± 0.005 and 0.085 ± 0.011, respectively (Table 3).
28S: All 37 Phormia regina specimens had the same haplotype, except for Phormia regina JQ246614 from N America that had an AG insertion at positions 460-461 of the alignment (Supplementary figure 3). One haplotype of Protophormia terraenovae (three specimens with GenBank accession numbers AJ300142, JQ307780 and JQ246615) only differed by two indels from haplotype JQ246614 of Phormia regina (at positions 408 and 460-461) (the other Protophormia terraenovae haplotype differed at more positions). The mean p-distance between Cochliomyia macellaria and Cochliomyia hominivorax was 0.005, that between Protocalliphora azurea and Protocalliphora sialia was zero [an indel at position 439 (A) in Protocalliphora azurea) of the alignment], and that between Hemilucilia semidiaphana and Hemilucilia segmentaria was 0.013. The mean p-distance among the six Chrysomya species was 0.006 ± 0.002. The mean intra- and interspecific p-distances among all Chrysomyinae species (excluding Phormia regina) were 0.003 ± 0.004 and 0.007 ± 0.002, respectively (Table 3).
On the one hand, our results show that the mean p-distance of other intrageneric interspecific comparisons (COI: 5–6.8%, COII: 4.8-5.9%, cyt b: 4.6%, 16S (251 bp): 5.9%), or among other Chrysomyinae species in general (COI: 6.6%, COII: 4.6%, cyt b: 7.9%, 16S (251 bp): 3.8%), are higher than the mean p-distances between N American and W European Phormia regina at the four mtDNA fragments (COI: 4%, COII: 3.7%, cyt b: 5.3%, 16S: 0.6%). For cyt b the NA-EU differentiation in Phormia regina is higher than that observed within other Chrysomyinae species (0.3%) yet still below the minimum interspecific p-distance (7.3%). On the other hand, for COI and COII, the NA-EU differentiation in Phormia regina is higher than the intraspecific differentiation in other Chrysomyinae species and well within the range of interspecific p-distances within Chrysomyinae. Yet, the low interspecific p-distance between some Chrysomyinae species may be due to misidentifications or may be the result of a natural process (e.g. hybridization, incomplete lineage sorting). Likewise, the high intraspecific variation within some species may be indicative of cryptic diversity (see further).
North American and W European Phormia regina were not differentiated at both nDNA fragments, and at the mtDNA 16S (< 1%), whereas interspecific p-distances in Chrysomyinae in general are substantial for ITS2 (8.5%) and 16S (3.8%). Moreover, the NA-EU differentiation in Phormia regina at these genes was even lower than the minimum intraspecific differentiation within other Chrysomyinae. This suggests that the variation at these genes in Phormia regina is intraspecific variation. Finally, we could neither detect color differences in 11 external characters, nor in the general shape of the male copulatory organs between N American and W European specimens. Evidently, a statistical analysis of more specimens (from a wider range of the species’ distribution) is necessary to reliably assess within and among population variation at these (and eventually other) morphological characters. For the time being, we consider the high differentiation at COI, COII and cyt b, but the low (16S, nDNA) or lack of (morphological) differentiation, as indicative of substantial intraspecific mtDNA sequence divergence, rather than as a species-level differentiation.
Our findings may have important implications for the use of Phormia regina in forensic and other scientific fields. Indeed, it has been suggested that the high variation in developmental times and growth curves of Phormia regina (e.g.
Intraspecific mtDNA divergence in other Chrysomyinae species is sometimes also high, viz. 4.3% for COI in Chrysomya megacephala, and 2.2%, 2.6% and 3.7% for COII in Chrysomya megacephala, Chrysomya semimetallica and Chrysomya rufifacies, respectively. Whereas these high intraspecific divergences may be due to hybridization/introgression or incomplete lineage sorting, they may also point to misidentifications. Obviously these issues are problematic if DNA barcoding of animals is only based on COI, as advocated by
Although there is no doubt that COI is a useful tool for the identification of forensically important Chrysomyinae species (
So far, the forensically important species within the Chrysomyinae belong to the genera Chrysomya, Cochliomyia, Paralucilia, Protophormia and Phormia. A number of COI reference datasets of these species are available (e.g.
In conclusion, we observed substantial differentiation between N American and W European Phormia regina at the mtDNA genes COI, COII and cyt b, but not at the 16S rDNA and the nDNA genes ITS2 and 28S. Moreover, we neither detected any morphological differentiation between specimens from both continents. We therefore consider the strong mtDNA divergence between specimens from both continents as intraspecific variation. This differentiation has to be taken into account when using Phormia regina in forensic casework or physiological studies. Finally, the use of COII as a DNA barcode marker in the Chrysomyinae seems to perform as good as the standard COI barcode region.
We wish to thank Françoise Hubrecht for her support, Knut Rognes for his help with the literature, and Sofie Vanpoucke (NICC) for her help in making the pictures of the genitalia. We thank Jens Amendt, Richard Zehner and Benoît Vincent for providing part of the W European Phormia material, and Neal Haskell, Jefferey Tomberlin and Jeffrey Wells for collecting part of the N American Phormia specimens. The comments of one referee improved the manuscript considerably. This work was done in the context of FWO research network W0.009.11N “Belgian Network for DNA Barcoding”. JEMU is funded by the Belgian Science Policy Office (Belspo).
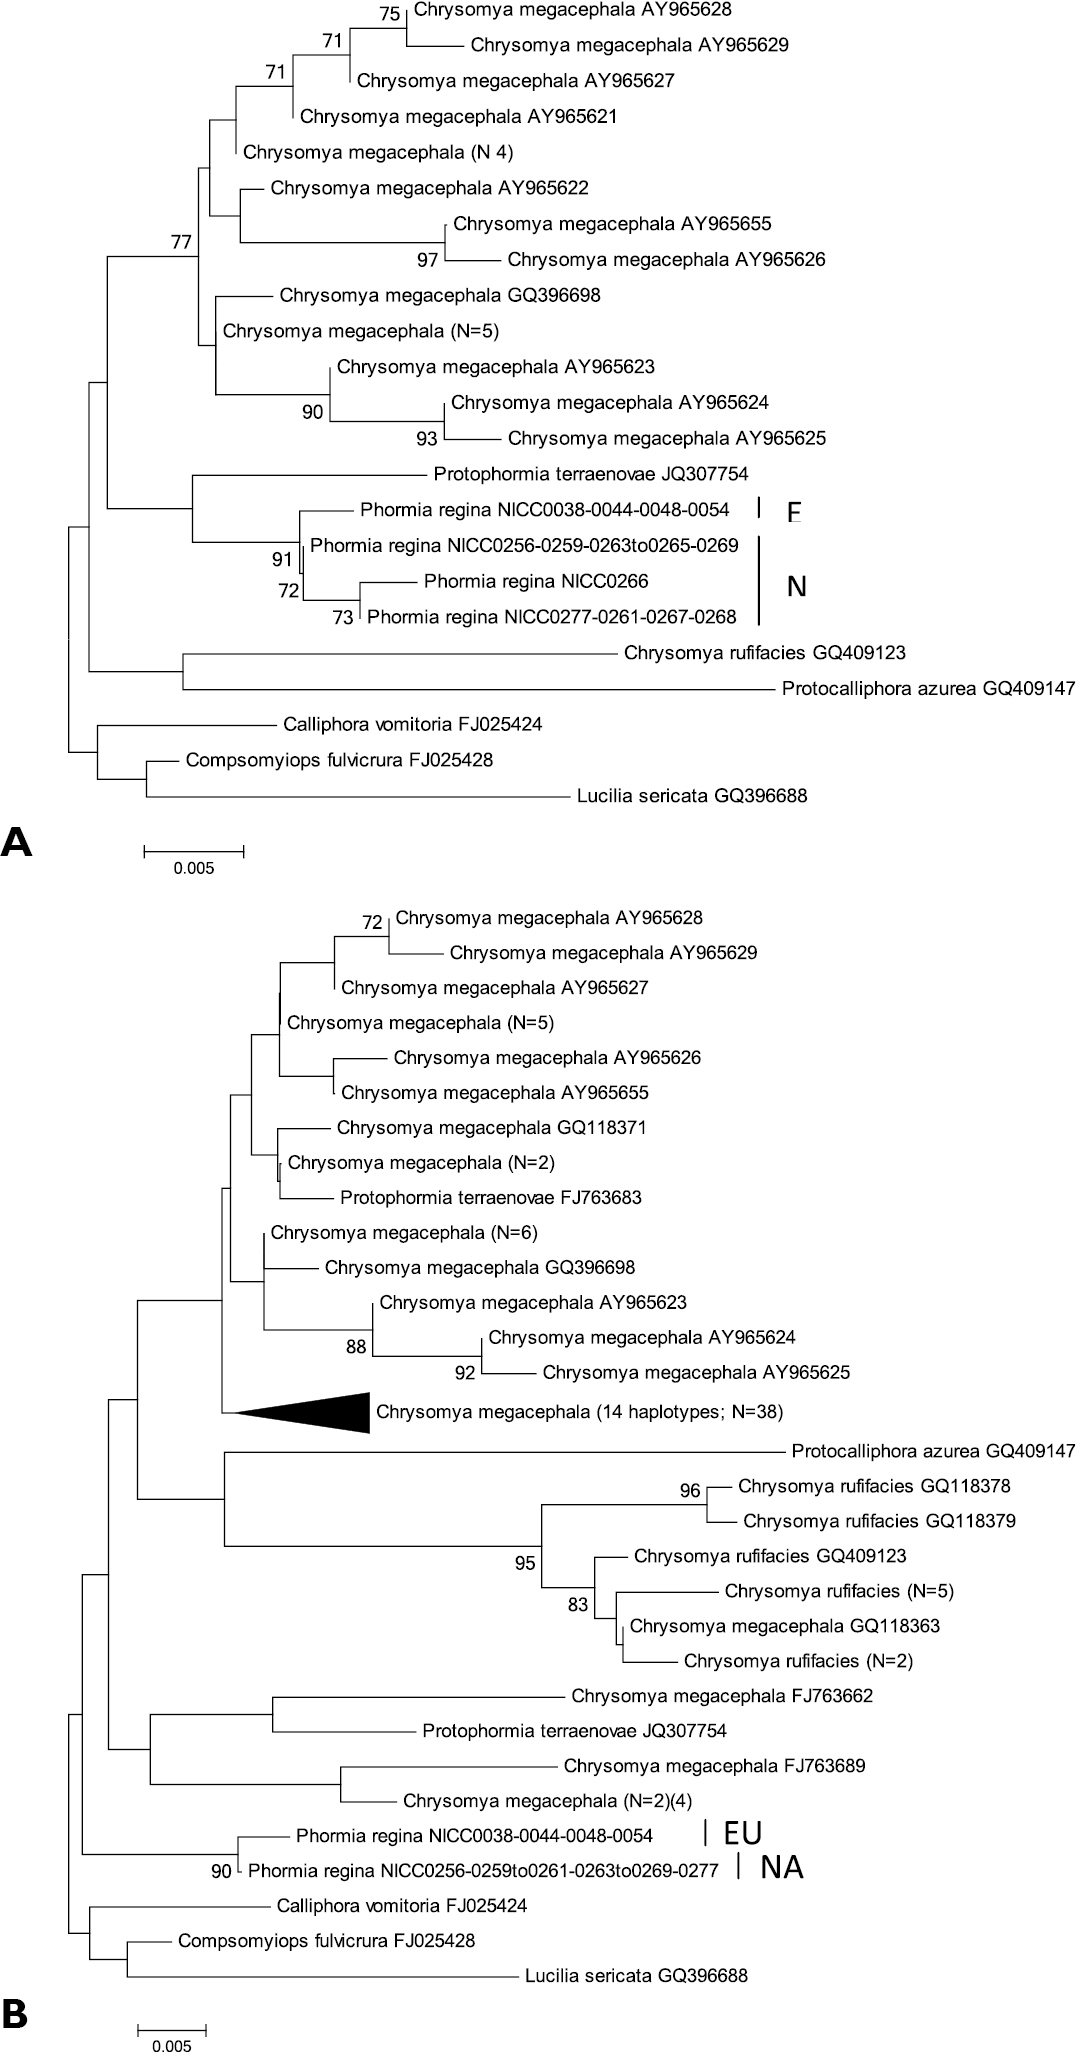
Neighbour-Joining tree (p-distances) of a 350 bp (A) and of a 251 bp (B) fragment of the mitochondrial 16S gene. Bootstrap values ≥ 70% are shown at the nodes. N gives the number of specimens of that haplotype. EU = Phormia regina haplotypes from W Europe; NA = Phormia regina haplotypes from N America.
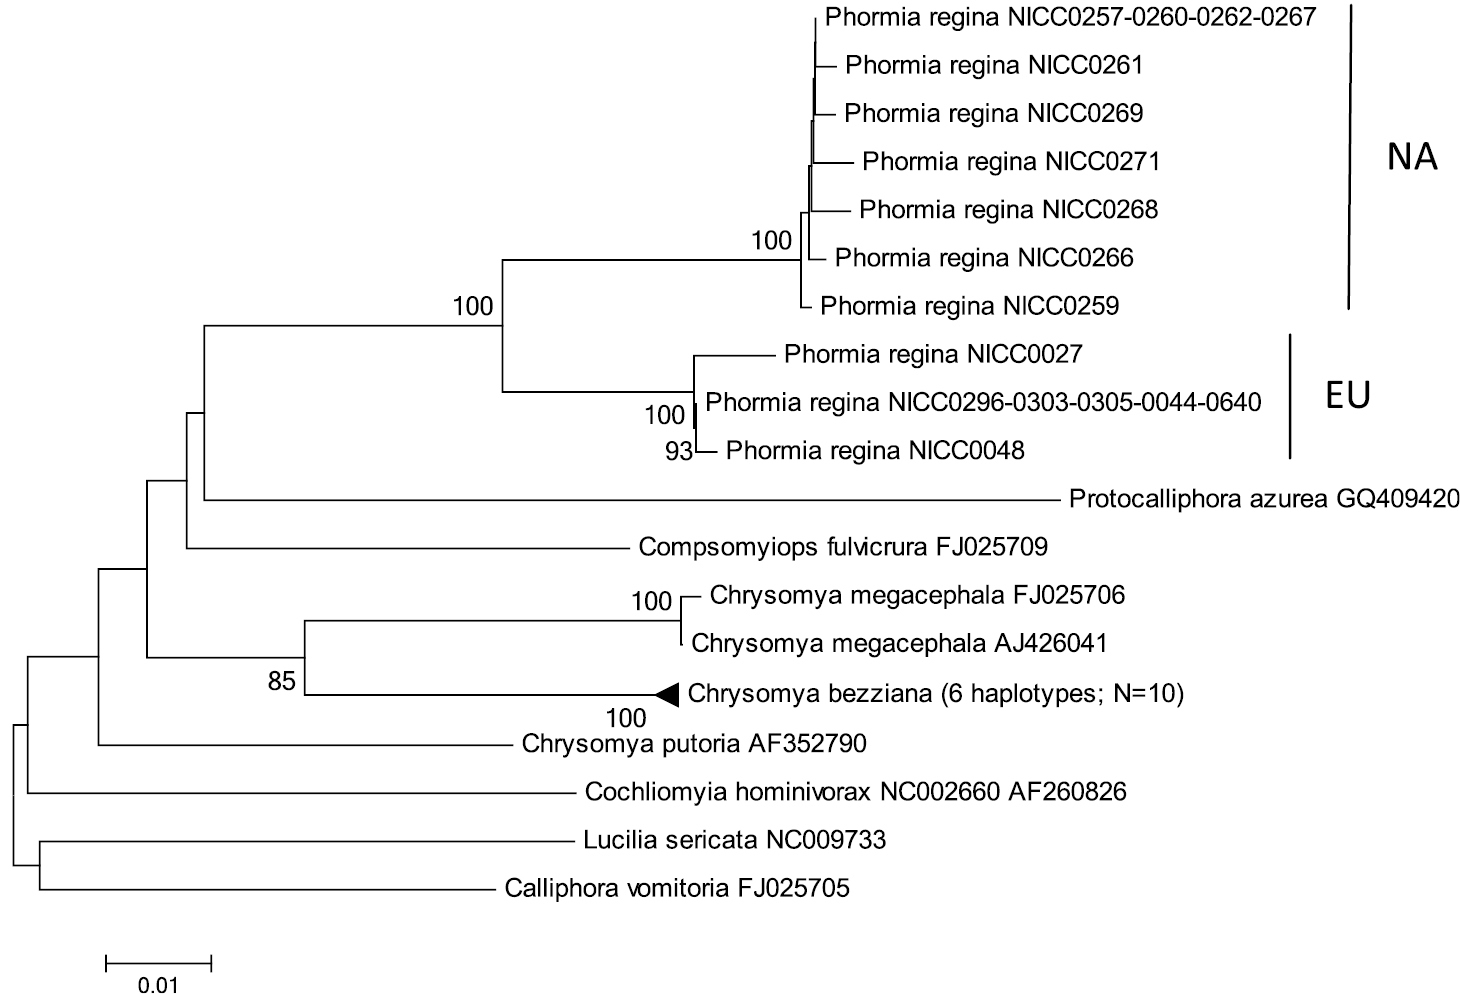
Neighbour-Joining tree (p-distances) of a 404 bp (229 bp without indels) fragment of the nuclear internal transcribed spacer 2 (ITS2). Bootstrap values ≥ 70% are shown at the nodes. N gives the number of specimens of that haplotype. EU = Phormia regina haplotypes from W Europe; NA = Phormia regina haplotypes from N America.
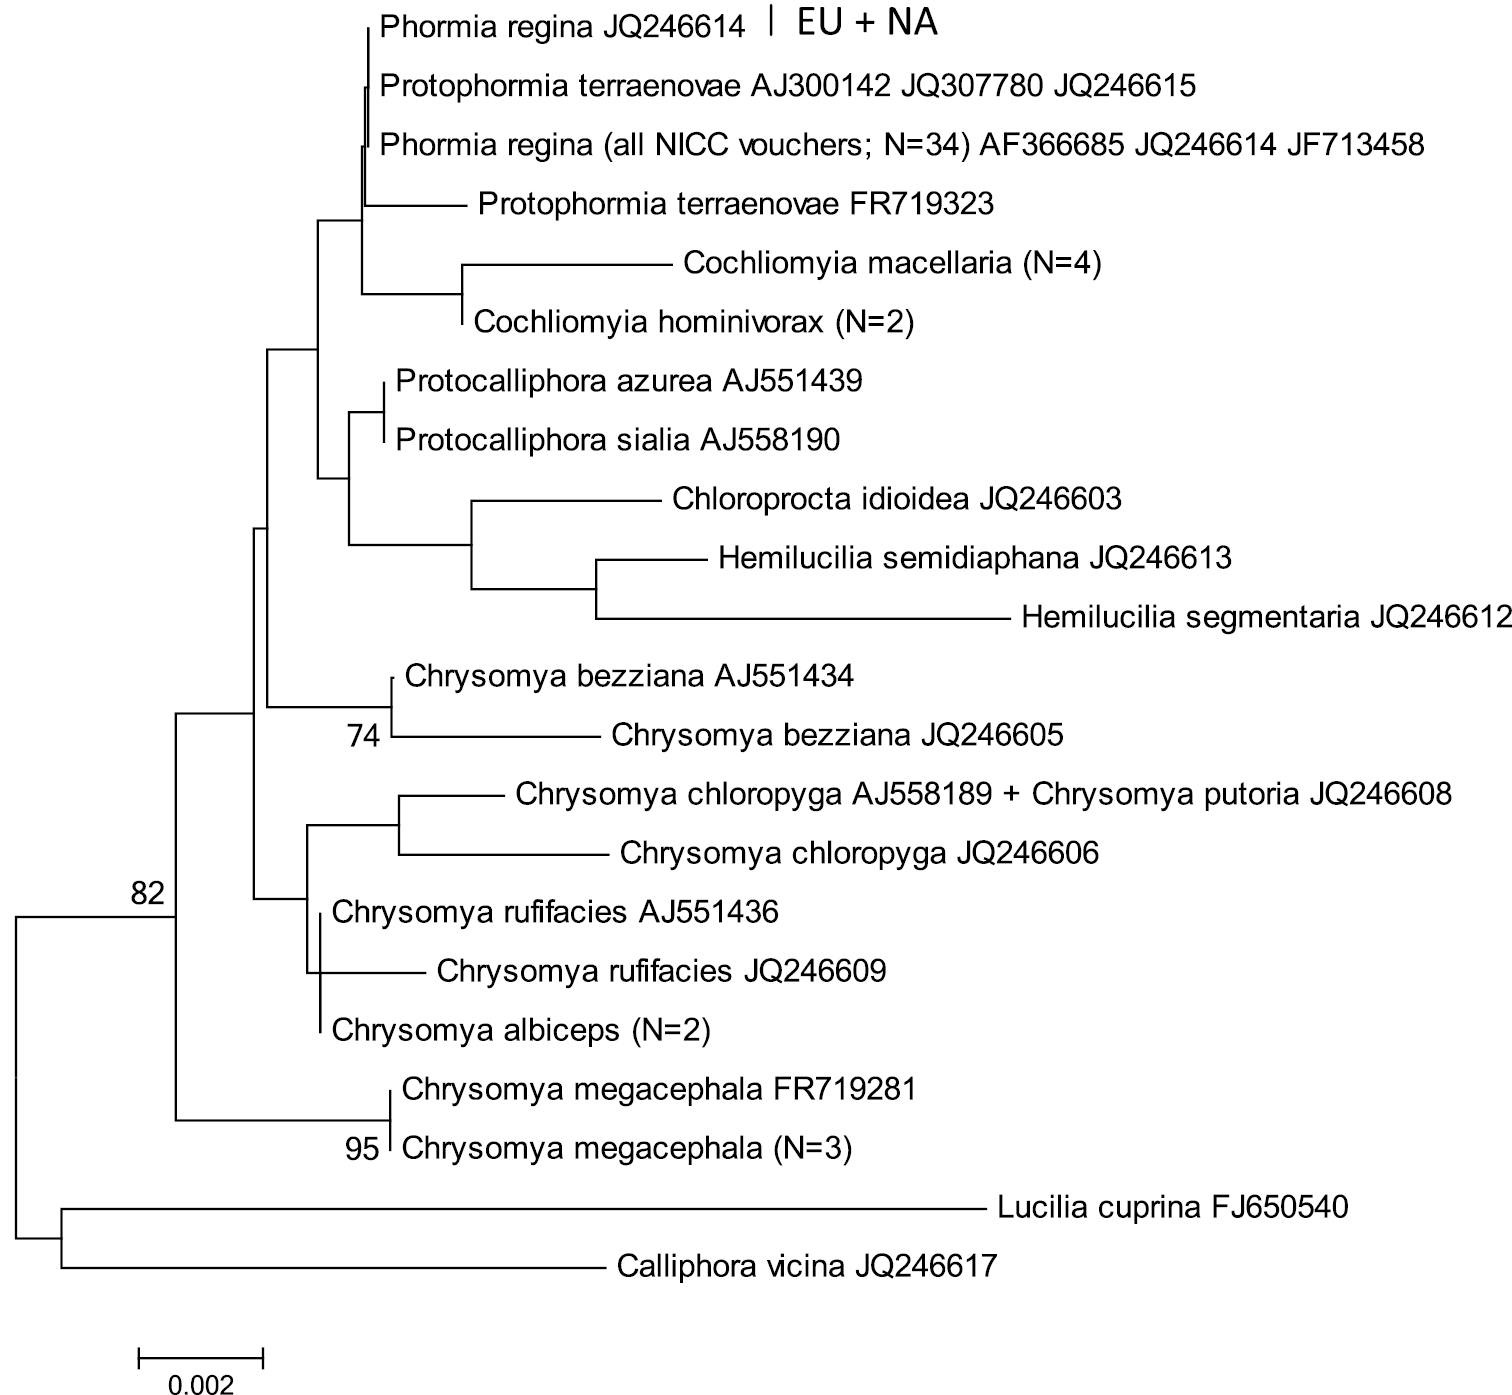
Neighbour-Joining tree (p-distances) of a 633 bp fragment of the nuclear 28S gene. Bootstrap values ≥ 70% are shown at the nodes. N gives the number of specimens of that haplotype. EU = Phormia regina haplotypes from W Europe; NA = Phormia regina haplotypes from N America.
Sampling localities, voucher numbers and GenBank numbers of the Phormia regina and Protophormia terraenovae that were sequenced in this study.
Text file with the alignments for all the gene fragments studied. (doi: 10.3897/zookeys.365.6202.app2) File format: Text file (txt).
Explanation note: Text file with the alignments (fasta format) for all the gene fragments studied (COI, COII, cyt b, 16S (251 bp), 16S (350 bp), ITS2 and 28S, respectively).