


(C) 2013 Ledile T. Mankga. This is an open access article distributed under the terms of the Creative Commons Attribution License (CC BY 4.0), which permits unrestricted use, distribution, and reproduction in any medium, provided the original author and source are credited.
For reference, use of the paginated PDF or printed version of this article is recommended.
Citation: Mankga LT, Yessoufou K, Moteetee AM, Daru BH, van der Bank M (2013) Efficacy of the core DNA barcodes in identifying processed and poorly conserved plant materials commonly used in South African traditional medicine. In: Nagy ZT, Backeljau T, De Meyer M, Jordaens K (Eds) DNA barcoding: a practical tool for fundamental and applied biodiversity research. ZooKeys 365: 215–233. doi: 10.3897/zookeys.365.5730
Medicinal plants cover a broad range of taxa, which may be phylogenetically less related but morphologically very similar. Such morphological similarity between species may lead to misidentification and inappropriate use. Also the substitution of a medicinal plant by a cheaper alternative (e.g. other non-medicinal plant species), either due to misidentification, or deliberately to cheat consumers, is an issue of growing concern. In this study, we used DNA barcoding to identify commonly used medicinal plants in South Africa. Using the core plant barcodes, matK and rbcLa, obtained from processed and poorly conserved materials sold at the muthi traditional medicine market, we tested efficacy of the barcodes in species discrimination. Based on genetic divergence, PCR amplification efficiency and BLAST algorithm, we revealed varied discriminatory potentials for the DNA barcodes. In general, the barcodes exhibited high discriminatory power, indicating their effectiveness in verifying the identity of the most common plant species traded in South African medicinal markets. BLAST algorithm successfully matched 61% of the queries against a reference database, suggesting that most of the information supplied by sellers at traditional medicinal markets in South Africa is correct. Our findings reinforce the utility of DNA barcoding technique in limiting false identification that can harm public health.
Core DNA barcodes, medicinal plants, species identification, South Africa
Traditional medicine is regarded as the most famous health care system in the world (
South Africa has a rich tropical and temperate flora, harbouring approximately 24 000 species, which account for more than 10% of the world’s vascular plants (
In the recent past, harvesting medicinal plants was the domain of trained traditional healers, well known for their skills as herbalists or diviners who respected customary conservation practices (
To reach this objective, the primary step requires a reliable tool for accurate plant identification. Traditional plant identification is based on morphological characteristics, which can be problematic especially for medicinal plants that are mainly traded as dried or processed barks, dried leaves, roots, and stems (Figure 1) in popular markets known in South Africa as muthi market. As such, traded medicinal plants are devoid of identification diagnostics making morphologically-based identification non applicable (
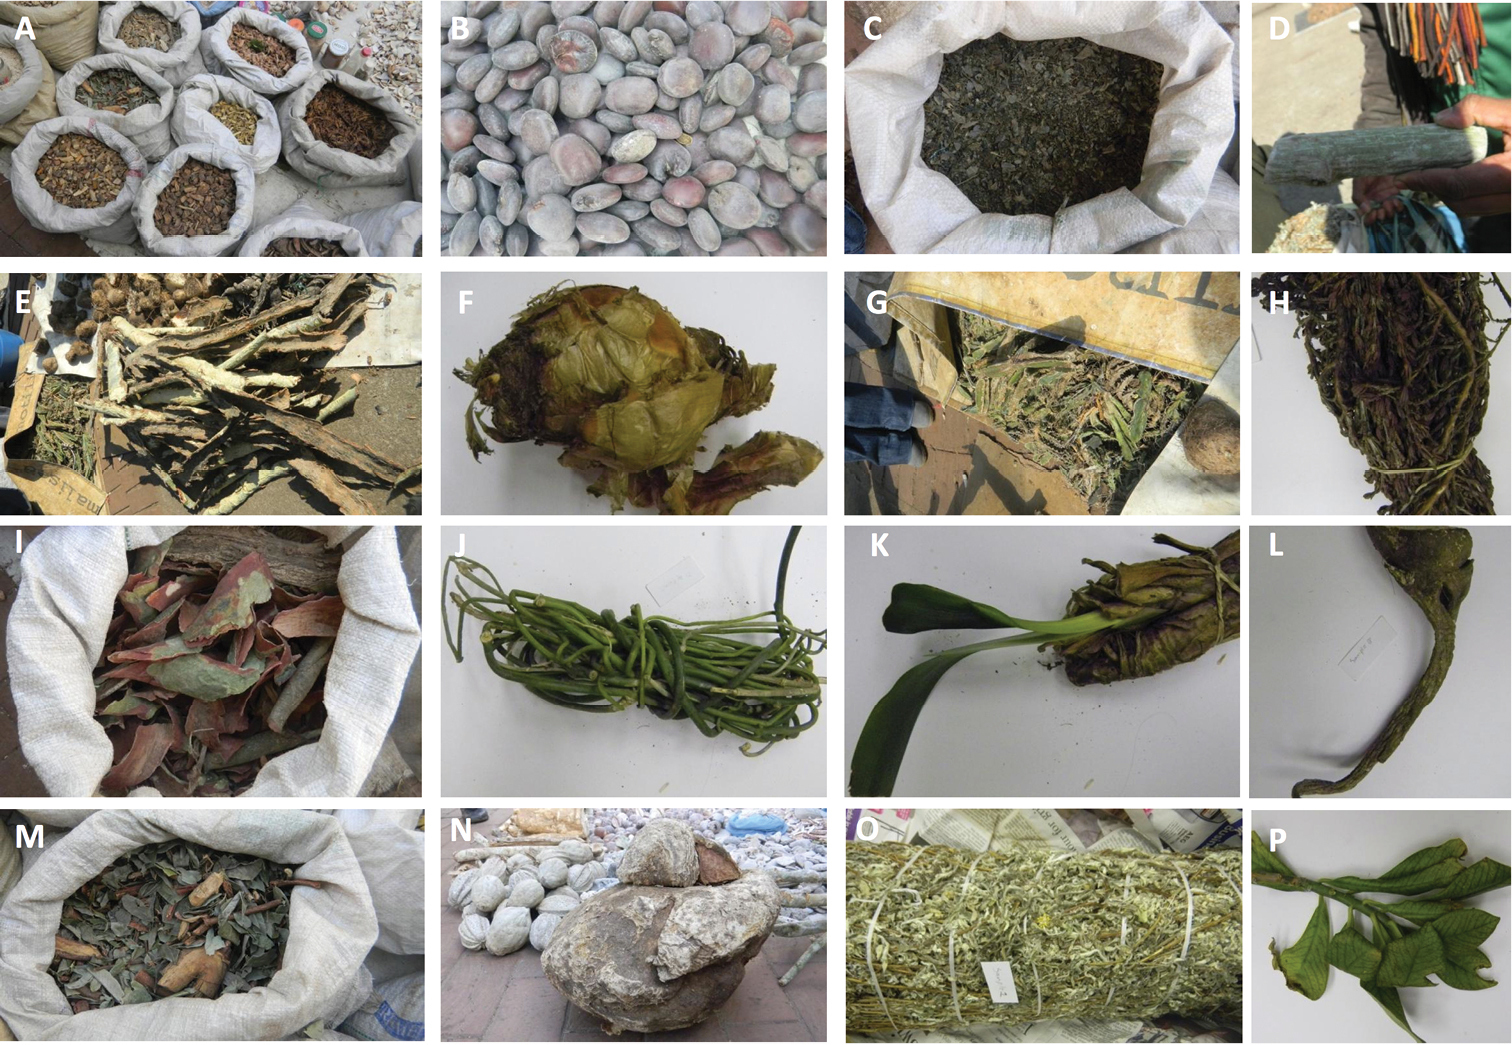
Examples ofmedicinal herbs bought at Faraday muthi market in Johannesburg A different medicinal herbs in bags B Seeds of Entada rheedii (tindili) C mixed herbs (fembo) D A twig of Adenia gummifera (mphinde umshaye) E Barks of Vachellia sp. (umkhanya-kute) F Bulb of Boophane disticha (umqotho) G mixed herbs H Myrothamnus flabellifolius (vuka) I Barks of Vachellia sp. (umkhanya-kute) J Sarcostemma viminale (ube nam) K Plant of Clivia sp. (mayime) L Stangeria eriopus (imfingo) M mixed herbs (isihlalakahle) N Tuber (umbonsi) O Helichrysum sp. (impepo) and P Twigs of Synadenium cupulare (umdletshane). Names in brackets are vernacular names in isiZulu.
Given such alarming situations of misidentification, developing techniques to assist and support traditional plant identification (e.g. assigning dried barks, roots or leaves to species) is an urgent matter not only to preserve biodiversity and traditional knowledge attached to each plant (
Two DNA regions were recently proposed as core barcodes, rbcLa and matK (
A total of 108 species belonging to 55 plant families were identified as commonly used medicinal plants in South Africa based on a literature survey (
In addition, we included in this study, plant materials bought from the Faraday muthi market (henceforth muthi samples) in Johannesburg, South Africa. A muthi market is a popular market where trade and services in African traditional medicines are provided to the general public. Materials sold in this market include various plant parts such as dried or fresh leaves, seeds, barks, and roots, etc. (Figure 1). These materials are sometimes in poorly stored and/or processed states (e.g. powder). In total, we included 18 additional muthi samples in our sampling and recorded their vernacular names (mainly in isiZulu) as provided by the sellers. It was not possible to assign scientific names to the samples at the time of purchase as they were in poor condition or had already been processed.
Of the 108 species collected from the wild, leaf samples of 37 species were sent to the Canadian Centre for DNA Barcoding (CCDB) in Canada, where total DNA was extracted, the two core DNA barcodes (matK and rbcLa) were amplified and sequenced according to CCDB protocols. The sequencing for the remaining 71 species was done at the African Centre for DNA Barcoding (ACDB) in South Africa. The 18 muthi samples were also processed and sequenced at the ACDB.
DNA extraction followed the 2 × CTAB method (
For both genes, PCR amplification was performed using ReadyMix Mastermix (Advanced Biotechnologies, Epson, Surrey, UK). We added 3.2% bovine serum albumin (BSA) to all reactions to serve as stabilizer for enzymes, to reduce problems with secondary structure, and improve annealing (
Cycle sequencing reactions were carried out in a GeneAmp PCR System 9700 thermal cycler using the ABI PRISM® BigDye® Terminator v3.1 (Applied Biosystems, Inc., California, USA). Cycle sequencing products were precipitated in ethanol and sodium acetate to remove excess dye terminators. Then suspended into 10 µL HiDi formamide (ABI) before sequencing on a ABI 3130 xl Genetic Analyzer (ABI).
Complementary strands were assembled and edited using Sequencher v3.1 (Gene Codes, Ann Arbor, Michigan, USA). All the sequences generated at ACDB and CCDB including those retrieved from BOLD were aligned manually in PAUP* v4.0b.10 (
All analyses were conducted in the R package Spider (
We then evaluated the ability of the core DNA barcodes in assigning poorly conserved or already-processed plant materials to species. For this test, the barcoding technique was applied on all 18 muthi samples. Our procedure here consisted of two steps. The first involved the use of vernacular names (in isiZulu) for the muthi samples to identify their scientific names based on
Based on genetic divergence, rbcLa exhibits the lowest mean interspecific distance (0.08); in contrast, matK exhibits the highest mean interspecific distance, which almost doubles that of rbcLa + matK (0.22 versus 0.119 respectively). From the genetic variation test based on K2P-distance for matK, we found that interspecific distance was significantly higher than intraspecific (intermedian = 0.232 vs. intramedian = 0.00; Wilcoxon sum rank test, p < 0.001; Table 1), indicating that a barcode gap exists for matK. Also, a similar pattern was found for rbcLa, high significant difference between inter- and intraspecific distances (intermedian = 0.07 vs. intramedian = 0.001, p < 0.001). We also found that when rbcLa and matK were combined the interspecific distance was significantly higher than intraspecific distance (intermedian = 0.12 vs. intramedian = 0.00, p < 0.001). Furthermore, our analyses indicate that a clear barcode gap exist between the range of intra- versus interspecific distances for all regions (Figure 2).
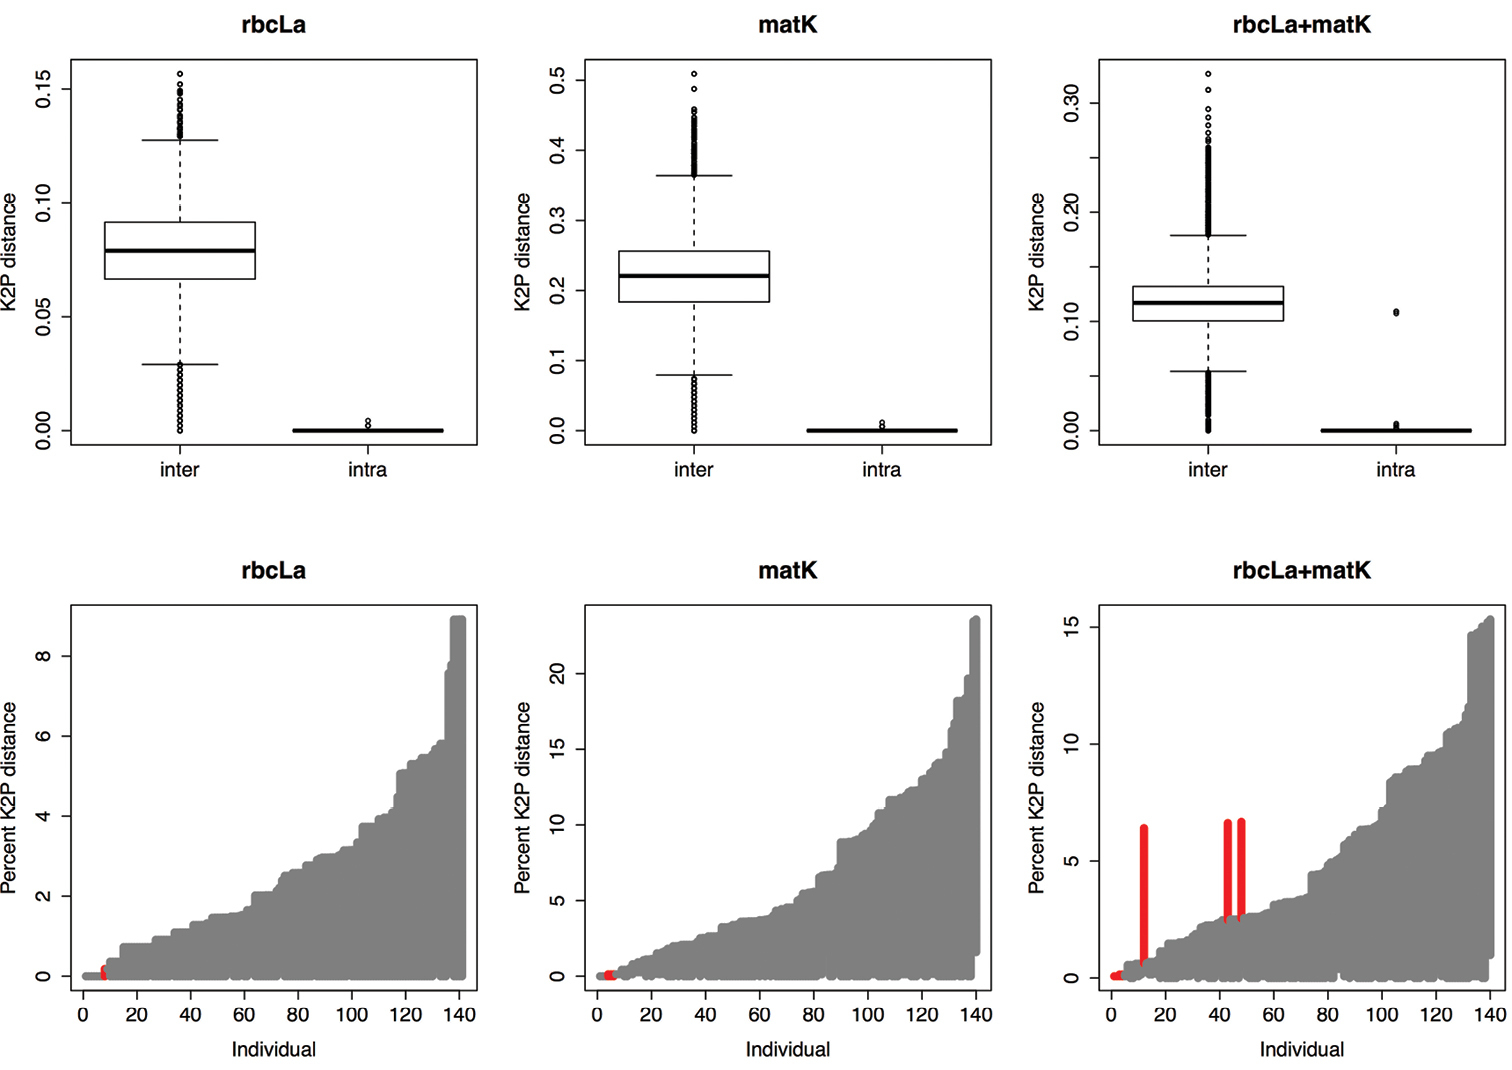
Evaluation of barcode gaps in matK, rbcLa and rbcLa + matK for commonly used medicinal plants of South Africa. A Boxplots indicate the genetic variation between interspecific distance and intraspecific distance; the boxplots clearly shows significant differences between inter- and intraspecific distances for all gene regions tested (P < 0.001; see text) B Lineplot of the barcode gap for the commonly used plants in South African medicine. For each gene region, the grey lines correspond to the furthest intraspecific distance (bottom of line value), and the closest interspecific distance (top of line value). The red lines show where this relationship is reversed, i.e. cases where there is no barcode gap.
Summary statistics indicating the range and means of intra- and interspecific distances for the gene regions and combination tested.
| DNA regions | Numbers of sequences | Sequence length | K | Range inter | Mean inter (±SD) | Range intra | Mean intra (±SD) | Threshold (%) |
|---|---|---|---|---|---|---|---|---|
| rbcLa | 141 | 552 | 0.06 | 0–0.16 | 0.080±0.022 | 0–0.004 | 0.0002±0.0007 | 0.63 |
| matK | 140 | 915 | 0.03 | 0–0.51 | 0.220±0.066 | 0–0.012 | 0.0008±0.0022 | 1.44 |
| rbcLa+matK | 140 | 1467 | 0.05 | 0–0.33 | 0.119±0.035 | 0–0.109 | 0.0039±0.0196 | 1.25 |
The Tajima’s K index of sequence was divergence measured as the mean number of substitutions per nucleotide which indicates that matK had the lowest sequence divergence (3%) whereas rbcLa and rbcLa + matK had similar divergence indices of 6% and 5% respectively.
We calculated the optimised genetic distance (threshold) with which the discriminatory power for different gene regions was evaluated. Apart from rbcLa for which the optimised threshold was lower than 1%, both matK and rbcLa + matK had optimised thresholds greater than 1% (i.e. 1.44% and 1.25% respectively). Using these cut-offs, we then evaluated the discriminatory power of different regions. We found that the combination rbcLa + matK provided the best discriminatory power based on the near neighbour and the best close match methods (96% and 97% respectively, Table 2). However, using the BOLD identification criteria, the discriminatory power of the combined regions dropped to 85% which is close to 86% for matK alone but higher than that of rbcLa (76%). Also, the application of BOLD identification criteria results in higher proportion of ambiguous identification: rbcLa (23%), matK (10%) and rbcLa + matK (11%). Conversely, the best close match method had the lowest proportion of ambiguous identification (i.e. 0–7%) for all regions tested.
Efficacy of DNA barcodes in identification of commonly used medicinal plants in South Africa.
| DNA regions | Near Neighbour | BOLD (1%) | Best close match | |||||||
|---|---|---|---|---|---|---|---|---|---|---|
| False (%) | True (%) | Ambiguous (%) | Correct (%) | Incorrect (%) | No ID (%) | Ambiguous (%) | Correct (%) | Incorrect (%) | No ID (%) | |
| rbcLa | 5 | 95 | 23 | 76 | 0 | 1 | 6 | 93 | 1 | 0 |
| matK | 7 | 93 | 10 | 86 | 1 | 3 | 4 | 92 | 1 | 3 |
| rbcLa+matK | 4 | 96 | 11 | 85 | 1 | 3 | 0 | 97 | 2 | 1 |
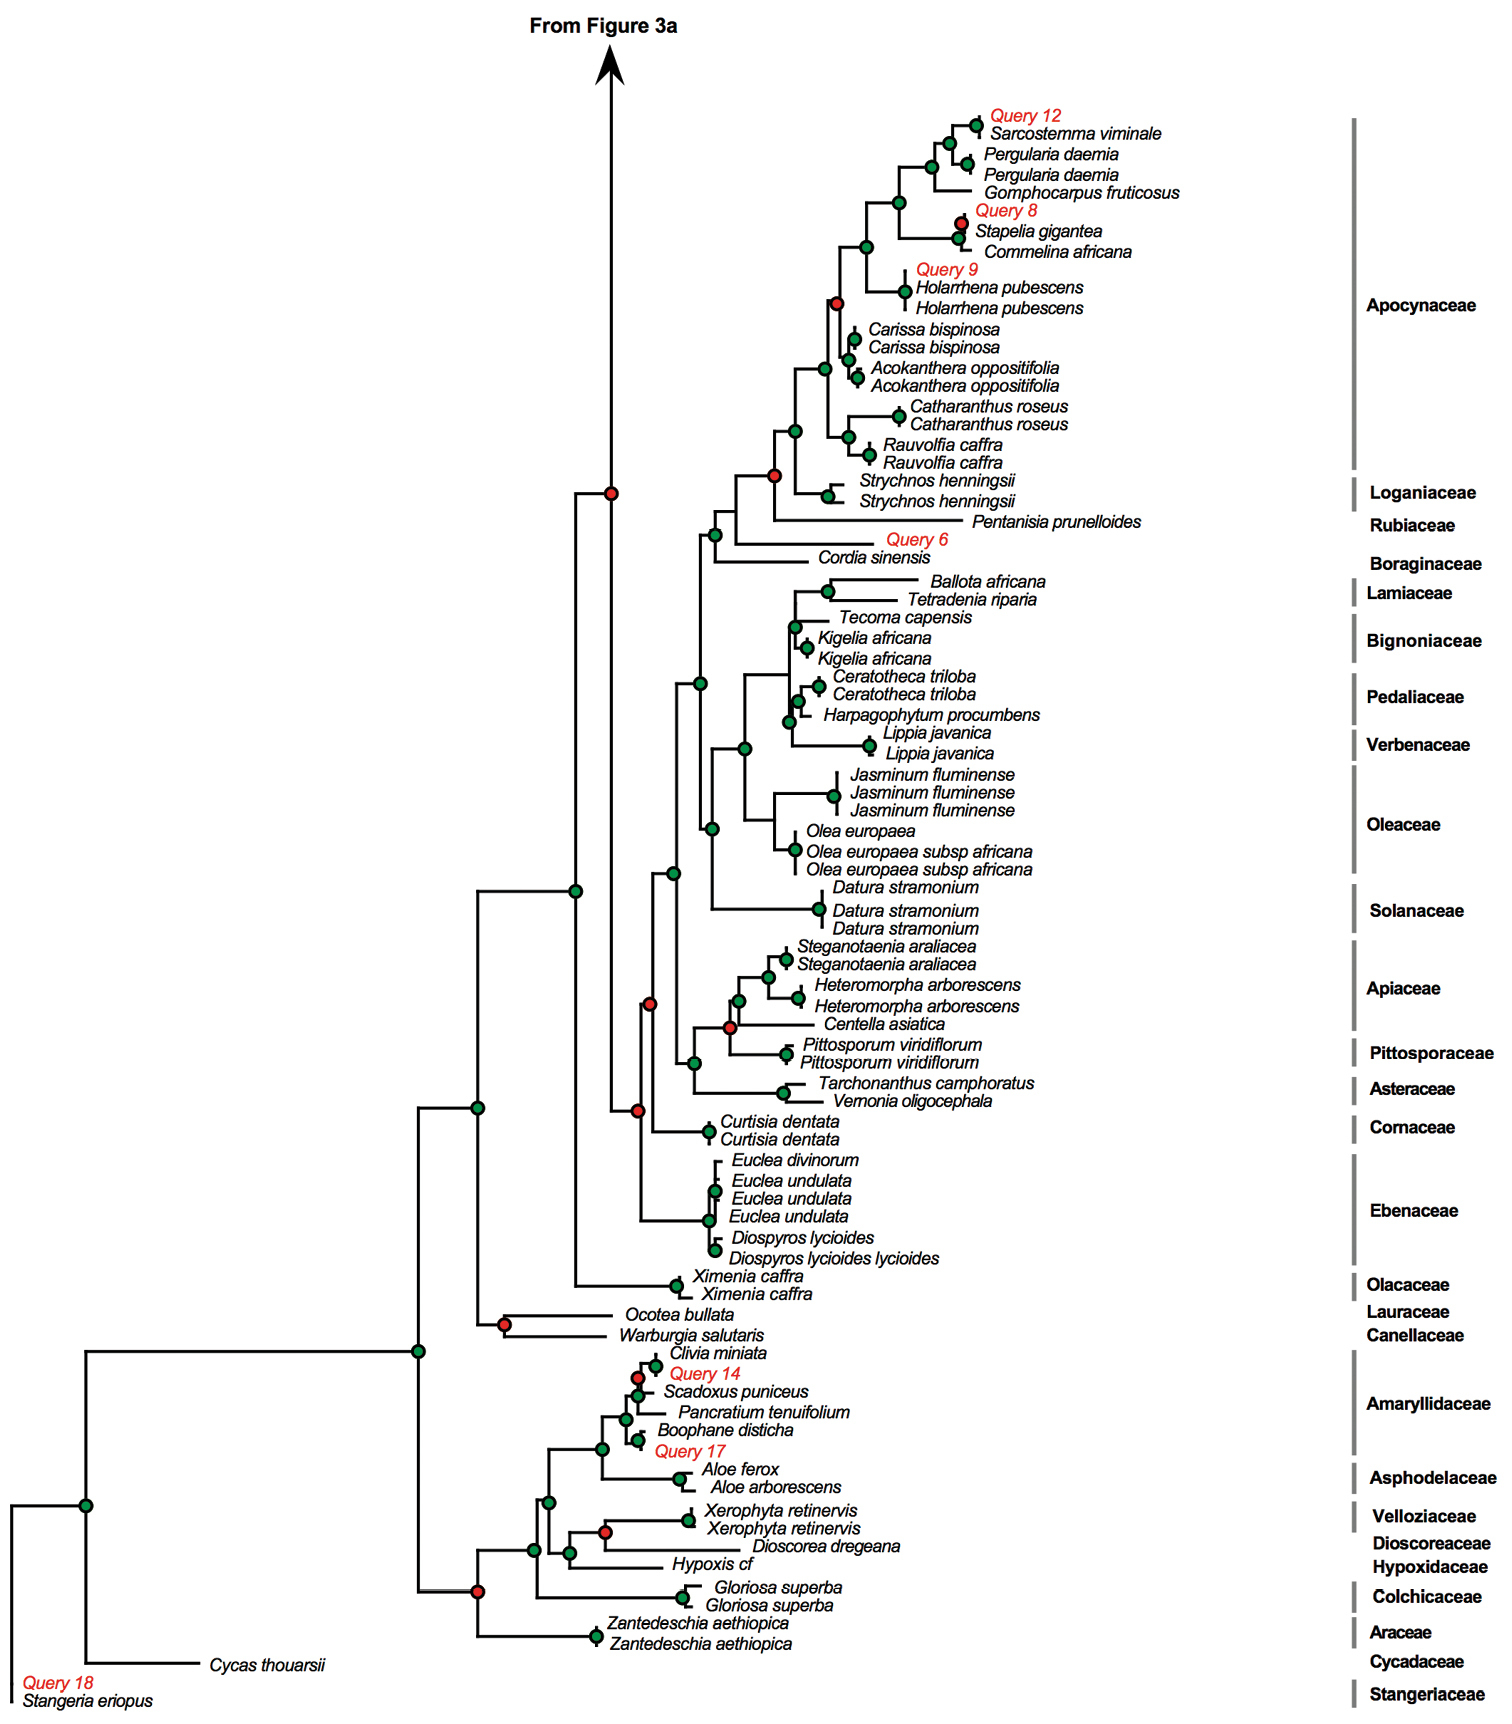
We then BLASTed (compared) the sequences for the 18 poorly conserved and degraded muthi samples against the BOLD identification system. Two muthi samples proved difficult to amplify whereas the amplification was successful for the 16 remaining muthi samples (Table 3). Of the 16 samples, the BLAST test was successful for 11 samples (61%), indicating that the scientific names recovered from BLAST test matched perfectly the scientific names expected based on vernacular names. However, we found mismatches for five samples. These results were also indicated on the MP phylogeny presented in Figure 3.
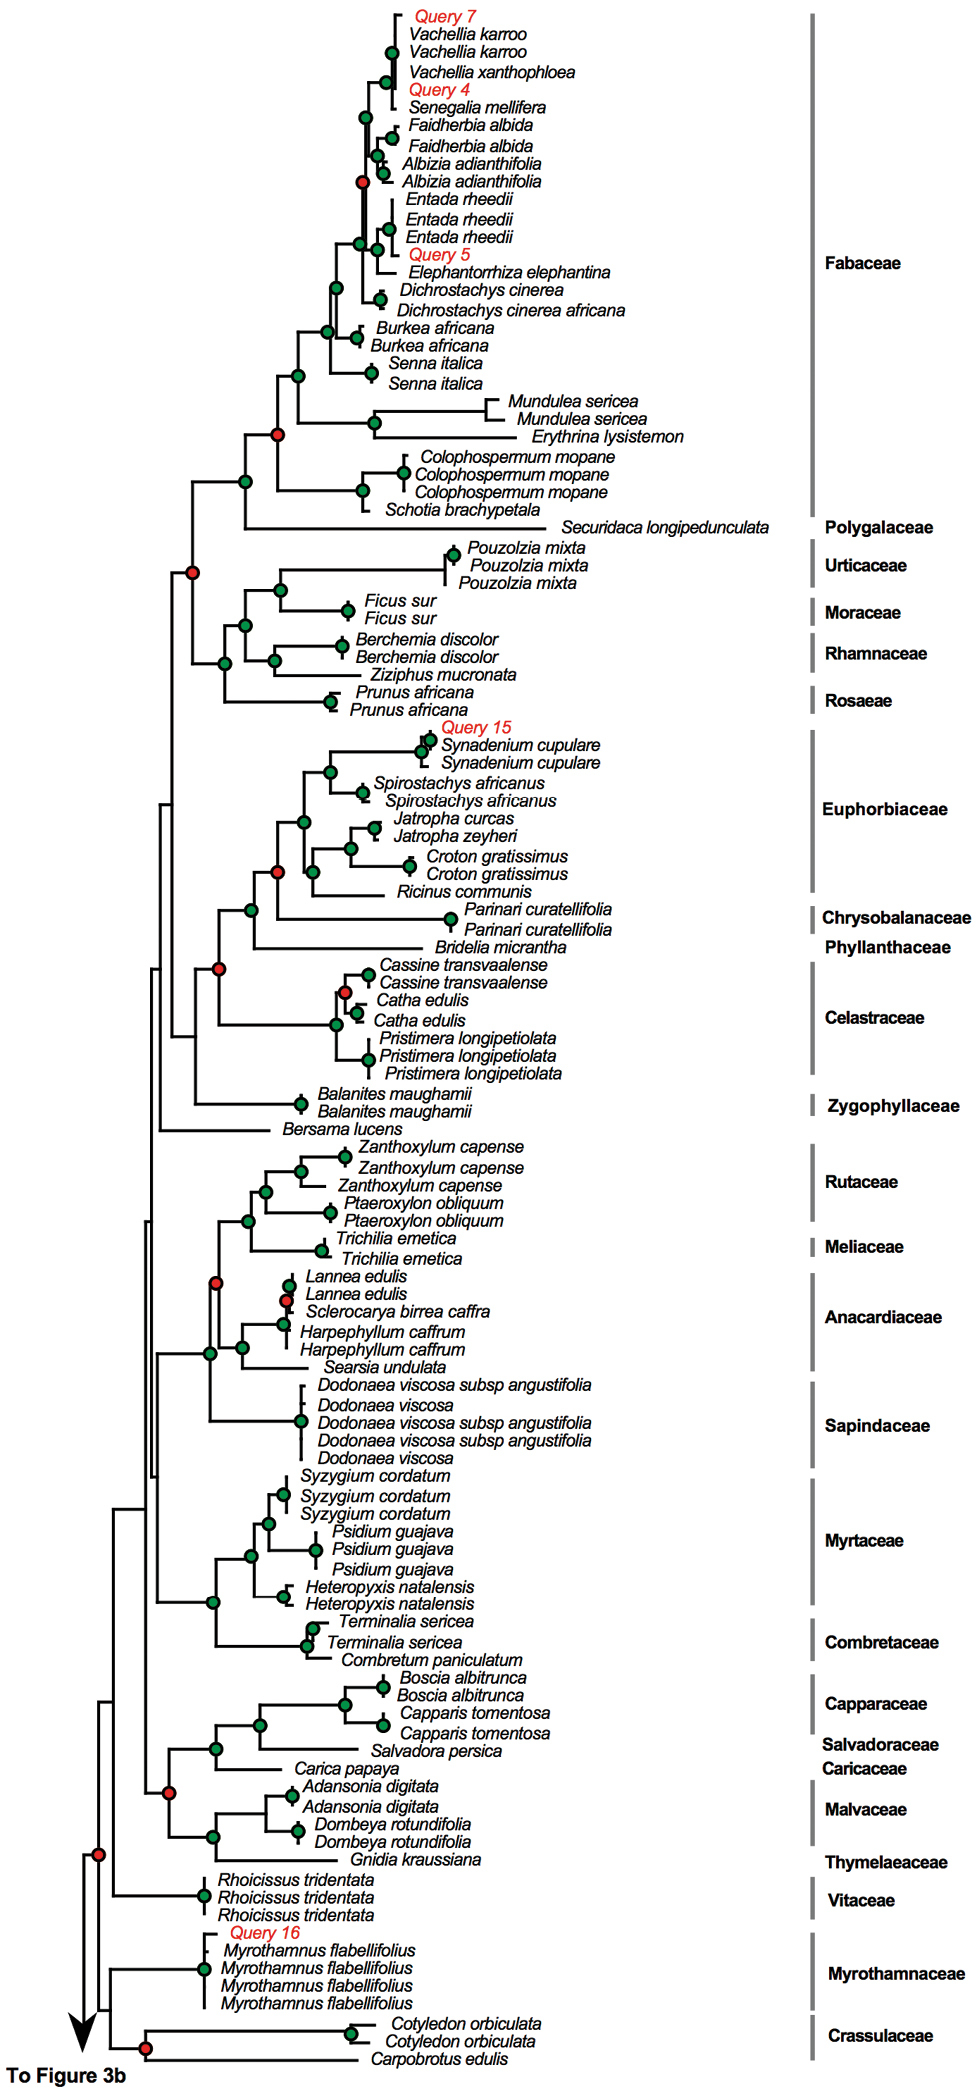
Phylogram obtained from the maximum parsimony analysis of matK with muthi samples included as “query”. Green dots indicate well-supported nodes (bootstrap support > 74%) and red dots indicate low bootstrap support (BS < 74%). Phylogram obtained from the maximum parsimony analysis of matK with muthi samples included as “query”. Green dots indicate well-supported nodes (bootstrap support > 74%) and red dots indicate low bootstrap support (BS < 74%).
Continued.
Comparison of BLAST results against common and scientific names for the muthi samples. – indicates specimens for which PCR failed. ? indicates specimens for which common names or scientific names could not be found in the available literature. IUCN redlist obtained from http://redlist.sanbi.org
| Common names from “muthi” market | Common names from literature (in isiZulu; |
Scientific names ( |
IUCN red list | BLAST sequence similarity - BOLD % | Do BLAST results match the correct scientific names? | ||
|---|---|---|---|---|---|---|---|
| 1. | impepo | impepo | Helichrysum sp. | Asteraceae | - | 100 | True |
| 2. | isihlalakahle | ? | Harworthia limifolia | Asphodelaceae | Vulnerable (VU) | - | Amplification failed |
| 3. | fembo | ? | ? | ? | - | - | Amplification failed |
| 4. | mkhanya kute | umkhanya-kute, umdlovune, umhlofunga, umhlosinga | Vachellia xanthophloea | Fabaceae | Least Concern (LC) | 98 | True |
| 5. | tindili | umbhone, tindili | Entada rheedii | Fabaceae | Least Concern (LC) | 99 | True |
| 6. | ubhonsi | ? | Mappia racemosa | Icacinaceae | Vulnerable (VU) | 89 | False |
| 7. | ukhanyakute | umkhanya-kute, umdlovune, umhlofunga, umhlosinga | Vachellia xanthophloea | Fabaceae | Least Concern (LC) | 99 | True |
| 8. | umlilo | uzililo, ililo elikhulu | Stapelia gigantea | Apocynaceae | Least Concern (LC) | 100 | True |
| 9. | malilisa | ? | Holarrhena pubescens | Apocynaceae | Least Concern (LC) | 100 | False |
| 10. | umhlahlawehlathi | umhluswane | Cissus reniferus | Vitaceae | - | 97 | False |
| 11. | mphinde umshaye | ? | Adenia gummifera | Passifloraceae | - | - | False |
| 12. | ube nam | umbelebele, umpelepe | Sarcostemma viminale | Asclepiadaceae | Least Concern (LC) | 100 | False |
| 13. | isikholokhota | isikholokhoto | Sanseviera hyacinthiodes | Asparagaceae | Least Concern (LC) | 99 | True |
| 14. | mayime | umayime | Clivia miniata | Amaryllidaceae | Vulnerable (VU) | 99 | True |
| 15. | umdletshane | umbulele, umdletshane | Synadenium cupulare | Euphorbiaceae | Least Concern (LC) | 100 | True |
| 16. | vuka | vuka | Myrothamnus flabellifolius | Myrothamnaceae | DDT | 100 | True |
| 17. | umqotho | incotha, incwadi | Boophane disticha | Amaryllidaceae | Declining | 100 | True |
| 18. | imfingo | imfingo | Stangeria eriopus | Stangeriaceae | Vulnerable (VU) | 100 | True |
The efficiency of a good barcode relies fundamentally on its ability to distinguish between closely related species. This is achieved only when there is enough genetic differentiation between rather than within species, i.e. when interspecific distance is significantly higher than intraspecific distance (
In several studies, the discriminatory power of the core barcodes has been questioned (
We further tested, the performance of the core barcodes by evaluating their identification efficacy on 18 medicinal plant products bought at the Faraday muthi market in Johannesburg, South Africa. The sequences generated from these 18 plant materials were BLASTed against the reference library on BOLD database system. Given that the plant materials sold at the muthi market were poorly conserved (dried, processed, etc.), we expected a very low percentage of DNA recovery and amplification. Possible explanation for the five samples that yielded false identification, and the two that failed are that the samples could be a mixture of leaves from multiple species. Such limitation could be overcome using individual sequencing of all components of mixed DNA samples based on high throughput sequencing techniques e.g. pyrosequencing technology, which is capable of simultaneously detecting many thousands of different sequences in a mixed sample, without the need for sub-cloning (
Another possibility for the amplification failure observed in our study for some samples could be attributable to a bad post harvest condition of preservation, which may result in DNA degradation. Again, such limitation could be overcome through the search of a ‘mini-barcode’ (
The continual removal of medicinal plants from the wild has become worrisome in southern Africa (
In conclusion, our analyses indicate that most of the information supplied by the sellers at the muthi market were correct. This could be due to the fact that we tested only 18 samples. Therefore, it remains possible that if we increase our sample size, we might detect important mismatch between the sellers’ claims and the products sold. We also propose a continued effort to increase the barcode library of South African medicinal plants, and in case of difficulties due to degraded materials, a pyro-sequencing technique in tandem with mini-barcodes is necessary. Our suggestions and findings are expected to be of great use in limiting false identification that can harm public health.
We thank the Canadian Center for DNA Barcoding for sequencing support. The National Research Foundation (NRF) South Africa and the International Development Research Centre (IDRC), Canada are greatly acknowledged for funding. This project is also partly funded by the Government of Canada through Genome Canada and the Ontario Genomics Institute (2008-OGI-ICI-03). Particular thanks go to the sellers at the Faraday muthi market in Johannesburg and Mr Stanley Khumalo for the isiZulu language translation. We thank two anonymous reviewers who provided valuable comments on an earlier draft of the manuscript.
List of taxa with voucher information. (doi: 10.3897/zookeys.365.5730.app) File format: Microsoft Word file (docx).
Explanation note: List of taxa with voucher information, BOLD and GenBank accession numbers for each DNA region. English common names have been chosen. In cases where English common names were unavailable, names in native languages were used.