


(C) 2013 John Smit. This is an open access article distributed under the terms of the Creative Commons Attribution License (CC BY 4.0), which permits unrestricted use, distribution, and reproduction in any medium, provided the original author and source are credited.
For reference, use of the paginated PDF or printed version of this article is recommended.
Citation: Smit J, Reijnen B, Stokvis F (2013) Half of the European fruit fly species barcoded (Diptera, Tephritidae); a feasibility test for molecular identification. In: Nagy ZT, Backeljau T, De Meyer M, Jordaens K (Eds) DNA barcoding: a practical tool for fundamental and applied biodiversity research. ZooKeys 365: 279–305. doi: 10.3897/zookeys.365.5819
A feasibility test of molecular identification of European fruit flies (Diptera: Tephritidae) based on COI barcode sequences has been executed. A dataset containing 555 sequences of 135 ingroup species from three subfamilies and 42 genera and one single outgroup species has been analysed. 73.3% of all included species could be identified based on their COI barcode gene, based on similarity and distances. The low success rate is caused by singletons as well as some problematic groups: several species groups within the genus Terellia and especially the genus Urophora. With slightly more than 100 sequences – almost 20% of the total – this genus alone constitutes the larger part of the failure for molecular identification for this dataset. Deleting the singletons and Urophora results in a success-rate of 87.1% of all queries and 93.23% of the not discarded queries as correctly identified. Urophora is of special interest due to its economic importance as beneficial species for weed control, therefore it is desirable to have alternative markers for molecular identification.
We demonstrate that the success of DNA barcoding for identification purposes strongly depends on the contents of the database used to BLAST against. Especially the necessity of including multiple specimens per species of geographically distinct populations and different ecologies for the understanding of the intra- versus interspecific variation is demonstrated. Furthermore thresholds and the distinction between true and false positives and negatives should not only be used to increase the reliability of the success of molecular identification but also to point out problematic groups, which should then be flagged in the reference database suggesting alternative methods for identification.
COI, DNA barcoding, reference database
Tephritidae, or true fruit flies, are a large group of flies (Diptera) with some 4 500 species described (
Among the economically important taxa five genera have been listed on the quarantine list of the European Union: Anastrepha Schiner, 1868, Bactrocera Macquart, 1835, Ceratitis Macleay, 1829, Dacus Fabricius, 1805 and Rhagoletis Loew, 1862 (Annex IAI of the Council Directive 2000/29/EC). Most species within these genera are notoriously difficult to identify, therefore the genera are placed on the quarantine list as a whole, despite the fact that not all are pest species. Interceptions on commercial products almost always concern larvae, which are next to impossible to identify. Moreover the number of species that can attack a specific host plant is unknown and the geographic ranges of many species are poorly documented. Therefore there is a desperate need for an alternative method for unambiguous identification of these Tephritid species, especially among plant protection organizations.
In our study we chose a different approach: instead of focussing on certain species groups or genera, we sequenced as many European species that we could get a hold of, including multiple specimens from distinct geographical populations for as many species as possible. This generated a dataset containing 555 sequences of half of the European species; 124 of the approximately 240 (
Data on the voucher specimens are provided in Appendix. The vast majority of specimens was collected throughout Europe in 2009 (n = 494). Specimens were directly stored in ethanol 96%. Some of the older material, collected before 2009, has been either directly collected in ethanol 96% (n = 23) or was collected with a Malaise trap (ethanol 70%) and later transferred to ethanol 96% (n = 38).
The oldest material included in this study is from 1999, collected in Kyrgyzstan by Valery Korneyev; this material was stored in 70% ethanol until DNA extraction and amplification. Of the 18 specimens collected, only four resulted in full barcode sequences, hence these are the only ones included in the dataset.
We have included up to eight specimens from geographically distinct populations in order to test the intraspecific variation for as many species as possible. However, we were unable to obtain more than one specimen for a number of species, whereas we have included between 9 and 15 specimens for species with uncertain taxonomy due to species complexes or host races (Table 1). For Chaetostomella cylindrica (Robineau-Desvoidy, 1830) we included 23 specimens in order to cover as much of the host races as possible (
The number of species with their range of specimens included in our dataset.
| Specimens per species | No. species |
|---|---|
| 1 | 41 |
| 2–8 | 78 |
| 9–15 | 15 |
| > 15 | 1 |
The dataset contains 13 specimens of 11 species originating from Peru, some of which have their congeners among European taxa. These were added to see whether these more distant related taxa have any affect the molecular identification of a dataset of primarily European species. Thus adding a second geographical scale, besides multiple populations per species.
Additionally one outgroup specimen from the closely related family Ulidiidae was used to root the tree: Ulidia nigripennis Loew, 1845.
The dataset includes 554 sequences of 135 ingroup species from three different subfamilies and 42 genera and one outgroup sequence.
One or two legs per specimen were used for genomic DNA extraction using the 96 wells Qiagen DNeasy Blood and Tissue Kit with a modified protocol. Due to the small size of the legs the tissue was manually ground with a disposable pestle in a 1.5 ml tube. The lysate was transferred to 96 well plates. Elution was performed in 50 µl elution buffer. 658 bp products were amplified using PCR primers LCO1490 and HCO2198 (
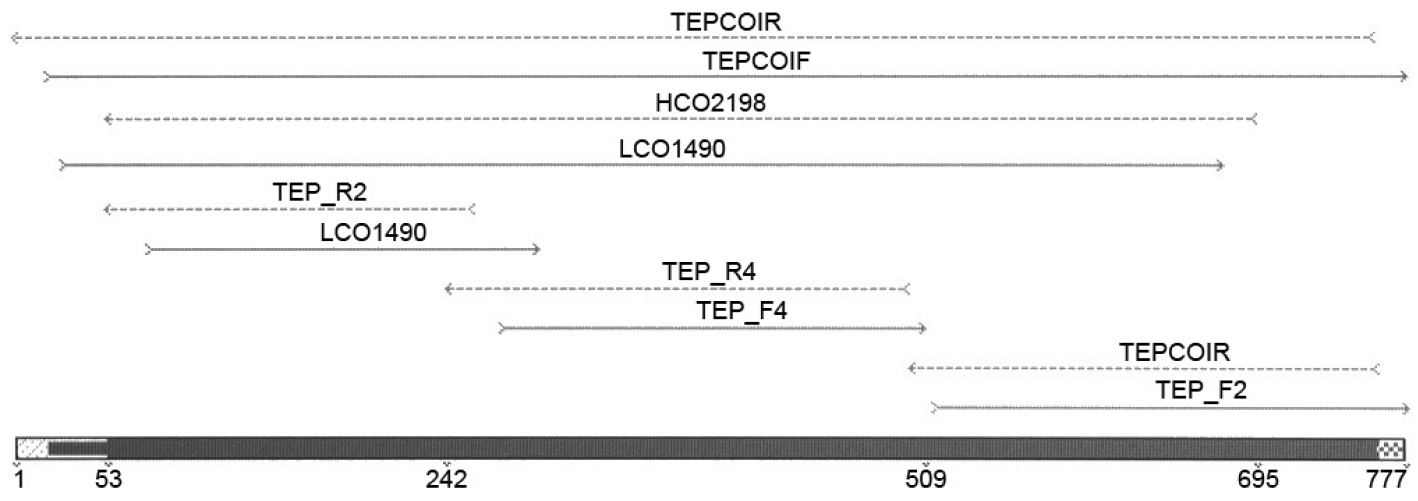
Primer positions within the COI region.
Primer pairs used for amplification of the COI marker.
| Primer name | Primer sequence | Length (in bp) |
|---|---|---|
| L1490 ( |
5’ - GGTCAACAAATCATAAAGATATTGG - 3’ | 658 |
| H2198 ( |
5’ - TAAACTTCAGGGTGACCAAAAAATCA - 3’ | |
| TEP_F2 | 5’ - TAGGAGCAGTAAATTTTAT - 3’ | (+H2198) 211 |
| TEP_R2 | 5’ - CAAAAACTTATATTATTTAT - 3’ | (+L1490) 241 |
| TEP_F4 | 5’ - ATTATAATTGGAGGATTTGG - 3’ | 268 |
| TEP_R4 | 5’ - GTAATTCCTGTTGATCGTATATTAAT - 3’ | |
| TEPCOIF | 5’ - TAAACTTCAGCCATTTAATC - 3’ | 777 |
| TEPCOIR | 5’ - TTTTCCTGATTCTTGTCTAA - 3’ |
The 25 μl PCR reaction mixes contained 18.75 μl of ddH2O, 2.5 μl of 10 × CoralLoad PCR Buffer (Qiagen), 1 μl of each primer (10 pM), 1.25 U of Taq DNA Polymerase (Qiagen), 0.5 μl of dNTP’s and 1 μl of DNA template. The amplification protocol consisted of 3 min at 94 °C followed by 40 to 50 cycles of 15 s at 94 °C, 30 s at 60 °C to 35 °C and 40 s at, 72 °C and a final 5 min at 72 °C.
Direct sequencing was performed at Macrogen, Korea on a ABI 3730XL sequencer.
Sequences recovered did not contain any insertions, deletions, or stop codons. 555 specimens representing 136 different species from various geographical locations were included in the dataset, resulting in a final alignment of 554 ingroup taxa and a single outgroup. Sequences were assembled and adjusted with Sequencher v4.10.1 (Gene Codes Corp.). Bioedit version v7.0.9.0 (
The Neighbour-Joining analyses were performed using MEGA5 (
Additional to the tree-based identification we used an identification based on direct sequence comparison by using each sequence as a query to all other sequences in the dataset. SpeciesIdentifier v1.7.8 (
Finally we included the “All species barcodes” (ASB) criteria as described by
The DNA of the majority of the specimens could be amplified with the standard PCR primers (
The species for which alternative primers have been used for DNA amplification.
| Taxon (no specimens) | Probable reason for failure | Used primer(s) | Additional sequences with |
|---|---|---|---|
| Acanthiophilus walkeri (1) | DNA degraded, specimen stored in ethanol 70% for 7 years | All | 0 |
| Bactrocera oleae (1) | DNA degraded, specimen stored in ethanol 70% | All | 1 |
| Plaumannimyia sp. (1) | ? | TEPCOI | 0 |
| Rhagoletis cerasi (1) | ? | TEPCOI | 4 |
| Rhagoletis cingulata (3) | Taxon-specific mutation at primer site? | TEPCOI | 0 |
| Rhagoletis samojlovitshae (1) | DNA degraded, specimen stored in ethanol 70% for 10 years | All | 0 |
| Sphenella marginata (7) | Taxon-specific mutation at primer site? | TEPCOI, TEP_F2, TEP_R2 & |
0 |
| Tephritis nebulosa (1) | DNA degraded, specimen stored in ethanol 70% for 10 years | All | 0 |
| Terellia colon (1) | ? | TEPCOI | 11 |
| Terellia luteola (1) | DNA degraded, specimen stored in ethanol 70% for 10 years | TEPCOI, TEP_F2, TEP_R2 & |
1 |
| Trupanea cf. metoeca (1) | DNA degraded, specimen stored in ethanol 70% for 2 years | TEPCOI | 0 |
| Trypeta artemisiae (2) | ? | TEPCOI | 1 |
| Ulidia nigripennis (1) | ? | TEPCOI | 0 |
| Urophora ivannikovi (1) | DNA degraded, specimen stored in ethanol 70% for 10 years | All | 0 |
The data are presented in a Neighbour-Joining tree only (Figure 2) for we are merely interested in a distance-based clustering of species based on similarity of the sequences and not a character based clustering of the sequences. Despite the fact that the NJ tree fits very well to both the morphological phylogenetic tree (
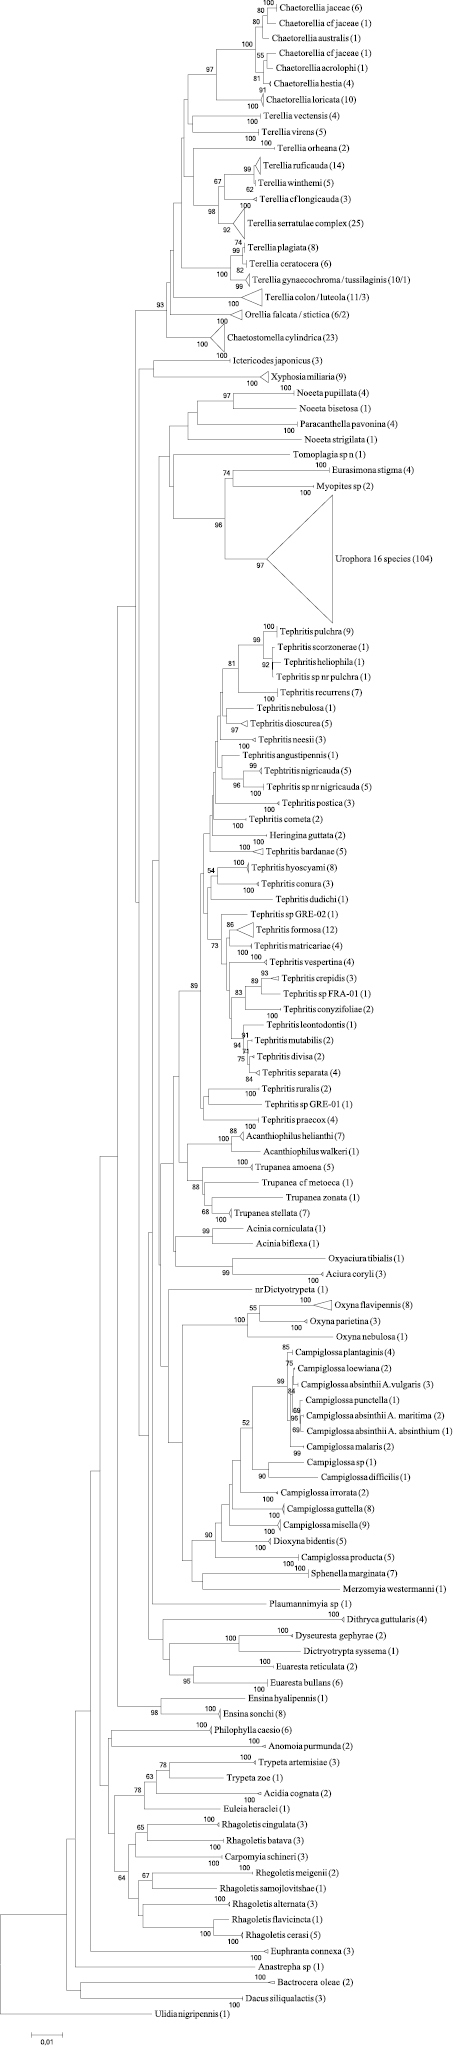
The Neighbour-Joining tree of the entire dataset based on COI barcodes. Terminal branches have been collapsed in order to save space, the total number of specimens is given in brackets and the area surface of the triangle represents the amount of variation. When a terminal branch contains two species, both names are provided as well as their respective number of specimens. If a branch contains more than two species only the number of species as well as the number of specimens are given. Bootstrap values above 50 (1000 replicates) are given at the nodes.
We only focus on the feasibility of DNA barcoding for molecular identification, any probable taxonomic implications of the data generated are not dealt with in this paper.
With some exceptions the COI barcodes in general seem to provide a good molecular marker for identification of European fruit fly species. The mean distances between species was on average 13.2% (0.15–25.27%) whereas within a species this was a mere 0.24% (0–2.80%) (Figure 3). There is no clear barcode-gap for 2.7% of all pairwise comparisons fell between the minimum interspecific distance (0.15%) and the maximum intraspecific distance (2.8%). Among the genera the mean distances were 1.49% (0–8.78%) within and 14.96% (5.92–23.61%) between the genera. The distances between the ingroup genera and the outgroup was 21.18% (17.11–25.72%).
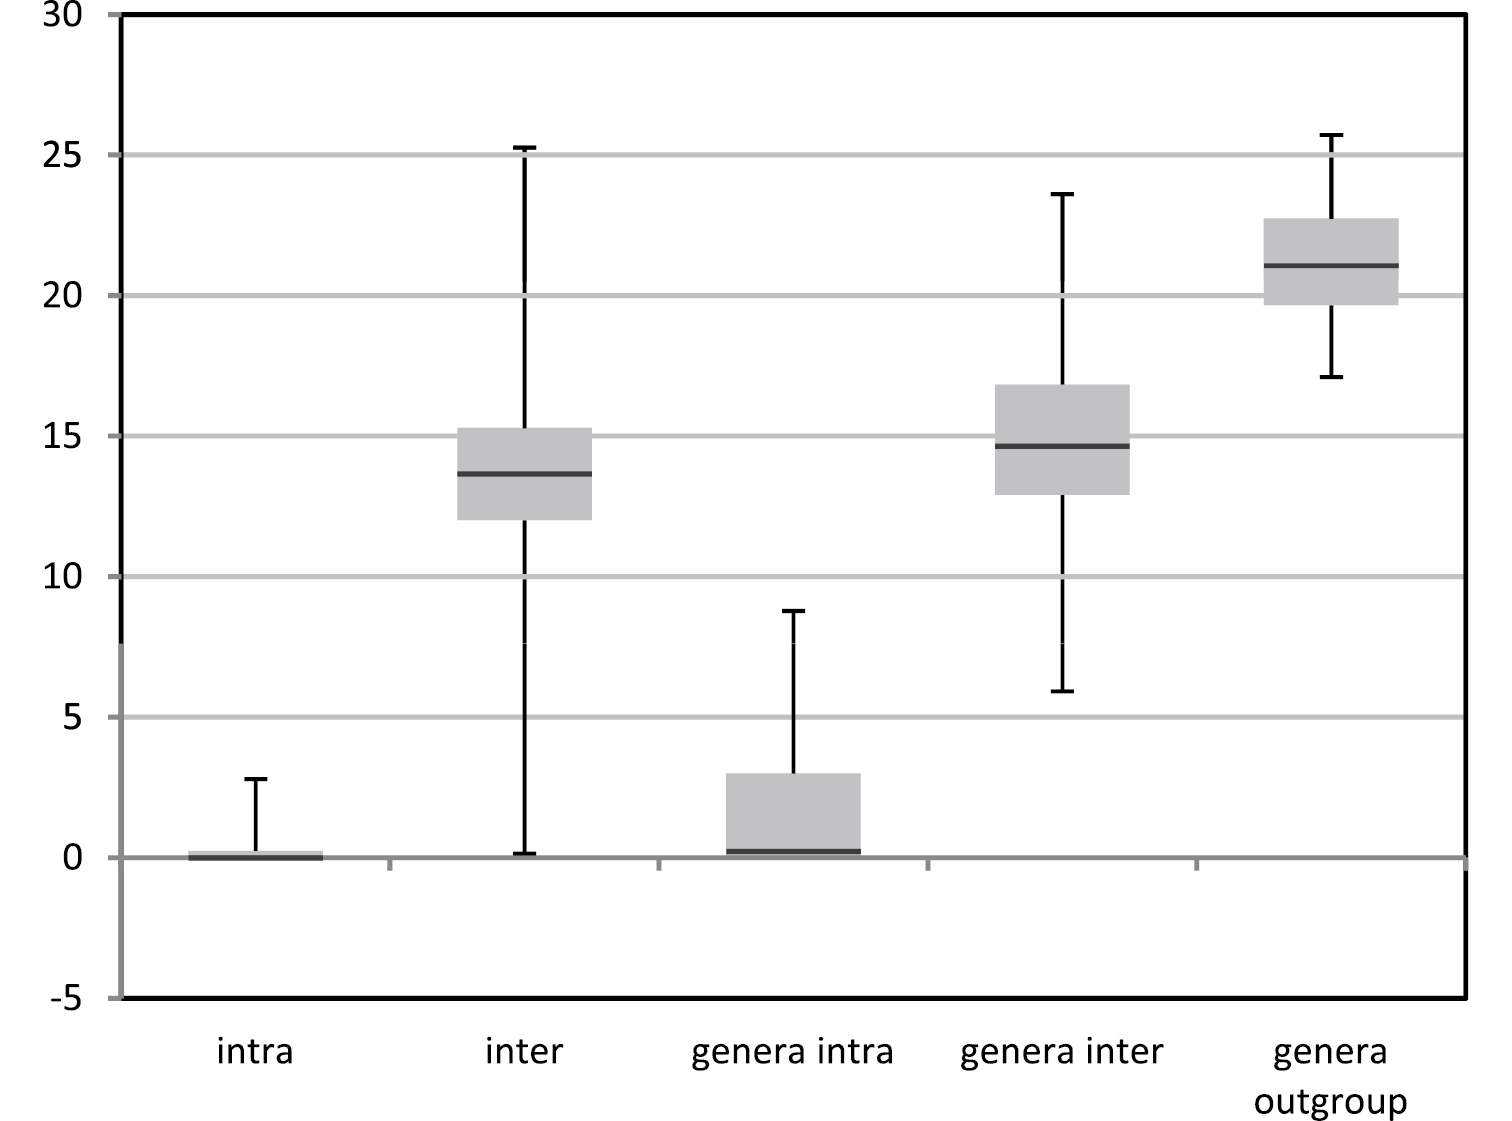
Box plots depicting the variation in mean distances using K2P-distance modeling of sequence divergence for intraspecific, interspecific difference among the species and genera, as well as the ingroup genera with the outgroup genus.
Identification success-rates of all five criteria are given in Table 4. Several species groups within the genus Terellia Robineau-Desvoidy, 1830 and apparently none of the species of Urophora Robineau-Desvoidy, 1830 could reliably be identified using COI barcodes.
Identification rates of all five criteria: Neighbour-Joining (NJT) sensu
| Criteria | Correct ID | Ambiguous | Incorrect ID | No match |
|---|---|---|---|---|
| NJT | 63.25% | 7.38% | 29.37% | - |
| NJT_M | 61.89% | 36.22% | 1.80% | - |
| BM | 78.19% | 12.25% | 9.54% | - |
| BCM (threshold 0.3%) | 73.33% | 10.45% | 3.06% | 13.15% |
| ASB (threshold 0.3%) | 59.63% | 27.02% | 0.18% | 13.15% |
Both criteria NJT and NJT_M give comparable results with the correct identified sequences: 351 and 344 sequences respectively (Table 4). The main difference is among the number of incorrect and ambiguous sequences, for multiple placement immediately identifies the sequences as incorrect according to NJT, whereas if they still have conspecifics at the different nodes they are regarded as ambiguous according to NJT_M: 41 and 163 versus 201 and 10 sequences.
The Neotropical taxa with European congeners clustered within the appropriate genus, often with a distance greater than those among the European taxa of that particular genus.
Campiglossa absinthii (Fabricius, 1805) is placed at three different branches within the NJ tree with slightly lower though similar mean distances as among the other closely related species (Table 5). All three groups originate from different Artemisia host-plants and might therefore represent different host-races, or perhaps even different species. Host-plant names are given in Figure 2 and are abbreviated in Figure 8.
Furthermore the NJ analysis places the genus Dioxyna Frey, 1945 within the genus Campiglossa Randani, 1876 and Heringina Aczél, 1940 within Tephritis Latreille, 1804 both of which are corroborated with the ML and MP analyses.
Mean K2P-distances in percentages between the species of the Campiglossa loewiana-group.
| Campiglossa malaris | ||||||
|---|---|---|---|---|---|---|
| Campiglossa absinthii / on A. vulgaris | 1.07 | |||||
| Campiglossa loewiana | 1.23 | 0.46 | ||||
| Campiglossa punctella | 1.23 | 0.77 | 0.92 | |||
| Campiglossa absinthii / on A. absinthium | 1.23 | 0.77 | 0.92 | 0.30 | ||
| Campiglossa absinthii / on A. maritima | 1.38 | 0.92 | 1.08 | 0.46 | 0.46 | |
| Campiglossa plantaginis | 1.54 | 0.76 | 0.61 | 0.92 | 0.92 | 1.07 |
Under the BM criteria 434 sequences were regarded as correctly identified, 53 incorrectly and 68 as ambiguous. The dataset contains 394 sequences with a closest match at 0%, 56 (14, 21%) of them having an allospecific identical match.
The threshold for the 95th percentile of the intraspecific distances has been calculated at 0.3%. Success under BCM is 73.33% (84.44% of the non-discarded queries), whereas 17 sequences were regarded as incorrectly identified, 58 ambiguous and 73 did not have a match below the threshold, the proportions of TP, FP, FN and TN were 0.733, 0.135, 0.048 and 0.082 respectively.
Under the ASB criteria 331 sequences were correctly identified, 150 were ambiguous, one was misidentified and, like BCM, 73 did not have a match below the threshold.
The discussion is confined to the success-rates of the tree-based identification criteria NJT_M and the similarity-based identification according to the BCM criteria. The numbers are given for the other criteria as well but they are not discussed further (Figure 4). The NJT criteria gives an overrepresentation of incorrectly identified sequences, whereas BM seems to have an overoptimistic prediction of correctly identified sequences (Figure 4) (
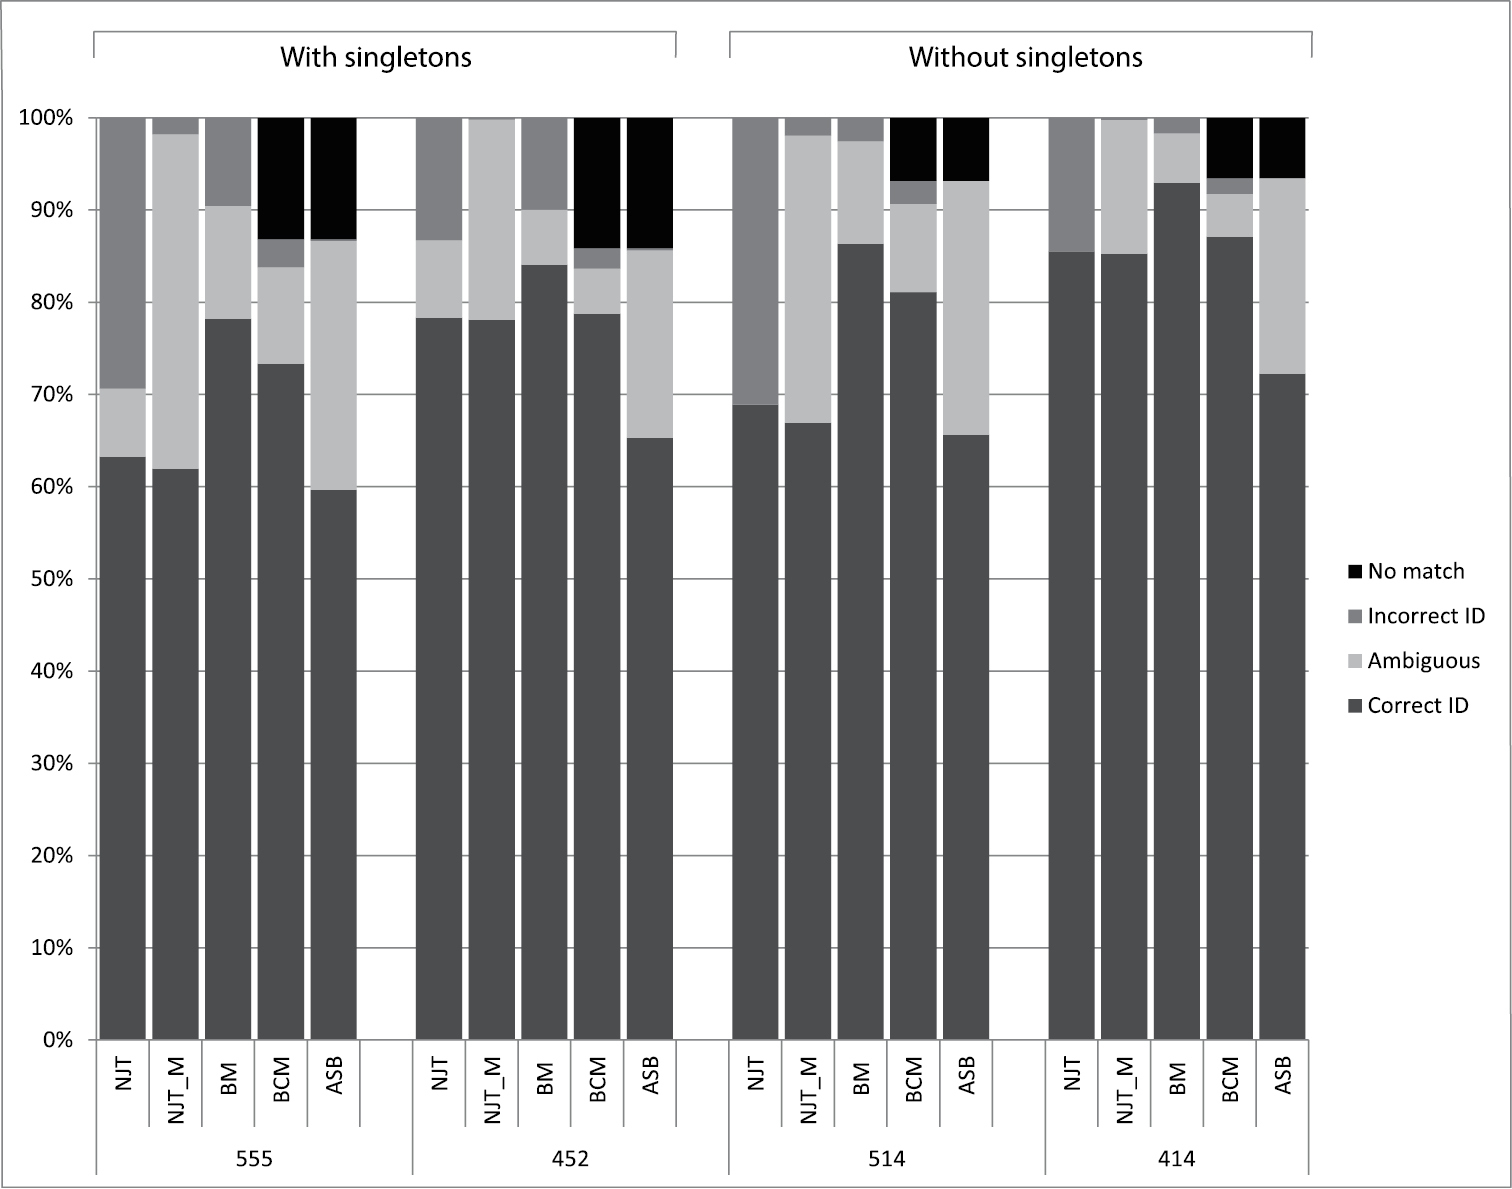
Identification rates of all five criteria: Neighbour-Joining (NJT) sensu
The low success-rate is in part due to singletons and the genus Urophora. Of the 135 species 38 (41 when three Urophora singletons are included) cannot have a match simply because they lack conspecifics (7.39% of the sequences) (
This stripped dataset, e.g. without singletons and without the genus Urophora, results in 87.1% of all queries and 93.23% of the not discarded queries as correctly identified, which is similar though slightly lower than the dataset of interceptions of
The threshold value in BCM is of strong influence on the results, as already noted by
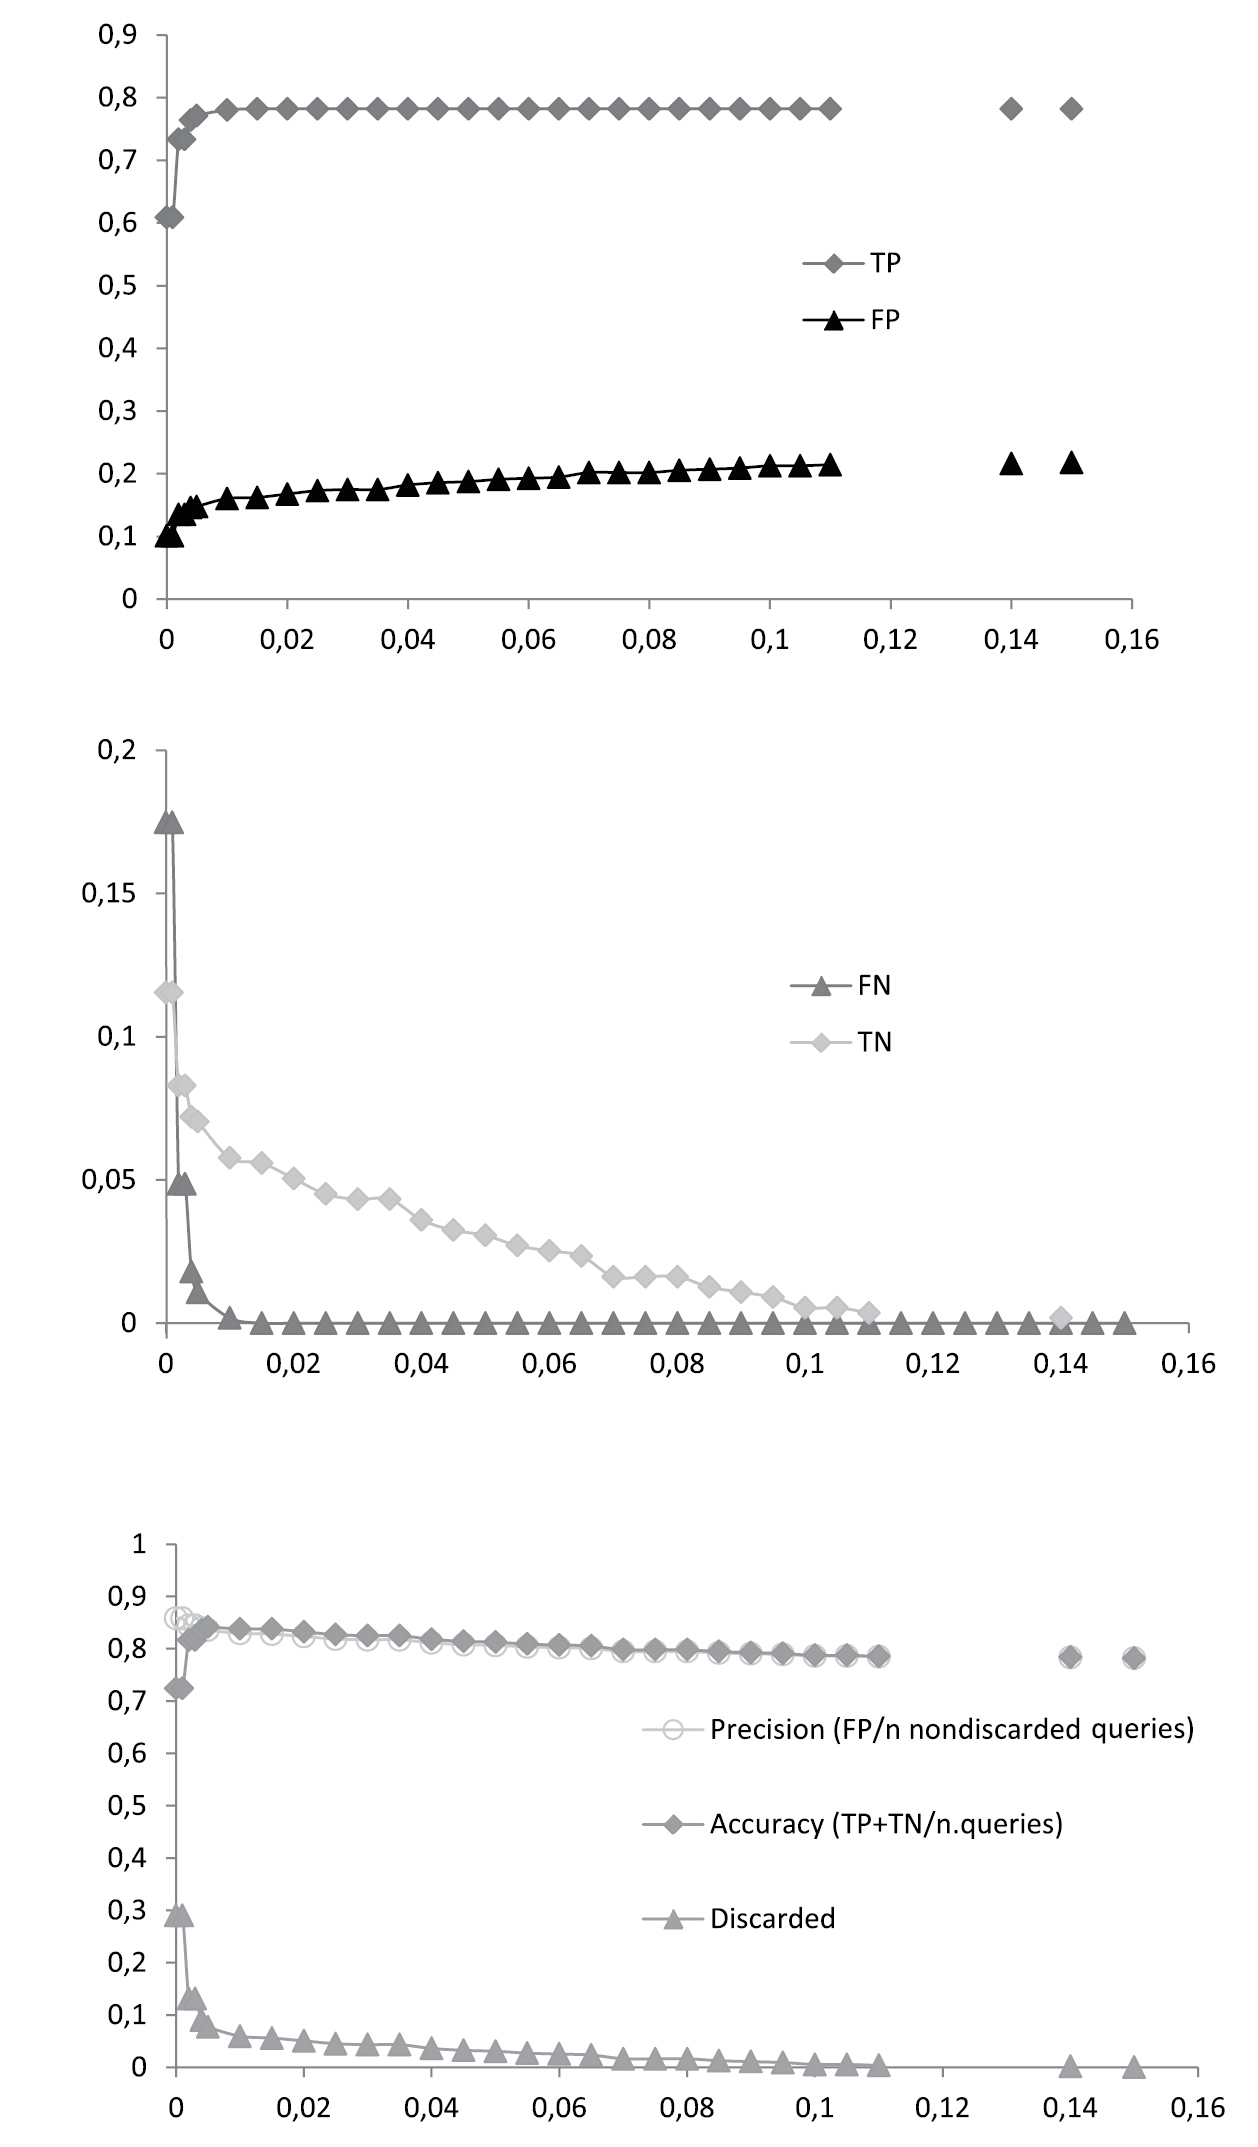
Best Close Match (BCM) identification of the entire dataset (n = 555). Proportions of true positives (TP), false positives (FP), false negatives (FN) and true negatives (TN) are given for 30 arbitrary distance thresholds ranging from 0.15 to 0.00. For each threshold the percentages of precision, accuracy and discarded queries were calculated.
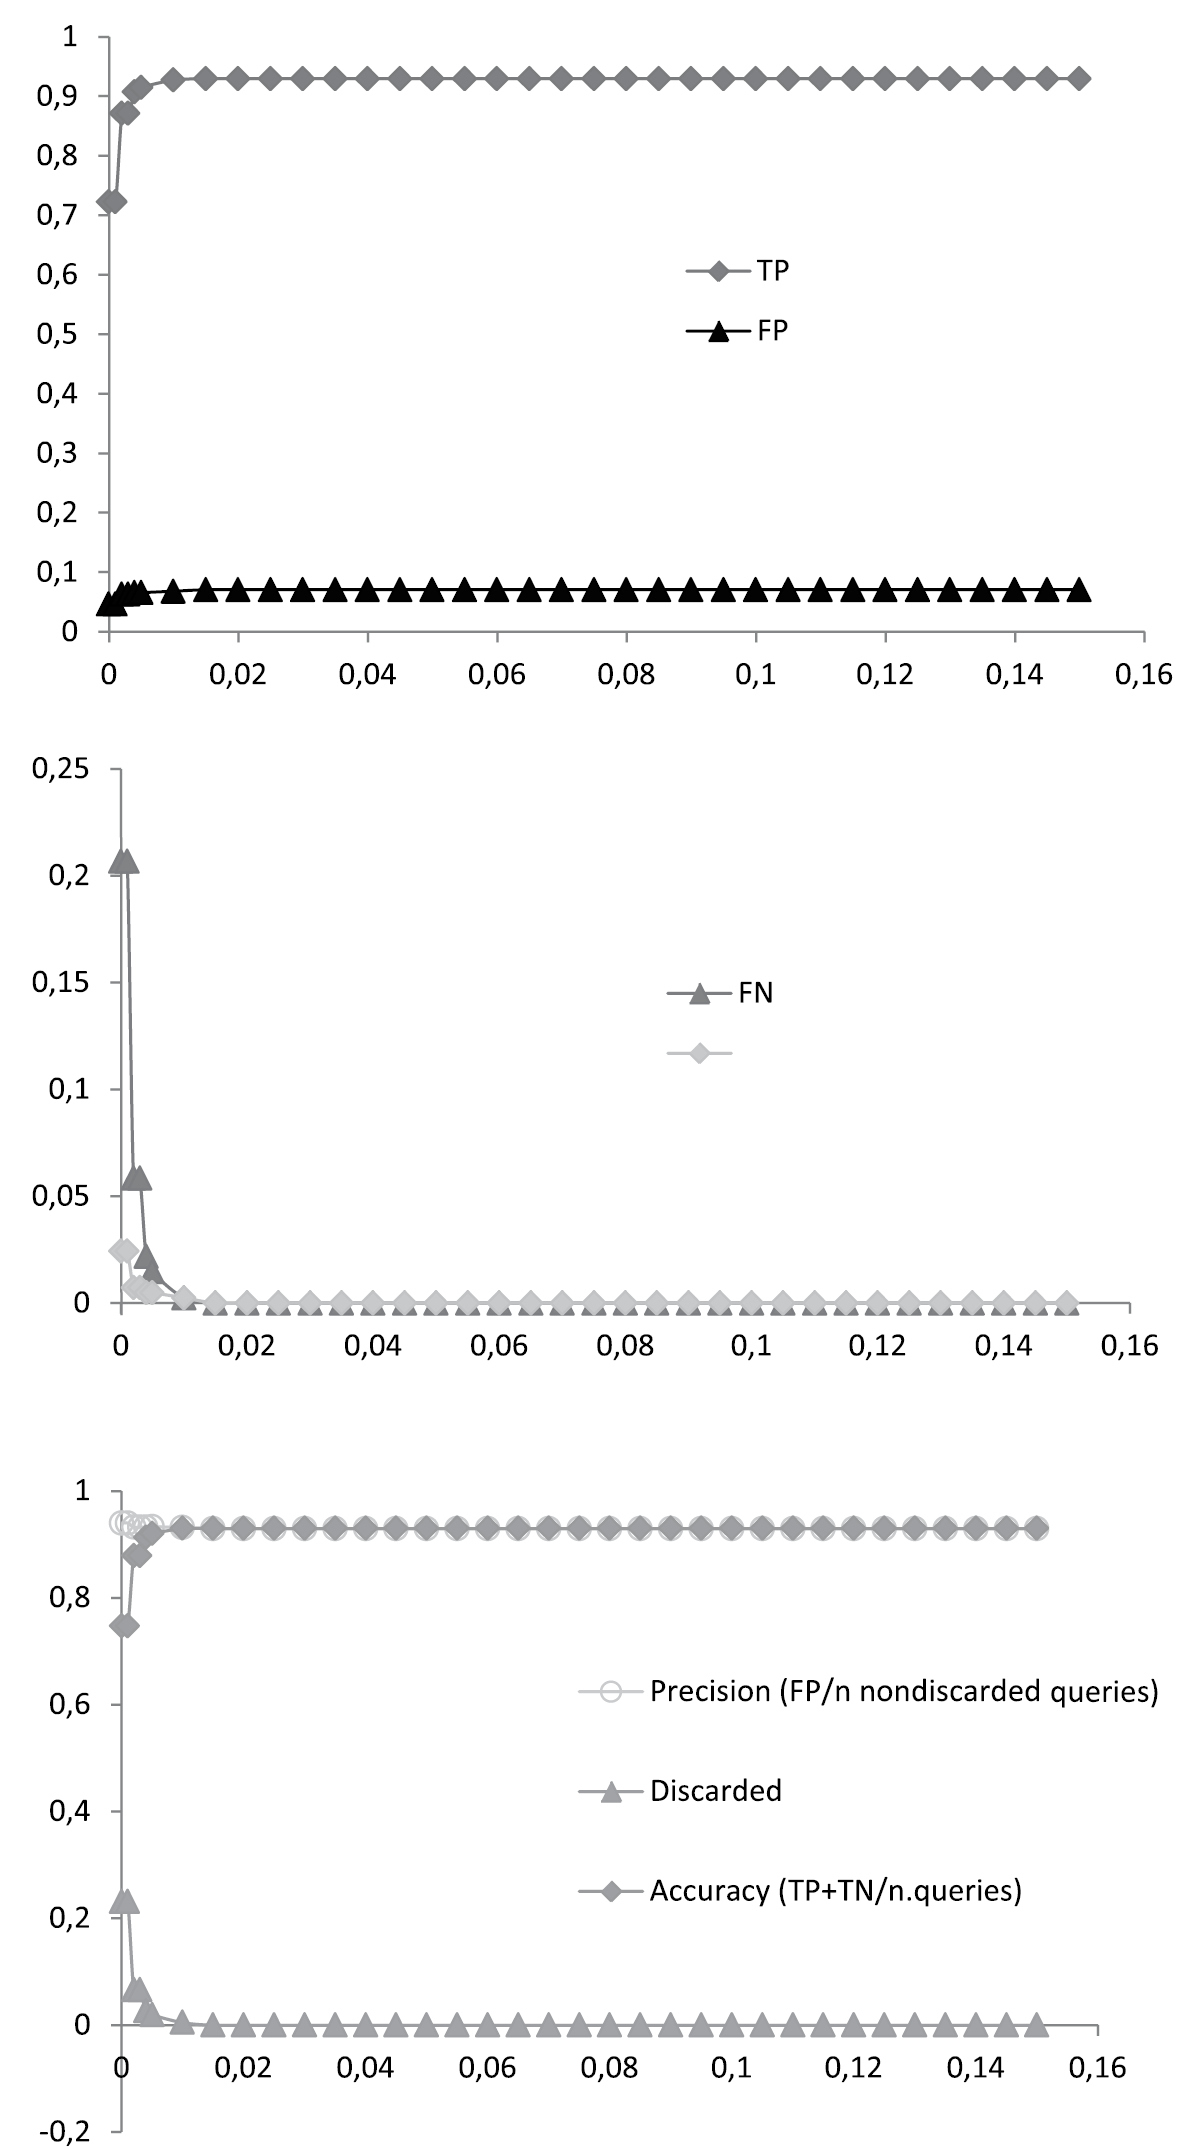
Best Close Match (BCM) identification of the stripped dataset, e.g. excluding singletons and Urophora (n = 414). Proportions of true positives (TP), false positives (FP), false negatives (FN) and true negatives (TN) are given for 30 arbitrary distance thresholds ranging from 0.15 to 0.00. For each threshold the percentages of precision, accuracy and discarded queries were calculated.
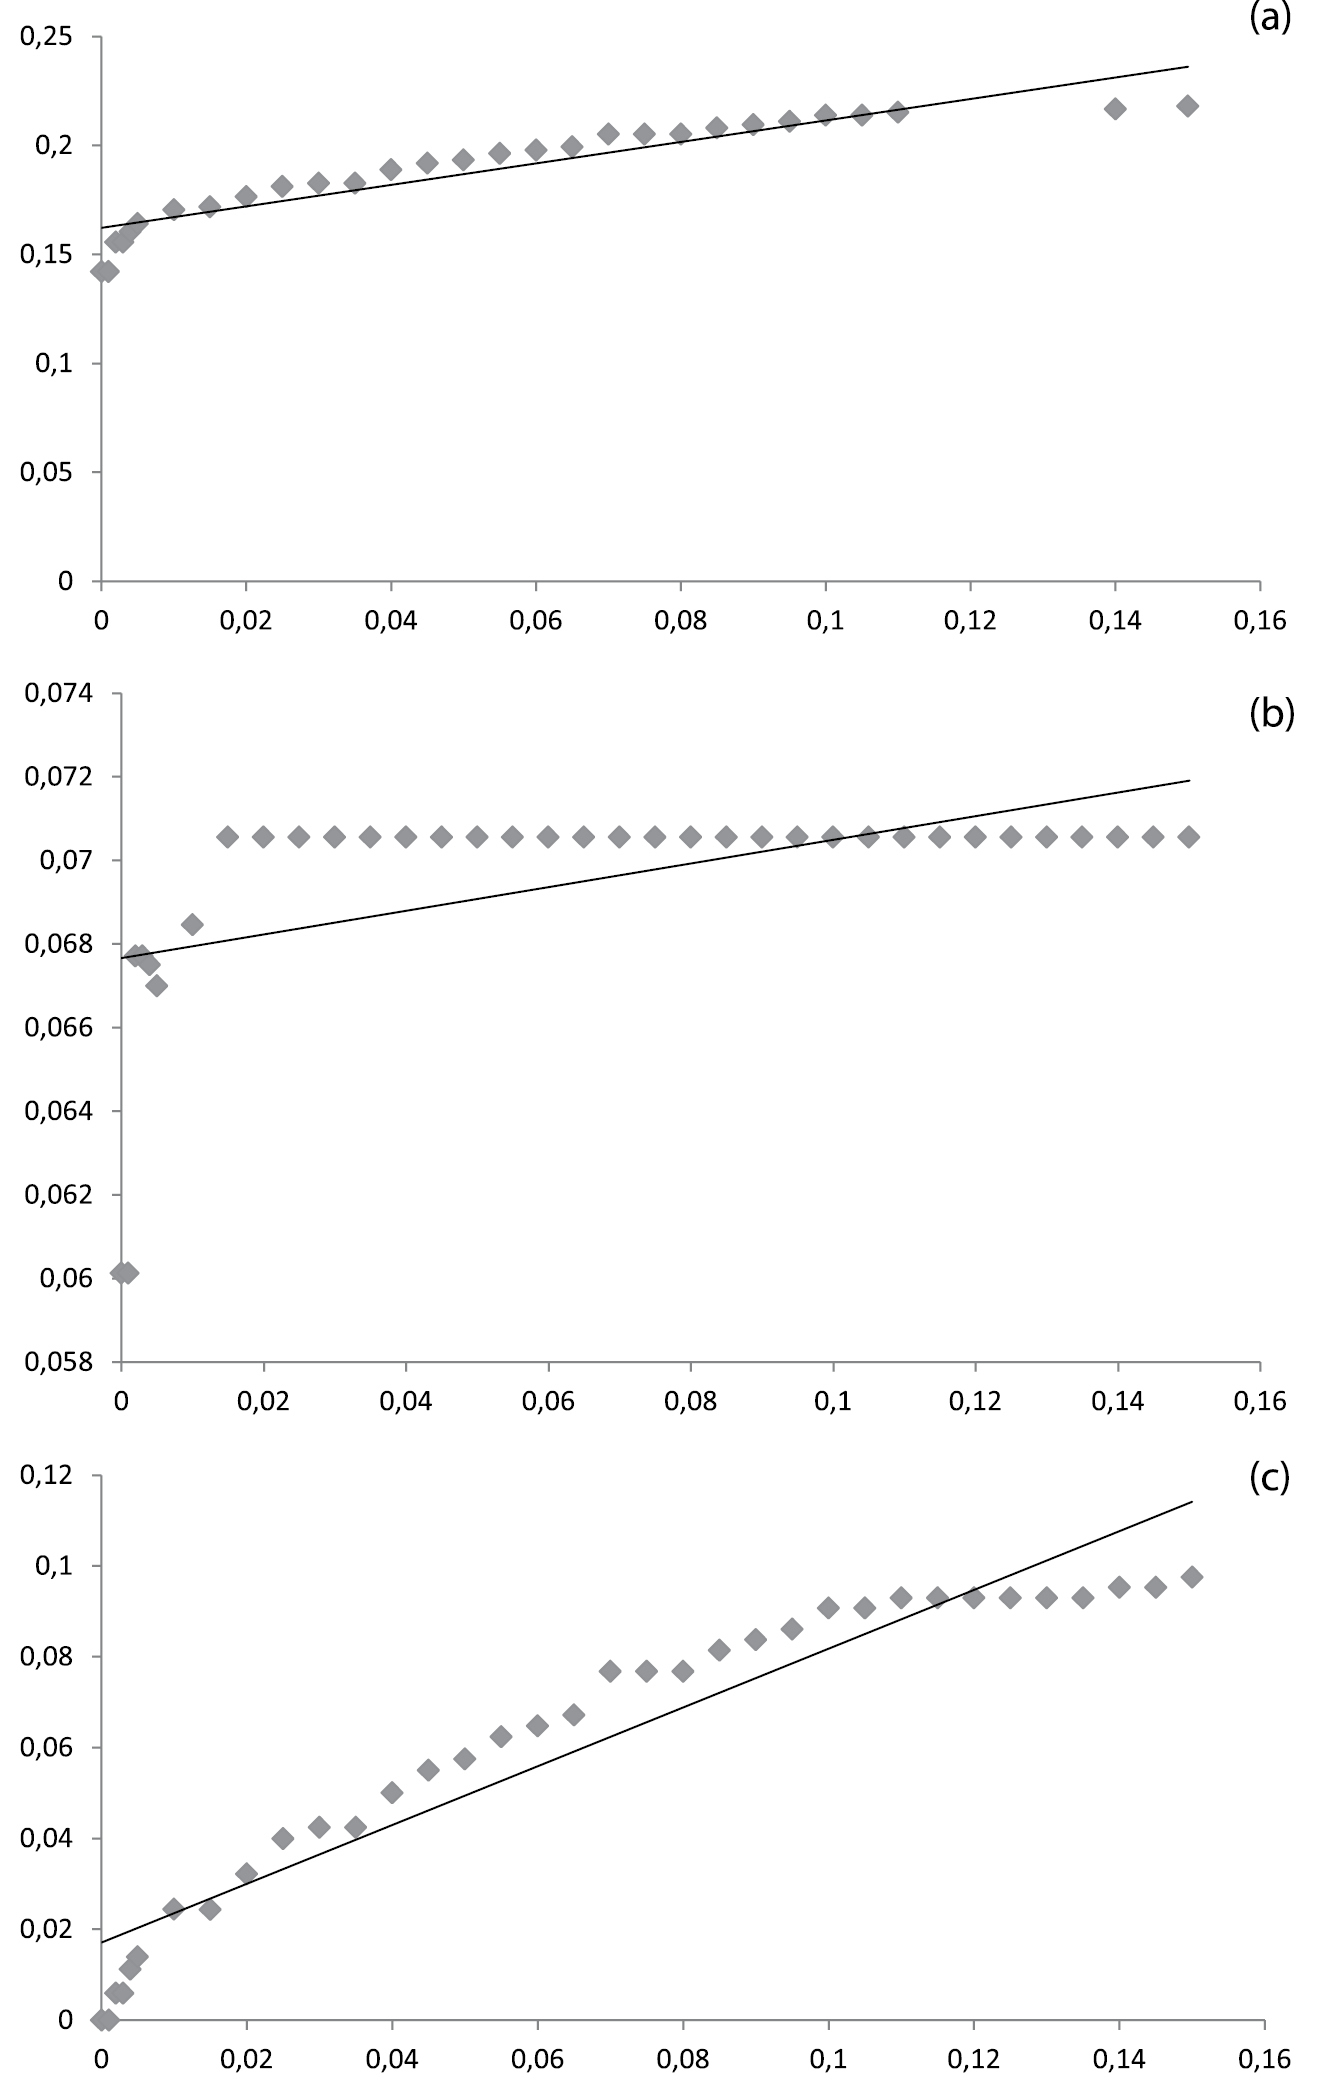
Relative ID errors at 30 arbitrary threshold values for a. the entire dataset (n = 555), b. the stripped dataset, e.g. excluding singletons and Urophora (n = 414) and c. the stripped dataset excluding the problematic Terellia groups. Linear regression was used to infer the ad hoc threshold for the 95th percentile of the correctly identified queries and the relative ID error does not exceed 5%. In (a) and (b) this value is below 0.00, only in (c) this value is positive: 0.051 (R-square 0.91).
Distinguishing between true and false positives and negatives is based on morphological identification of the voucher specimens. Therefore taxonomic specialists are needed to build and check the reference database that can be used for molecular identification. Adding more morphologically correctly identified specimens will increase the understanding of the limitations of molecular identification for that particular group (
The species of the genus Campiglossa can be identified using DNA barcodes, showing a neat mean distance of 5.2%. Looking in detail, however, shows it has a very broad range of interspecific distances, from 0.3 to 8.7%. Grouping the species into their known morphological species complexes (
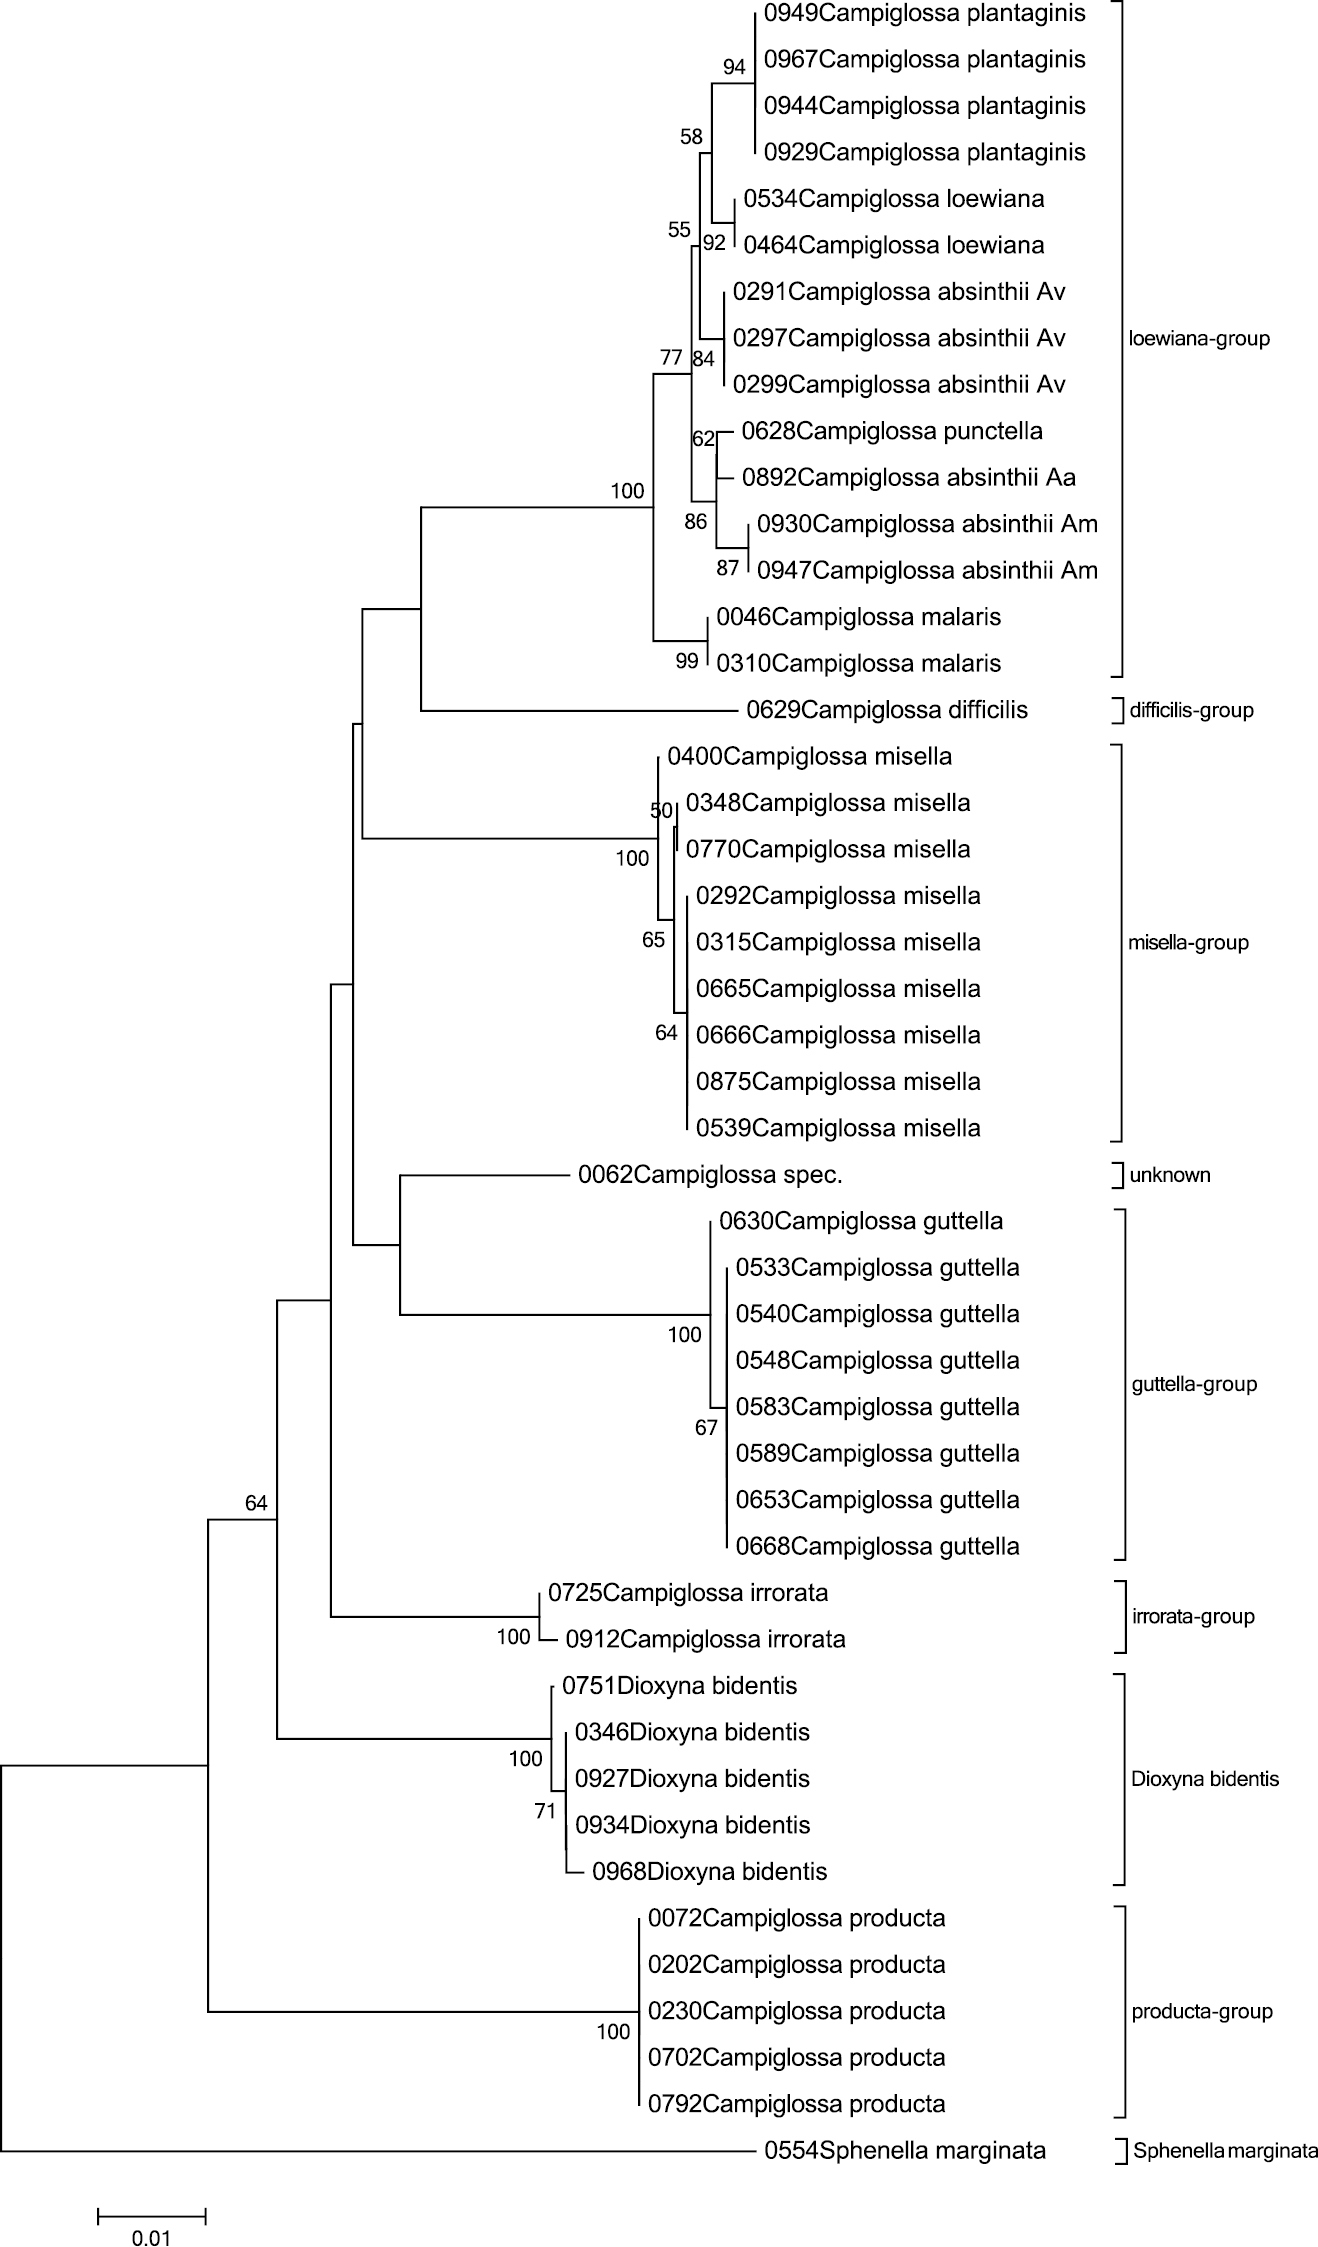
The Neighbour-Joining tree of the genus Campiglossa with Sphenella marginata as outgroup inferred from COI barcodes. Bootstrap values above 50 (1000 replicates) are given at the nodes.
Executing a BLAST on the BOLD database with one sequence of Campiglossa malaris Séguy, 1938 from our dataset retrieved no less than 18 sequences with a similarity of over 98%, belonging to 5 different species apart from the target species. Excluding Campiglossa malaris itself, the sequence with the highest similarity was one belonging to a Nearctic species, Campiglossa farinata (Novak, 1974) with a similarity of 99.08%. Furthermore, no less than six sequences showed a similarity of 98.93% belonging to two different species.
These differences in mean distances, especially the short ones among the loewiana group, indicate that it is important to include as many sequences of distinct populations per species as possible in a reference database like BOLD to preclude misidentification.
Adding specimens from geographically distinct populations is necessary in order to shed some light on the intraspecific variation caused by geography (
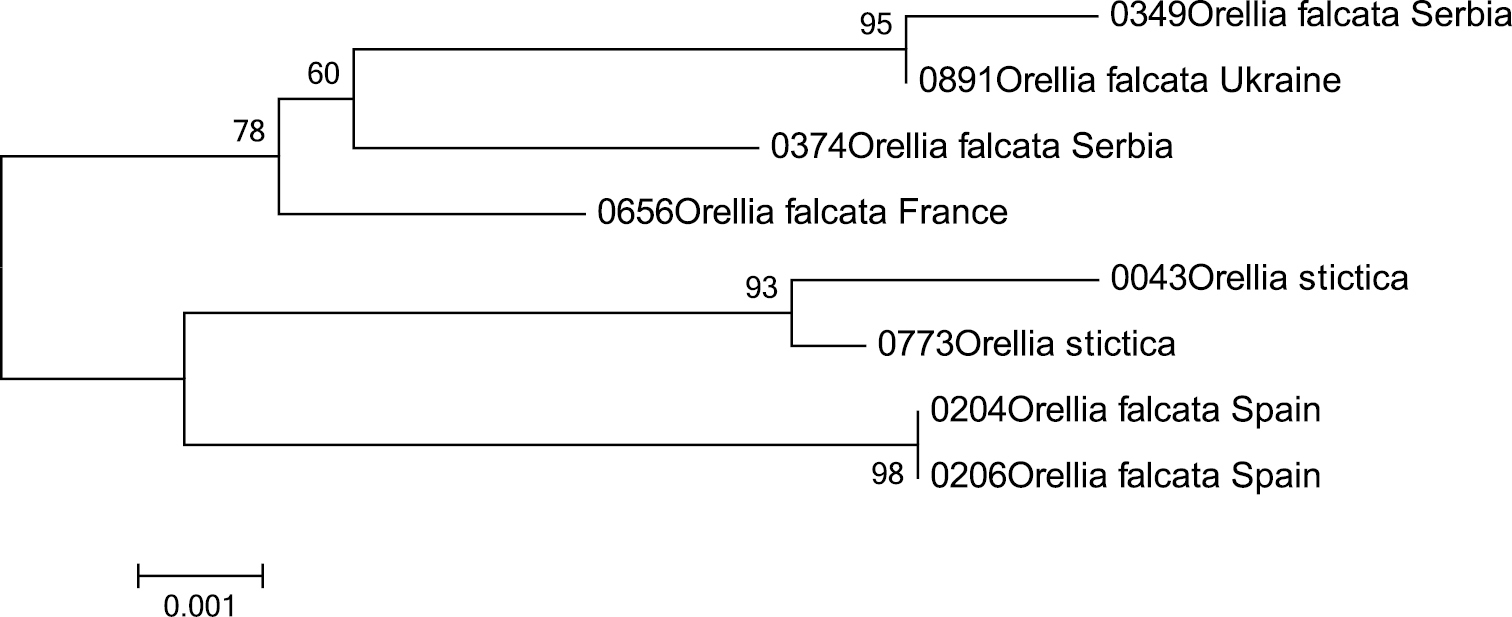
The Neighbour-Joining tree of the genus Orellia inferred from COI barcodes. Bootstrap values above 50 (1000 replicates) are given at the nodes.
Likewise it is necessary to add specimens of ecologically distinct populations as well, as is shown by the three ‘host-races’ of Campiglossa absinthii and by
Looking at the NJ tree (Figure 2, 10) it is immediately obvious that the species of the genus Urophora cannot be separated using DNA barcodes.
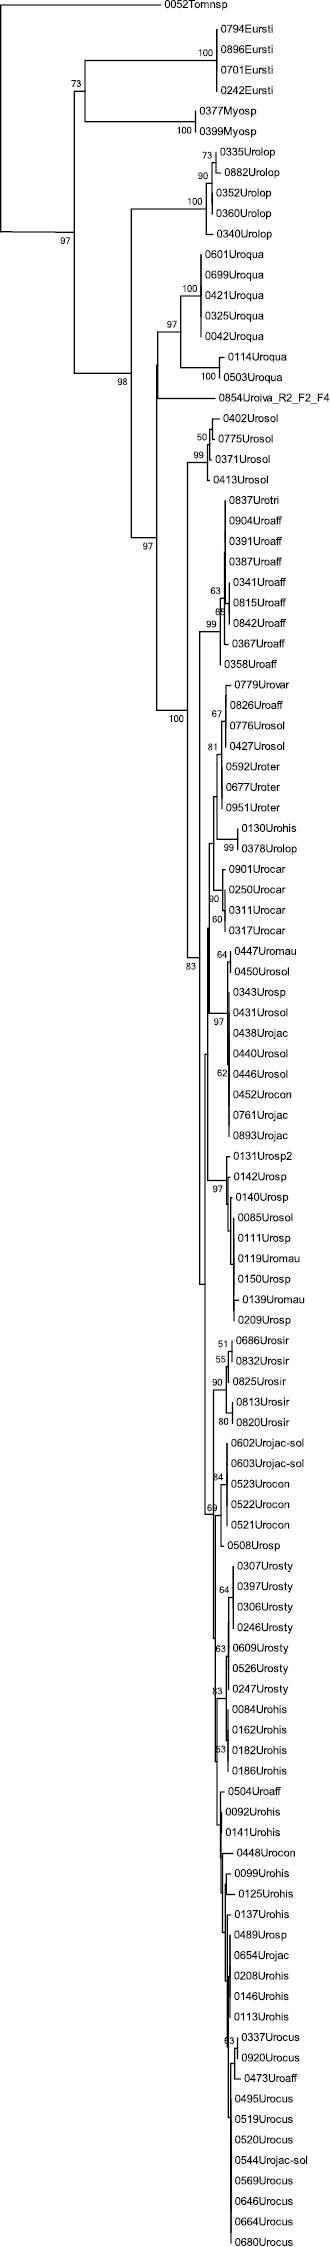
The Neighbour-Joining tree of the genus Urophora inferred from COI barcodes. Bootstrap values above 50 (1000 replicates) are given at the nodes.
As is shown above, the feasibility of the use of DNA barcodes for molecular identifications relies heavily on the contents of the database used to BLAST against (
We conclude that molecular identification of Tephritids using DNA barcoding is possible but should be treated with care due to varying performance within this group as is shown by the dataset analysed here. Even when threshold values are added groups will remain that cannot reliably be identified. We stress that a better performance is strongly dependent on an increasing input of morphologically identified specimens, containing multiple specimens of different geographical populations and different ecologies covering as much of the range of the species as possible, otherwise it remains difficult to detect cryptic species and estimate true diversity. Threshold values for both distance and relative ID error, as well as distinction between positives and negatives, both true and false, should not only be used to improve the reliability of the success for molecular identification but also to identify the problematic groups for molecular identification. These groups should be flagged in the reference database and alternative markers for molecular identification should be tested.
We thank the following persons for providing material used in this study: Kees van Achterberg (Leiden, the Netherlands), Berend Aukema (Wageningen, the Netherlands), Theodoor Heijerman (Wageningen, the Netherlands), Guido Keijl (Bakkum, the Netherlands), Roy Kleukers (Leiden, the Netherlands), Severin and Valery Korneyev (Kiev, Ukraine), Kim Meijer (Groningen, the Netherlands), Gerard Pennards (Zeist, the Netherlands), Gordon Ramel (Serron, Greece), Jeff Skevington (Ottawa, Canada), J. Smit (Duiven, the Netherlands), Wouter van Steenis (Breukelen, the Netherlands) and Theo Zeegers (Soest, the Netherlands). Furthermore we thank Menno Reemer for the help and discussions on the analysis. We also thank Valery Korneyev and Ho-Yeon Han for valuable comments on an earlier draft of this paper. Lastly we thank Allan Norrbom and two other anonymous reviewers for their valuable comments.
Collection data of all specimens included in this study. (doi: 10.3897/zookeys.365.5819.app) File format: Adobe PDF file (pdf).