


(C) 2012 Fabian Reichenbach. This is an open access article distributed under the terms of the Creative Commons Attribution License 3.0 (CC-BY), which permits unrestricted use, distribution, and reproduction in any medium, provided the original author and source are credited.
For reference, use of the paginated PDF or printed version of this article is recommended.
Sexual dimorphisms in shell-bearing snails expressed by characteristic traits of their respective shells would offer the possibility for a lot of studies about gender distribution in populations, species, etc. In this study, the seven main shell characters of the snail Cochlostoma septemspirale were measured in both sexes: (1) height and (2) width of the shell, (3) height and (4) width of the aperture, (5) width of the last whorl, (6) rib density on the last whorl, and (7) intensity of the reddish or brown pigments forming three bands over the shell. The variation of size and shape was explored with statistical methods adapted to principal components analysis (PCA) and linear discriminant analysis (LDA). In particular, we applied some multivariate morphometric tools for the analysis of ratios that have been developed only recently, that is, the PCA ratio spectrum, allometry ratio spectrum, and LDA ratio extractor. The overall separation of the two sexes was tested with LDA cross validation.
The results show that there is a sexual dimorphism in the size and shape of shells. Females are more slender than males and are characterised by larger size, a slightly reduced aperture height but larger shell height and whorl width. Therefore they have a considerable larger shell volume (about one fifth) in the part above the aperture. Furthermore, the last whorl of females is slightly less strongly pigmented and mean rib density slightly higher. All characters overlap quite considerably between sexes. However, by using cross validation based on the 5 continuous shell characters more than 90% of the shells can be correctly assigned to each sex.
Sexual dimorphism, shell features, C. septemspirale, PCA ratio spectrum, allometry ratio spectrum, LDA ratio extractor
Molluscs can be hermaphrodites or gonochoristic organisms with separate sexes throughout their life span, with the latter group sometimes being subject to differing phenotypic traits. Sexual dimophism has been recorded for unionoid mussels as well as for some marine, freshwater and terrestrial snails (for examples see:
Sex determination without harming the living individuals often is a problem. Usually, the animals hide inside the shell, what makes it impossible to determine its sex. The solution for this problem could be a method that helps to distinguish between the sexes based on sex-related shell features. This could also help to analyse the sex ratio within given populations even when only shells are available, as often is the case in malacology and particularly in museum’s collections.
Quite recently,
In their papers on the systematics of Pyrenean and Cantabrian cochlostomatid species,
In this study, Cochlostoma septemspirale (Razoumowsky, 1789) is used to find such sex-related shell features. The distribution of Cochlostoma septemspirale extends from the Pyrenees to southern Germany and the central Balkans (
For analysing differences between males and females, only mature individuals have been tested. These can be recognised by a thickened outer lip (
The aim of this study was to analyse different shell characteristics of 5 populations with 30–50 individuals per population. The seven main characters were (1) height and (2) width of the shell, (3) height and (4) width of the aperture, (5) width of the last whorl, (6) rib density on the last whorl, and (7) intensity of the reddish or brown pigments forming three bands over the shell (for definition of measurements, see Fig. 1).
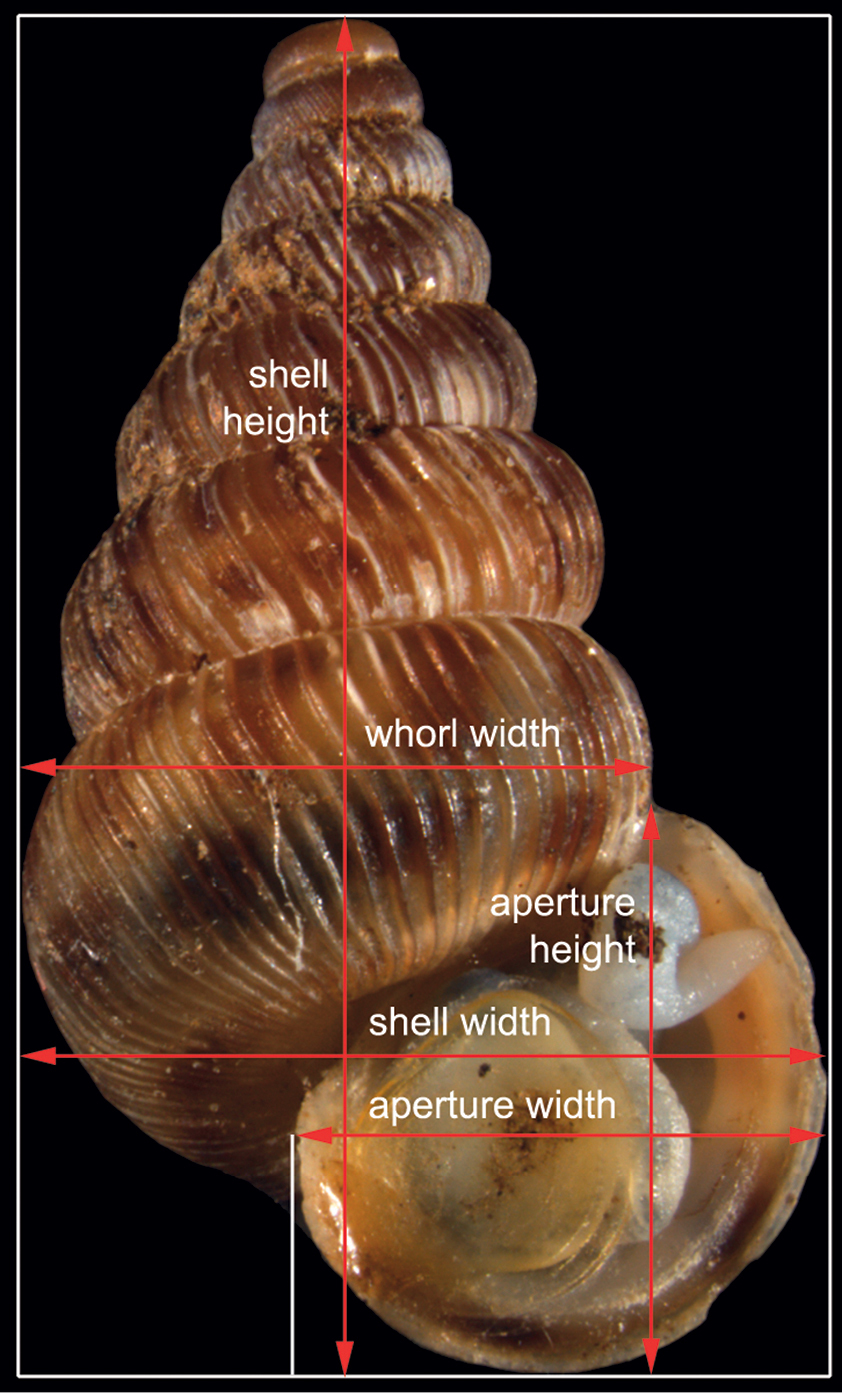
The 5 distances measured on the shell of Cochlostoma septemspirale: shell height and width, aperture height and width, and whorl width.
The collection of the 220 samples of Cochlostoma septemspirale was performed during two days in the Jura. Here, 6 sites had been sampled; the collection time on each site was about an hour. All collected specimens were preserved in plastic bags and later processed in the lab.
LocalitiesSnails have been collected on the 5th and on the 19th of April. The first site was situated above Le Landeron (NE) (6 individuals); the second site was above La Neuveville (BE) (42 individuals), and the third site near Orvin (BE) (35 individuals) On the19th of April, the first two sites were situated near Nods (BE) with 35 and 47 individuals respectively; the last site was on the Twannberg (BE) (55 individuals). The habitat structure of these sites was similar: south-facing slopes, mainly beech forest, with some interspersed little limestone boulders; usually with low shrubs and a herb layer and also a moderately thick layer of foliage. For more information to the localities refer to Appendix 1.
Separation of the sexesTo sex the collected specimens, it is necessary to check the genital organs of each specimen. This cannot be done in the contracted state, when the animal is retracted in the shell with the operculum closing the aperture. To relax the animals, they were stored in bottles filled with water over night. In a next step, the relaxed specimens were poured with boiling water to fix them in the expanded state. After this procedure, males and females could easily be separated with the naked eye even. Only in three cases, the stereo-microscope was needed. All individuals were stored in alcohol (85%) until the next step.
Measurements and conservationEach specimen was photographed in a standardized orientation in up to 10 subsequent steps using a microscope camera (Leica DFC425). Afterwards, these multifocus images where combined to a single image by using ImageAccess Standard software. The measuring module of this software provided then measurements of height and width of shell, height and width of aperture and the width of the last whorl. The numbers of ribs on the last whorl and the pigmentation were also examined on the photos. Each specimen was stored in a glass tube with an individual number and preserved in 85% alcohol. Each lot received a catalogue number and was stored in the collection of the NMBE providing individual access to each specimen. All photos are stored on the NMBE Server and are available for subsequent research.
Data analysisContinuous characters (measurements): 5 continuous variables (Table 1) were treated with a multivariate analysis in order to explore the most significant variation in size and shape of the shell. According to
Range, interquartile range, median, and number of specimens of each sex for the 5 distance measurements. Significance levels of t-test: ‘***’ p < 0.001, ‘**’ p < 0.01, ‘*’ p < 0.05, ‘.’ p < 0.1, ‘ ’ p < 1. All measurements in μm.
| shell height *** | ||||||
| sex | min. | 1st quartile | median | 3rd quartile | max. | N |
| females | 6915 | 7428 | 7572 | 7780 | 8261 | 104 |
| males | 6549 | 6956 | 7120 | 7271 | 7873 | 116 |
| shell width | ||||||
| sex | min. | 1st quartile | median | 3rd quartile | max. | N |
| females | 3615 | 3822 | 3878 | 3954 | 4207 | 104 |
| males | 3573 | 3837 | 3929 | 4003 | 4332 | 116 |
| aperture height *** | ||||||
| sex | min. | 1st quartile | median | 3rd quartile | max. | N |
| females | 2249 | 2535 | 2596 | 2681 | 2953 | 104 |
| males | 2189 | 2587 | 2689 | 2772 | 2962 | 116 |
| aperture width | ||||||
| sex | min. | 1st quartile | median | 3rd quartile | max. | N |
| females | 2166 | 2504 | 2564 | 2652 | 2902 | 104 |
| males | 2161 | 2456 | 2564 | 2650 | 2893 | 116 |
| whorl width *** | ||||||
| sex | min. | 1st quartile | median | 3rd quartile | max. | N |
| females | 3069 | 3202 | 3258 | 3325 | 3531 | 104 |
| males | 2994 | 3117 | 3175 | 3228 | 3383 | 116 |
To examine how well the sexes are separated, the data were subjected to a linear discriminant analysis (LDA). The performance of the LDA was assessed by means of cross validation (
The rib density (ribs/mm) on the last whorl was determined on the same photographs that were used for taking measurements. For counting the ribs, the last whorl was magnified on the screen. The total number of ribs on the last whorl was divided by whorl width in mm.
Pigmentation has been recorded at the nominal level. There was no intention to include it in the PCA, because PCA has only been used for a size and shape analysis. To determine the intensity of the reddish or brown pigments, that form three bands over the shell, we also used the photographs of the specimens. The pigmentation was determined on the last whorl of the shell. The intensity of the bands was difficult to classify, so first the senior author worked out an appropriate method for classifying the intensity of pigmentation. Finally, a 3-level classification scheme (0 = missing band, 1 = interrupted band, and 2 = continuous band) was adopted and the shells were classified in a first run by the senior author. To avoid any bias, that easily might be introduced by a person involved in the study, an independent person repeated the classification of specimens in a second run.
All statistical and graphical analyses were performed with R, version 2.11.1 (
The data underpinning the analyses reported in this paper are deposited in the Dryad Data Repository at doi: https://doi.org/10.5061/dryad.ns7v7.
Results Size and shape analysis of distance measurements:To get an overview, the range, interquartile range and median of the 5 continuous shell characters are given in Table 1. The shells of females are higher and the last whorl is wider compared to males, whereas the aperture is higher in males (t-tests, p < 0.001). For the two remaining characters, no significant differences between sexes were found.
The multivariate analysis offered a closer look concerning the variation in size and shape of the shells of Cochlostoma septemspirale. As mentioned in the Material and methods section, we calculated isosize (i.e., the geometric mean of all variables) as a general size measure. Although the range was more or less overlapping, mean isosize was significantly higher for females compared to males (Wilcoxon test, p < 0.01).
A principal component analysis (PCA) performed in isometry free shape space allowed us to explore variation in shape. The scree graph (not shown) suggested the first two principal components (PC) which explained 80.4% of the total variance in the data. In Figure 2, the scatterplot of shape PC1 against shape PC2 is presented. In the graph, a distinct shift in the shape of females and males is evident, as the two cluster of points are only moderately overlapping. The shift is rather pronounced along shape PC1, but only weakly discernible along shape PC2. For the interpretation of the two components we used the PCA ratio spectrum (Fig. 3) as detailed by
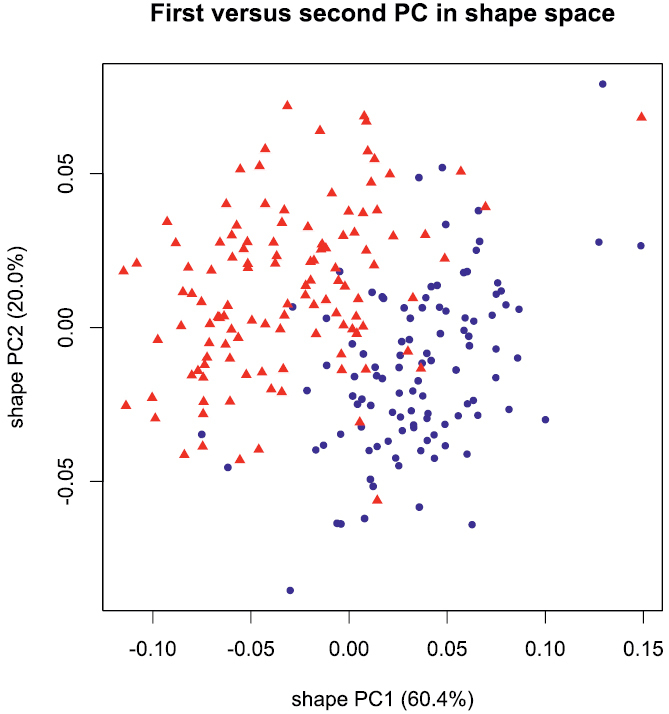
Scatterplot of first against second principal component in shape space; blue dots females, red triangles males.
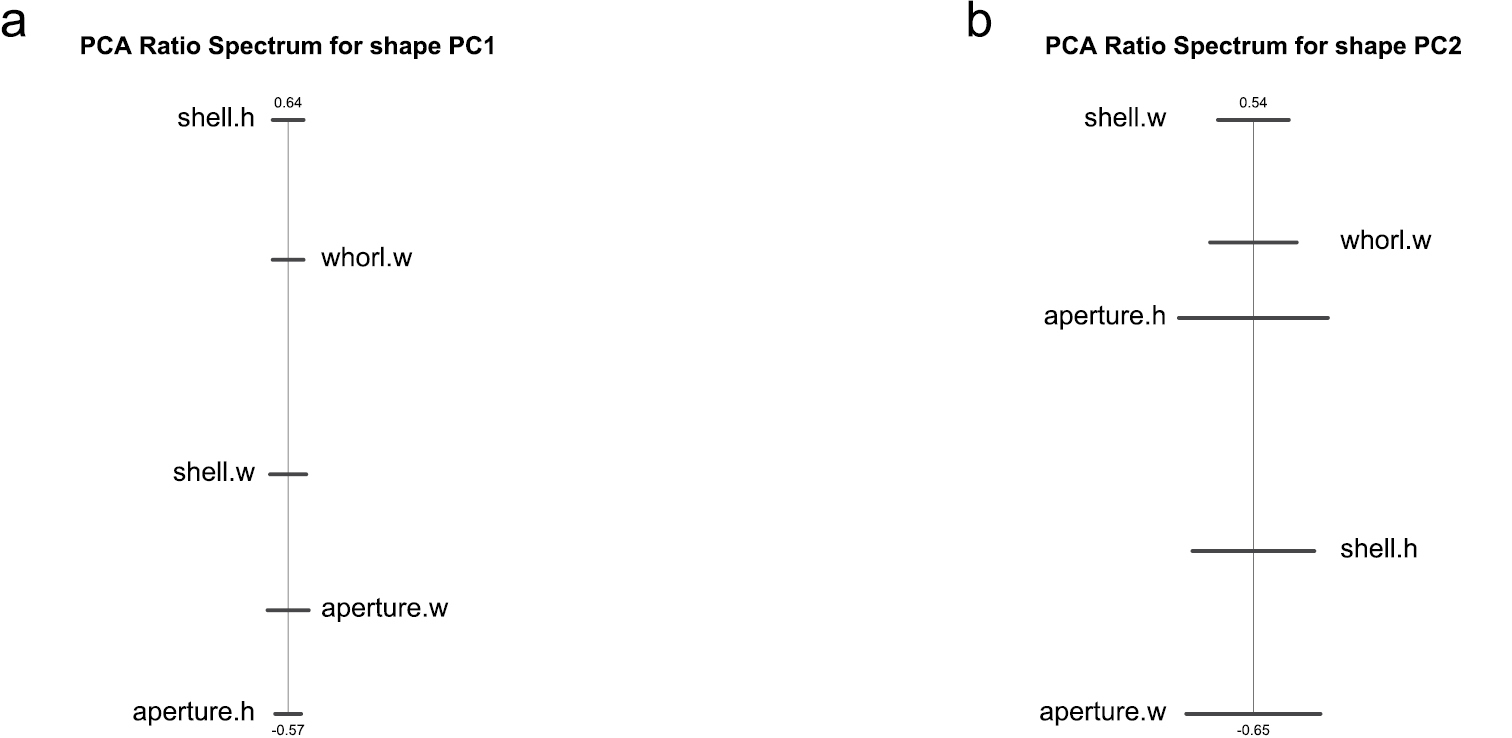
PCA ratio spectrum of first (a) and second principal component (b) in shape space.
The first ratio, shell height:aperture height, showed a large mean difference between sexes (Wilcoxon test, p < 0.001; Fig. 4a). Females have a larger shell height as well as a smaller aperture height than males (Table 1). Because the width of the last whorl is also larger in females (Table 1), their shells should have considerably more volume in the part above the aperture. Indeed, mean volume is 1.19 times larger for females.
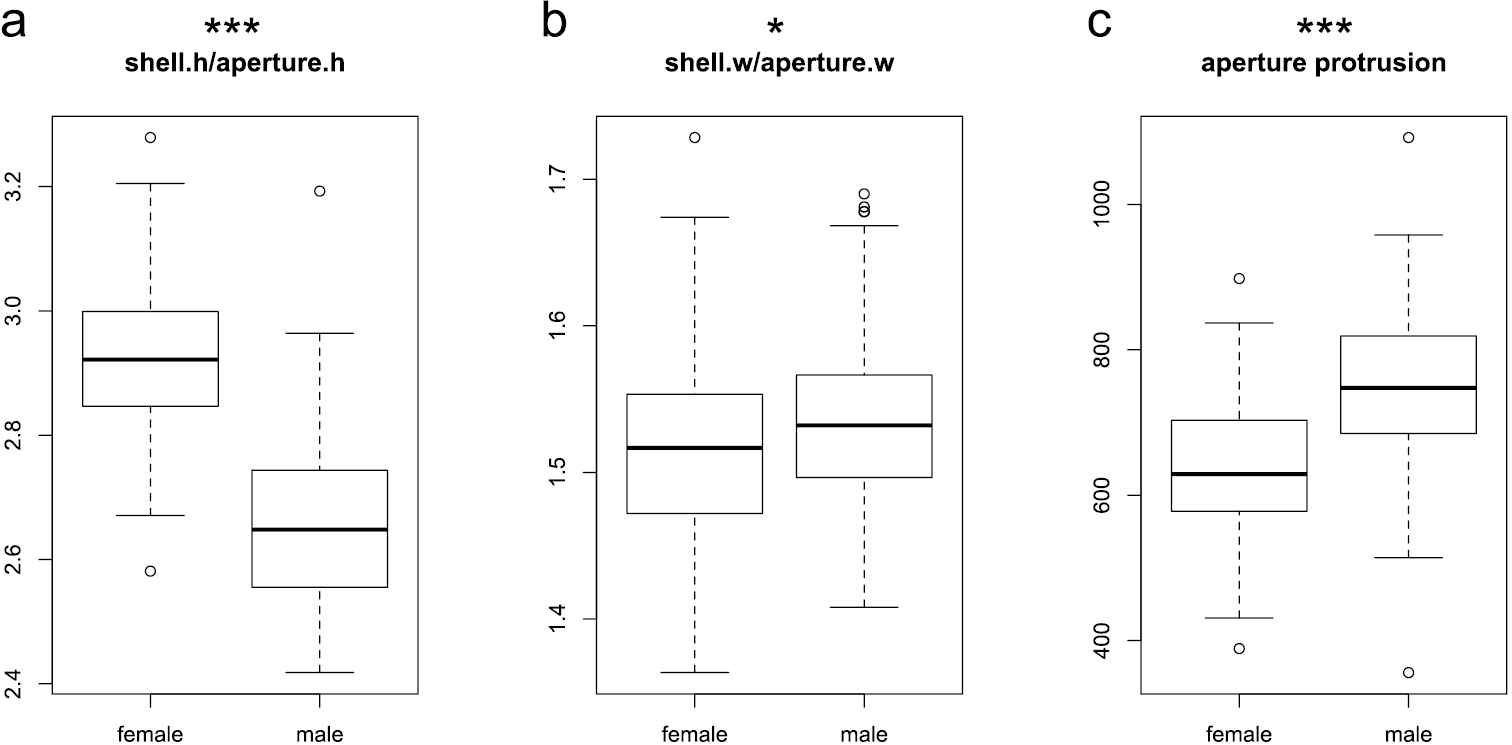
Boxplots of the ratios shell height:aperture height (a) and shell width:aperture width (b), and aperture protrusion (c). Significance levels of Wilcoxon test: ‘***’ p < 0.001, ‘**’ p < 0.01, ‘*’ p < 0.05, ‘.’ p < 0.1, ‘ ’ p < 1.
The mean of the other ratio, shell width:aperture width, differed slightly between sexes (Fig. 4b), although the differences in the means of shell width and aperture width are themselves not significant (Table 1). Mean shell width is nevertheless slightly larger in males, which is why the differences in the ratio became slightly significant (Wilcoxon test, p = 0.044). Because shell width and aperture width do not differ between sexes, the greater whorl width should therefore cause a less pronounced lateral protrusion of the female aperture. Indeed, aperture protrusion – calculated by subtracting whorl width from shell width – has distinctly lower values for females than for males (Wilcoxon test, p < 0.001; Fig. 4c).
To assess the amount of allometry in the data we plotted isosize against each of the shape PCs, in order to see how strongly shape correlates with size. Judging from the respective graphs (Figs 5a and 5b) only a very moderate correlation of shape PC2 with isosize is discernible, shape PC1 is clearly uncorrelated. Therefore allometric variation was of marginal importance concerning our data set. This observation is further supported by the allometry ratio spectrum. The latter is used in a very similar manner as a PCA ratio spectrum, except that the ratios calculated from distant characters are those showing the most distinctive allometric behaviour. Inspection of the allometry ratio spectrum in Figure 5c reveals aperture width:whorl width as the ratio with the strongest allometric variation. Obviously, it is not among the most dominant ratios of the PCA ratio spectrum of shape PC1 or shape PC2 (Fig. 2).

Scatterplots of isosize against first (a) and isosize against second principal component (b) in shape space; blue dots females, red triangles males. Allometry ratio spectrum (c).
Often, a researcher might simply wish to identify the sex of a shell. We therefore performed a linear discriminant analysis (LDA) that reveals the best separation of two groups by using the total information in the data. The performance of the LDA was then assessed with cross validation (Table 2). In our analysis, it was possible to correctly classify 92.3% of the females and 88.7% of the males.
Identification of specimens based on cross validation.
| sex | identification as | correctly identified | |
|---|---|---|---|
| female | male | ||
| females | 96 | 8 | 92.3% |
| males | 13 | 103 | 88.8% |
For practical reasons, a few characters that would allow quick and easy identification of most specimens might sometimes be useful, for instance in field work. A discriminant function is too awkward for such purpose, because its application is complicated and it lacks an intuitive element. One or two ratios would be preferable, as these are easily calculated and differences in proportions can sometimes even be estimated by eye. We therefore applied the LDA ratio extractor (see
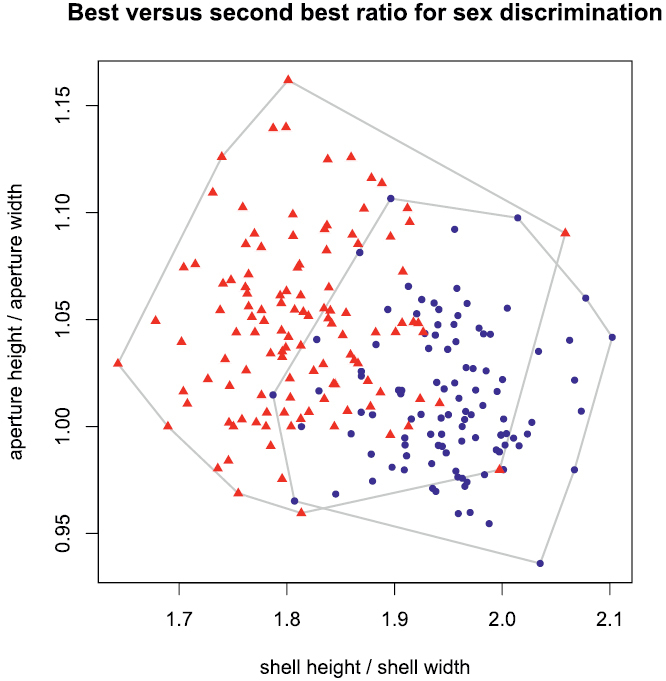
Scatterplot of best (shell height:shell width) against second best ratio (aperture height:aperture width) for separating females from males; blue dots females, red triangles males.
The rib density, determined on the last whorl, was largely overlapping between the sexes, although the mean was slightly higher for females (Wilcoxon test, p < 0.05; Fig. 7).
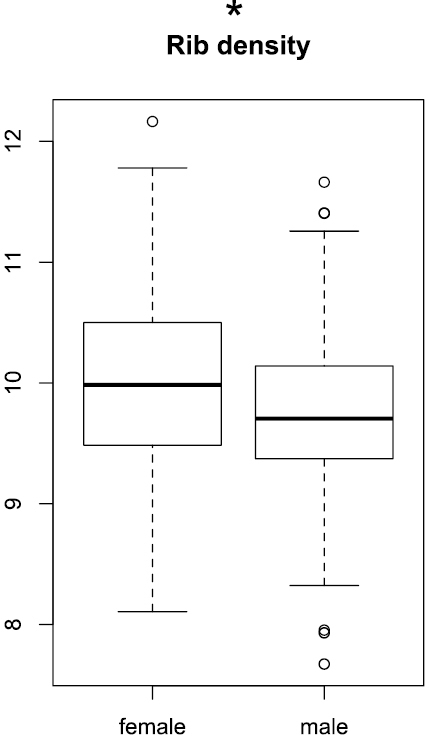
Boxplots of rip density. Significance levels of Wilcoxon test: ‘***’ p < 0.001, ‘**’ p < 0.01, ‘*’ p < 0.05, ‘.’ p < 0.1, ‘ ’ p < 1.
Pigmentation of the last whorl revealed a significant difference in the lower band, while pigmentation of the median and upper band was the same for males and females (Fig. 8). The figure is based on the classification made by the person that was not further involved in the study. However, classification by the senior author gave a very similar result.
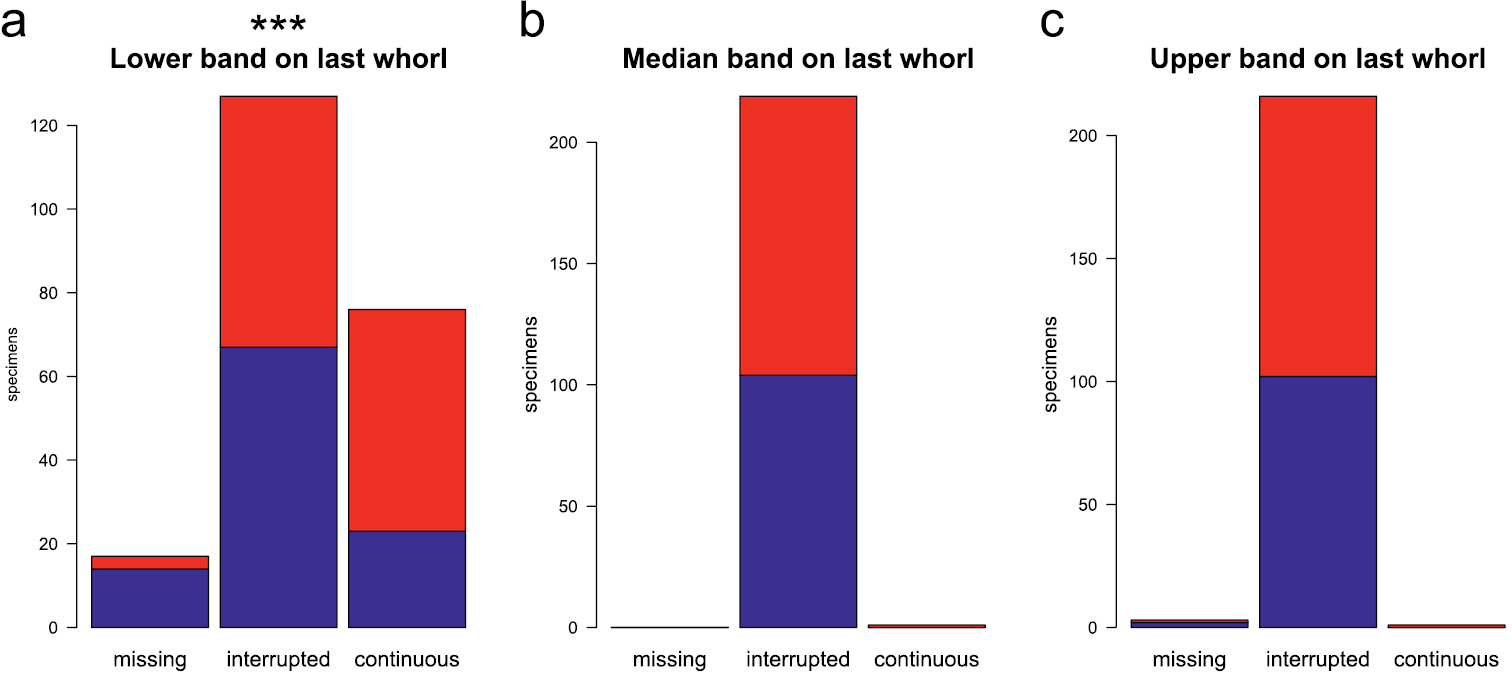
Bar diagrams showing the extent of pigmentation on the lower whorl: classification (missing, interrupted, continuous) of lower (a), median (b), and upper band (c); blue bars females, red bars males. Significance levels of Fisher’s exact test: ‘***’ p < 0.001, ‘**’ p < 0.01, ‘*’ p < 0.05, ‘.’ p < 0.1, ‘ ’ p < 1.
The numbers of males and females within the investigated populations are presented in Table 3. Population no. 1 (n = 6) is excluded here, the sample size is considered to be too small. For the remaining five populations, the observed average of females/males approaches a value of nearly 1, i.e. there is an equal number of females and males present. Two populations show a value > 1 (= more females), two show a value < 1 (= less females), and one population is balanced.
Sex ratio in five populations of Cochlostoma septemspirale.
| population | ♀ | ♂ | No. of specimens | sex ratio ♀/♂ |
|---|---|---|---|---|
| 2 | 21 | 21 | 42 | 1.00 |
| 3 | 13 | 22 | 35 | 0.59 |
| 4 | 19 | 16 | 35 | 1.19 |
| 5 | 26 | 21 | 47 | 1.24 |
| 6 | 23 | 32 | 55 | 0.72 |
| Sums | 102 | 112 | 214 | |
| mean | 0.95 |
As expected, there is a sexual dimorphism in shells of Cochlostoma septemspirale. Females are larger than males, as revealed by larger mean isosize, a result already indicated by
These differences in size and shape of the sexes may be explained by the differing morphology of the reproductive systems between females and males. Females have a seminal receptacle and a bursa copulatrix well separated from the oviduct (
Mean rib density is slightly higher in females, but the ranges are more or less overlapping (Fig. 7).
In the character state “banding of the last whorl”, males are more strongly pigmented on the lower band than females (Fig. 8). Currently there is no explanation for this result, as males and females live in mixed populations under the same environmental conditions. It also cannot play a role in sex recognition, because the optical abilities of snails are limited to recognition of darkness or brightness (
From Figure 2 and 6 it is evident that continuous character variation is quite strongly overlapping between sexes. However, the result of the cross validation indicated that about 90% of the shells can be correctly assigned (Table 2).
From the results of the calculation of the sex ratios it can be concluded that the ratio between males and females is approximately balanced. However, the number of investigated populations is much too small to come to a generalized conclusion. The observed ratio variability can also be due to a too small population sample.
As we have shown above, multivariate morphometric methods could be successfully applied to populations of Cochlostoma septemspirale from the Jura. In particular, it was possible to uncover subtle, but nevertheless important morphological differences between sexes, that otherwise might have gone unnoticed. Future investigations will show whether our results apply for other populations from the distribution area of Cochlostoma septemspirale or even other species of Cochlostoma. In practice, the methods are easily applicable in a wide variety of ecological and systematic studies and offer the additional benefit to exploit museum’s material with their mainly dry shell collections.
Thanks to Lisa Wilmsmeier (NMBE) for encoding the pigmentation of the last whorl.
Localities
NMBE30979
Le Landeron, 47.06760435°N, 7.06510484°E (DD), 596 m, 5.4.2011, leg. Reichenbach et al.
NMBE30980
Chasseral, at the crossroads Diesse / Nods Chasseral, 47.06996106°N, 7.09448308°E (DD), 620 m, 5.4.2011, leg. Reichenbach et al.
NMBE30981
Orvin, 47.15439027°N, 7.19399571°E (DD), 833 m, 5.4.2011, leg. Reichenbach et al.
NMBE30982
Route de Chasseral, Combes de Nods, 47.11286416°N, 7.04331994°E (DD), 1154 m, 19.4.2011, leg. Reichenbach et al.
NMBE30983
Route de Chasseral, 1 km towards Nods, 47.12018349°N, 7.07096815°E (DD), 1054 m, 19.4.2011, leg. Reichenbach et al.
NMBE30984
Gaicht in direction to Twannberg, 47.10991059°N, 7.15971977°E (DD), 794 m, 19.4.2011, leg. Reichenbach et al.