

(C) 2011 J. A. Colin Bergeron. This is an open access article distributed under the terms of the Creative Commons Attribution License, which permits unrestricted use, distribution, and reproduction in any medium, provided the original author and source are credited.
For reference, use of the paginated PDF or printed version of this article is recommended.
Spatial associations between species of trees and ground-beetles (Coleoptera: Carabidae) involve many indirect ecological processes, likely reflecting the function of numerous forest ecosystem components. Describing and quantifying these associations at the landscape scale is basic to the development of a surrogate-based framework for biodiversity monitoring and conservation. In this study, we used a systematic sampling grid covering 84 km2 of boreal mixedwood forest to characterize the ground-beetle assemblage associated with each tree species occurring on this landscape. Projecting the distribution of relative basal area of each tree species on the beetle ordination diagram suggests that the carabid community is structured by the same environmental factors that affects the distribution of trees, or perhaps even by trees per se. Interestingly beetle species are associated with tree species of the same rank order of abundance on this landscape, suggesting that conservation of less abundant trees will concomitantly foster conservation of less abundant beetle species. Landscape patterns of association described here are based on characteristics that can be directly linked to provincial forest inventories, providing a basis that is already available for use of tree species as biodiversity surrogates in boreal forest land management.
Landscape ecology, Carabidae, Trees, Forest canopy mosaic, Biodiversity surrogates, Regional conservation
Although some ground-beetle species are recognized as forest habitat specialists (
Associations between forest composition and ground-beetle species could involve a host of indirect processes, reflecting the ecological interactions of numerous forest ecosystem components (e.g.,
As it is impossible to appropriately assess biodiversity of entire forested landscapes, implementation of practical conservation strategies must be based to some extent on biodiversity surrogates (
In the boreal forest, studies of carabid-tree relationships have been mainly based on stand-level categorization of canopy cover (e.g., conifer vs deciduous or spruce dominated vs aspen dominated) (e.g.,
The study was conducted at the EMEND (Ecosystem Management Emulating Natural Disturbance) research site in the boreal mixedwood forest of northwestern Alberta, Canada. The approximate project centre is at 56°46'13"N, 118°22'28"W, ~90 km northwest of Peace River, (see
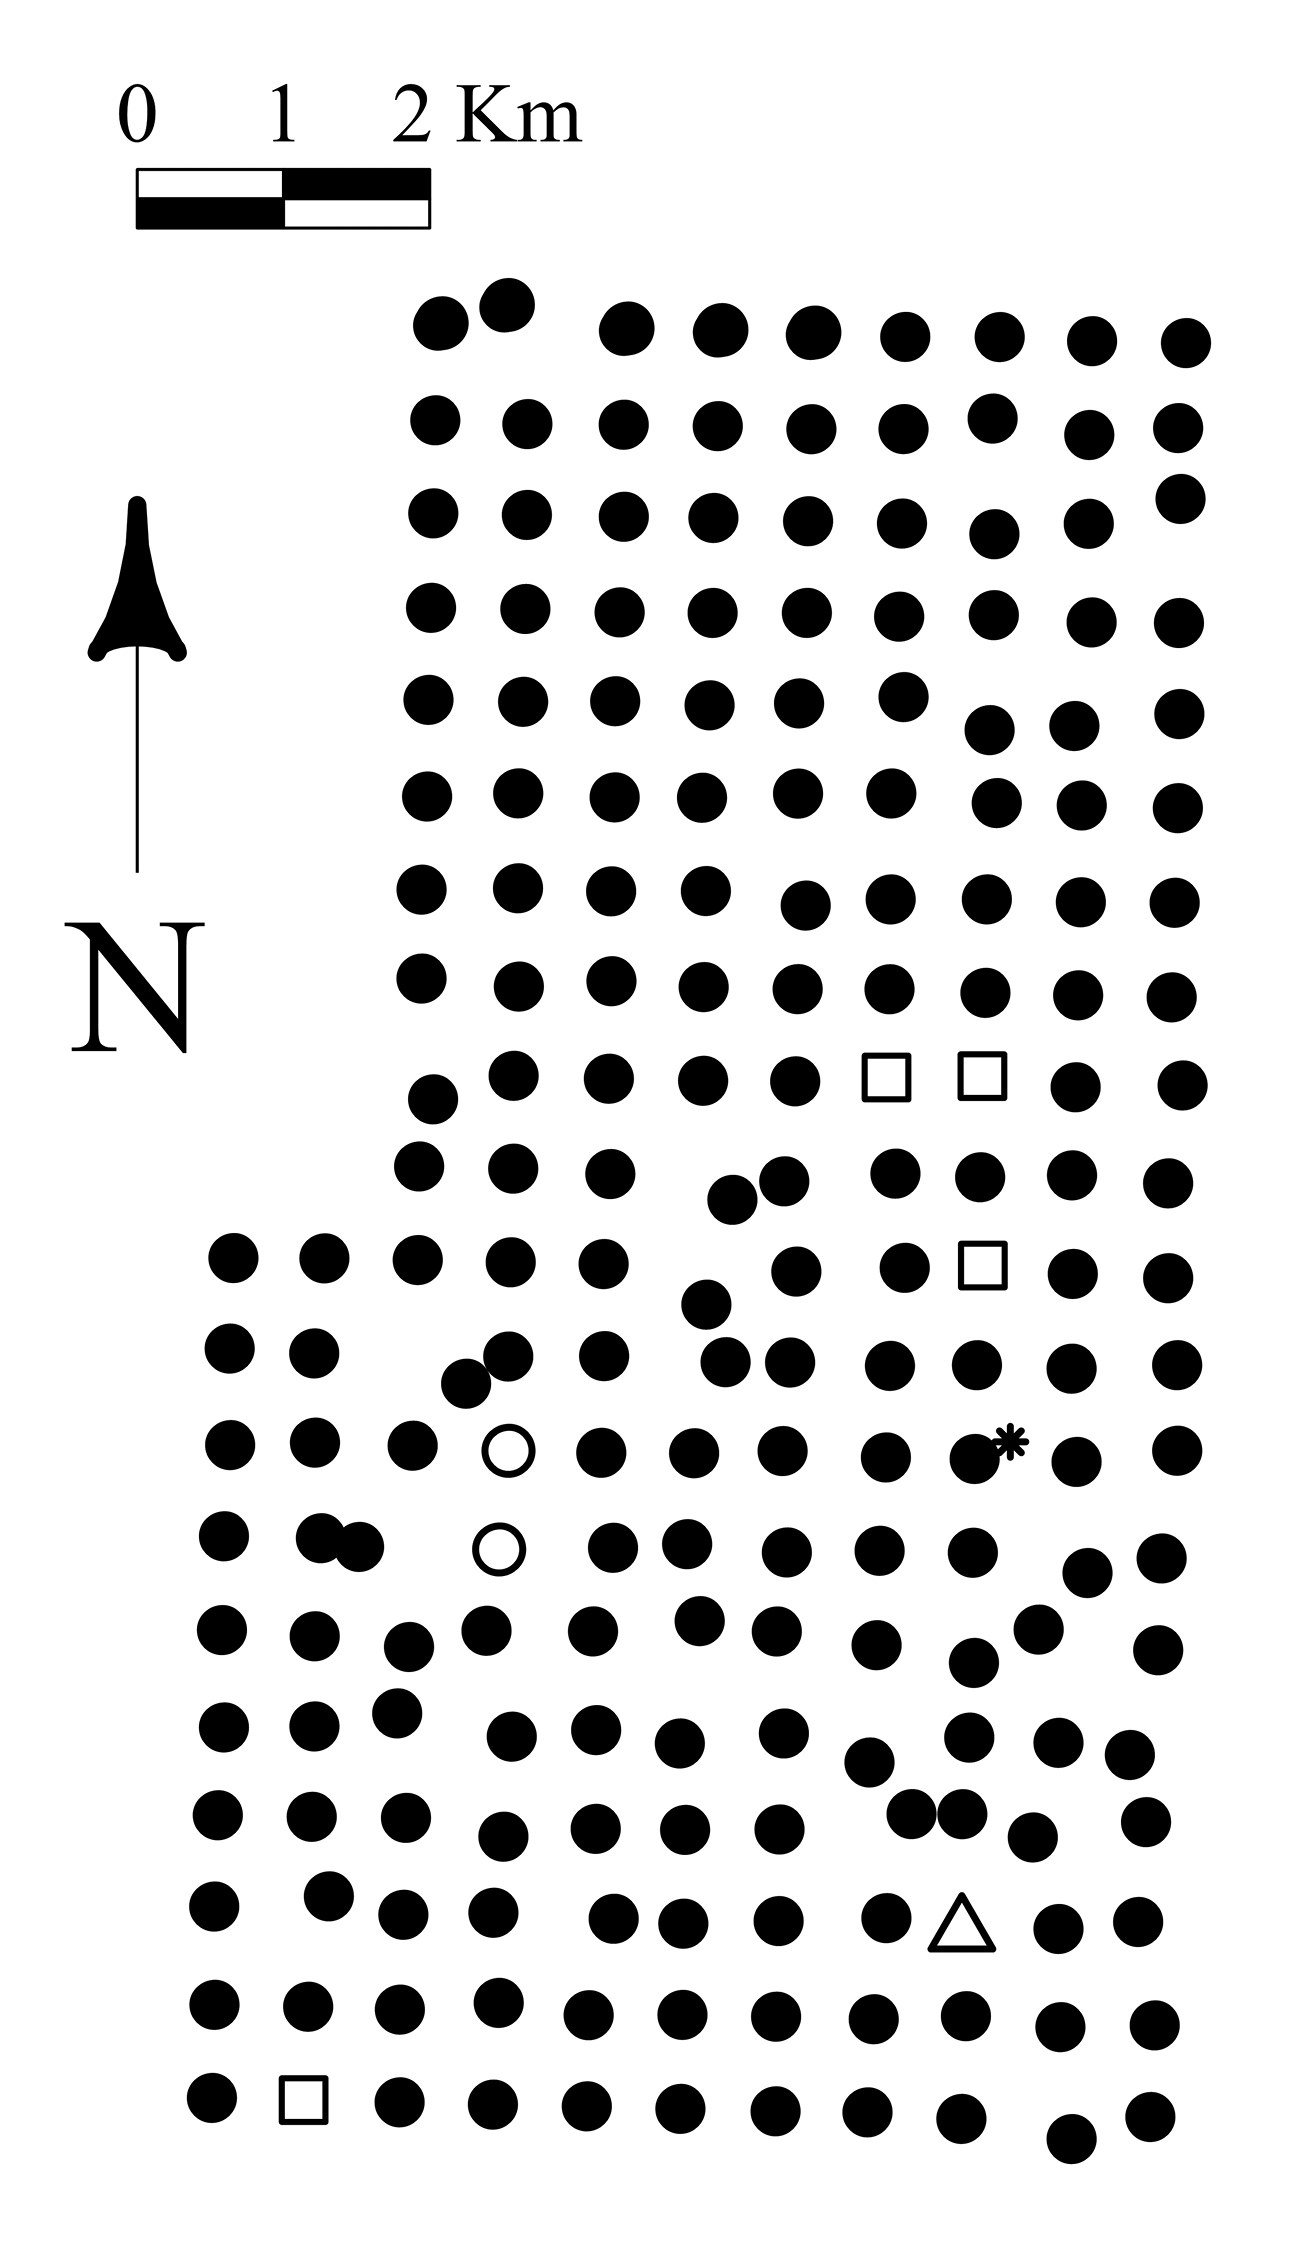
In the summer of 2002, a systematic grid of 200 sites covering 84 km2 (Fig. 1) of forested land was established in order to describe landscape patterns of ecological association between ground-beetles and overstory trees. At every site, we recorded diameter at breast height (dbh) and species identity for the 25 stems over 5cm dbh closest to our sample centre. We also documented the dbh and species of one stem for tree species present within a 50 meters radius but not recorded among the 25 stems encompassed in the original plots. This allowed us to consider the potential influence of proximal tree species on the beetle assemblages that were not included among the 25 stems. Drainage was recorded from two soil pits dug at 10 meters east and west from the plot centre. Drainage was categorized using a system of 11 classes, as modified from
The following summer (2003), we installed three pitfall traps in each of the same 200 sites (600 traps total). Traps were located at 0º (North), 120°, and 240° on a circle 15 m in diameter centred on the previously established site. Pitfall traps were a plastic cup (11 cm diameter by 13 cm depth), containing a plastic inner collecting cup and covered by a 14 cm2 of plywood supported over the trap by two nails (see
Figure 1. Map of the sampling sites. Squares represent destroyed sites, open circles represent harvested sites, triangle represents the outlier, and the star represents the burnt site.
As a first step in linking within-stand canopy heterogeneity to ground-beetle assemblages, we calculated the relative basal area for each tree species in every site. Basal area is directly related to canopy cover (
In order to visualize how the assemblage of ground-beetles was arrayed on the EMEND landscape, we performed a non metric multidimentional scaling (NMS) ordination of 194 sites based on the standardized abundance of the beetle species. We used the Bray-Curtis dissimilarity index to build the distance matrix and chose the highest number of dimensions providing a reduction of five in the stress (
Beetle assemblage response to forest canopy was more clearly illustrated by plotting the relative basal area of tree species for every site on the beetle ordination diagram. This procedure was undertaken because interesting ecological trends were obscured by the sole use of centroids or vectors. Centroid calculation, vector projection, and ordination were performed using the vegan package (
We collected and identified 9, 845 individual ground-beetles representing 48 species (Table 1). Stereocerus haematopus (Dejean), Calathus advena (LeConte) and Pterostichus adstrictus Eschscholtz accounted for over 70% of catches, and together with the next seven most abundant species [Platynus decentis (Say), Calathus ingratus Dejean, Pterostichus punctatissimus (Randall), Agonum retractum LeConte, Trechus chalybeus Dejean, Patrobus foveocollis (Eschscholtz), and Pterostichus brevicornis (Kirby)], accounted for 95% of the beetle catch. Nine beetle species (Agonum cupreum Dejean, Amara laevipennis Kirby, Amara patruelis Dejean, Cymindis unicolor Kirby, Dyschirius hiemalis (Bousquet), Elaphrus clairvillei Kirby, Notiophilus semistriatus Say, Poecilus lucublandus (Say) and Trichocellus mannerheimii (R.F. Sahlberg)) were trapped only in the 4 disturbed sites.
Species of the family Carabidae collected in 197 sites during the summer of 2003 in boreal Alberta, Canada. n= sample size.
| Species | Catches | % catch | n sites |
|---|---|---|---|
| Stereocerus haematopus (Dejean) | 2830 | 28.63 | 164 |
| Calathus advena (LeConte) | 2665 | 26.96 | 150 |
| Pterostichus adstrictus Eschscholtz | 1427 | 14.44 | 127 |
| Calathus ingratus Dejean | 607 | 6.14 | 118 |
| Platynus decentis (Say) | 529 | 5.35 | 114 |
| Pterostichus punctatissimus (Randall) | 421 | 4.26 | 100 |
| Agonum retractum LeConte | 349 | 3.53 | 78 |
| Trechus chalybeus Dejean | 285 | 2.88 | 78 |
| Patrobus foveocollis (Eschscholtz) | 223 | 2.26 | 76 |
| Pterostichus brevicornis (Kirby) | 172 | 1.74 | 71 |
| Carabus chamissonis Fisher von Waldheim | 159 | 1.61 | 69 |
| Agonum gratiosum (Mannerheim) | 48 | 0.49 | 20 |
| Platynus mannerheimii (Dejean) | 34 | 0.34 | 18 |
| Pterostichus pensylvanicus LeConte | 23 | 0.23 | 17 |
| Trechus apicalis Motschulsky | 14 | 0.14 | 12 |
| Agonum sordens Kirby | 11 | 0.11 | 6 |
| Nebria gyllenhali Kirby | 8 | 0.08 | 6 |
| Bembidion grapii Gyllenhal | 7 | 0.07 | 5 |
| Agonum cupreum Dejean | 7 | 0.07 | 4 |
| Notiophilus directus Casey | 6 | 0.06 | 4 |
| Synuchus impunctatus (Say) | 6 | 0.06 | 4 |
| Trichocellus mannerheimii (R.F. Sahlberg) | 5 | 0.05 | 4 |
| Pterostichus riparius (Dejean) | 5 | 0.05 | 3 |
| Trichocellus cognatus (Gyllenhal) | 5 | 0.05 | 3 |
| Amara erratica (Duftschmid) | 5 | 0.05 | 2 |
| Patrobus septentrionis Dejean | 4 | 0.04 | 2 |
| Calosoma frigidum Kirby | 3 | 0.03 | 2 |
| Elaphrus clairvillei Kirby | 2 | 0.02 | 2 |
| Notiophilus borealis T.W. Harris | 2 | 0.02 | 2 |
| Cymindis unicolor Kirby | 2 | 0.02 | 2 |
| Loricera pilicornis (Fabricius) | 2 | 0.02 | 1 |
| Bembidion rupicola (Kirby) | 2 | 0.02 | 1 |
| Amara lunicollis Shiødte | 2 | 0.02 | 1 |
| Amara laevipennis Kirby | 1 | 0.01 | 1 |
| Agonum placidum (Say) | 1 | 0.01 | 1 |
| Agonum superioris Lindroth | 1 | 0.01 | 1 |
| Amara littoralis Mannerheim | 1 | 0.01 | 1 |
| Amara patruelis Dejean | 1 | 0.01 | 1 |
| Badister obtusus LeConte | 1 | 0.01 | 1 |
| Dyschirius hiemalis (Bousquet) | 1 | 0.01 | 1 |
| Elaphrus lapponicus Gyllenhal | 1 | 0.01 | 1 |
| Harpalus fulvilabris Mannerheim | 1 | 0.01 | 1 |
| Harpalus laevipes Zetterstedt | 1 | 0.01 | 1 |
| Miscodera arctica (Paykull) | 1 | 0.01 | 1 |
| Notiophilus semistriatus Say | 1 | 0.01 | 1 |
| Poecilus lucublandus (Say) | 1 | 0.01 | 1 |
| Sericoda quadripunctata (DeGeer) | 1 | 0.01 | 1 |
| Elaphrus americanus Dejean | 1 | 0.01 | 1 |
| Total | 9885 | ||
| n species | 48 |
Among tree species, Picea glauca was found in the highest number of sites followed by Populus tremuloides, Picea mariana, Populus balsamifera, Abies balsamea, and Larix laricina (Table 2). Picea glauca was also the most abundant species, and Picea mariana was the second most abundant, accounting for twice as many stems as Populus tremuloides, even if Picea mariana was found in fewer sites. More modest but still notable numbers of Populus balsamifera, Abies balsamea, and Larix laricina were encountered on the grid, but these species were found in a more restricted number of sites. Pinus contorta Loudon and Betula papyrifera Marsh. were found in only 16 and 10 sites respectively and contributed to less than 1% of the total basal area on this landscape.
Total and relative basal area for species of tree recorded in 194 sites for comparison with beetle assemblage in boreal Alberta, Canada. n= sample size.
| Tree species | Basal area (m2) | % basal area | n trees | n sites |
|---|---|---|---|---|
| Picea glauca | 82.2298 | 44.8 | 1720 | 133 |
| Populus tremuloides | 42.6206 | 23.2 | 831 | 91 |
| Picea mariana | 16.8314 | 9.2 | 1655 | 83 |
| Populus balsamifera | 36.4818 | 19.9 | 541 | 57 |
| Abies balsamea | 1.0901 | 0.6 | 103 | 20 |
| Larix laricina | 3.1918 | 1.7 | 86 | 17 |
| Pinus contorta | 0.9776 | 0.5 | 26 | 16 |
| Betula papyrifera | 0.2231 | 0.1 | 11 | 10 |
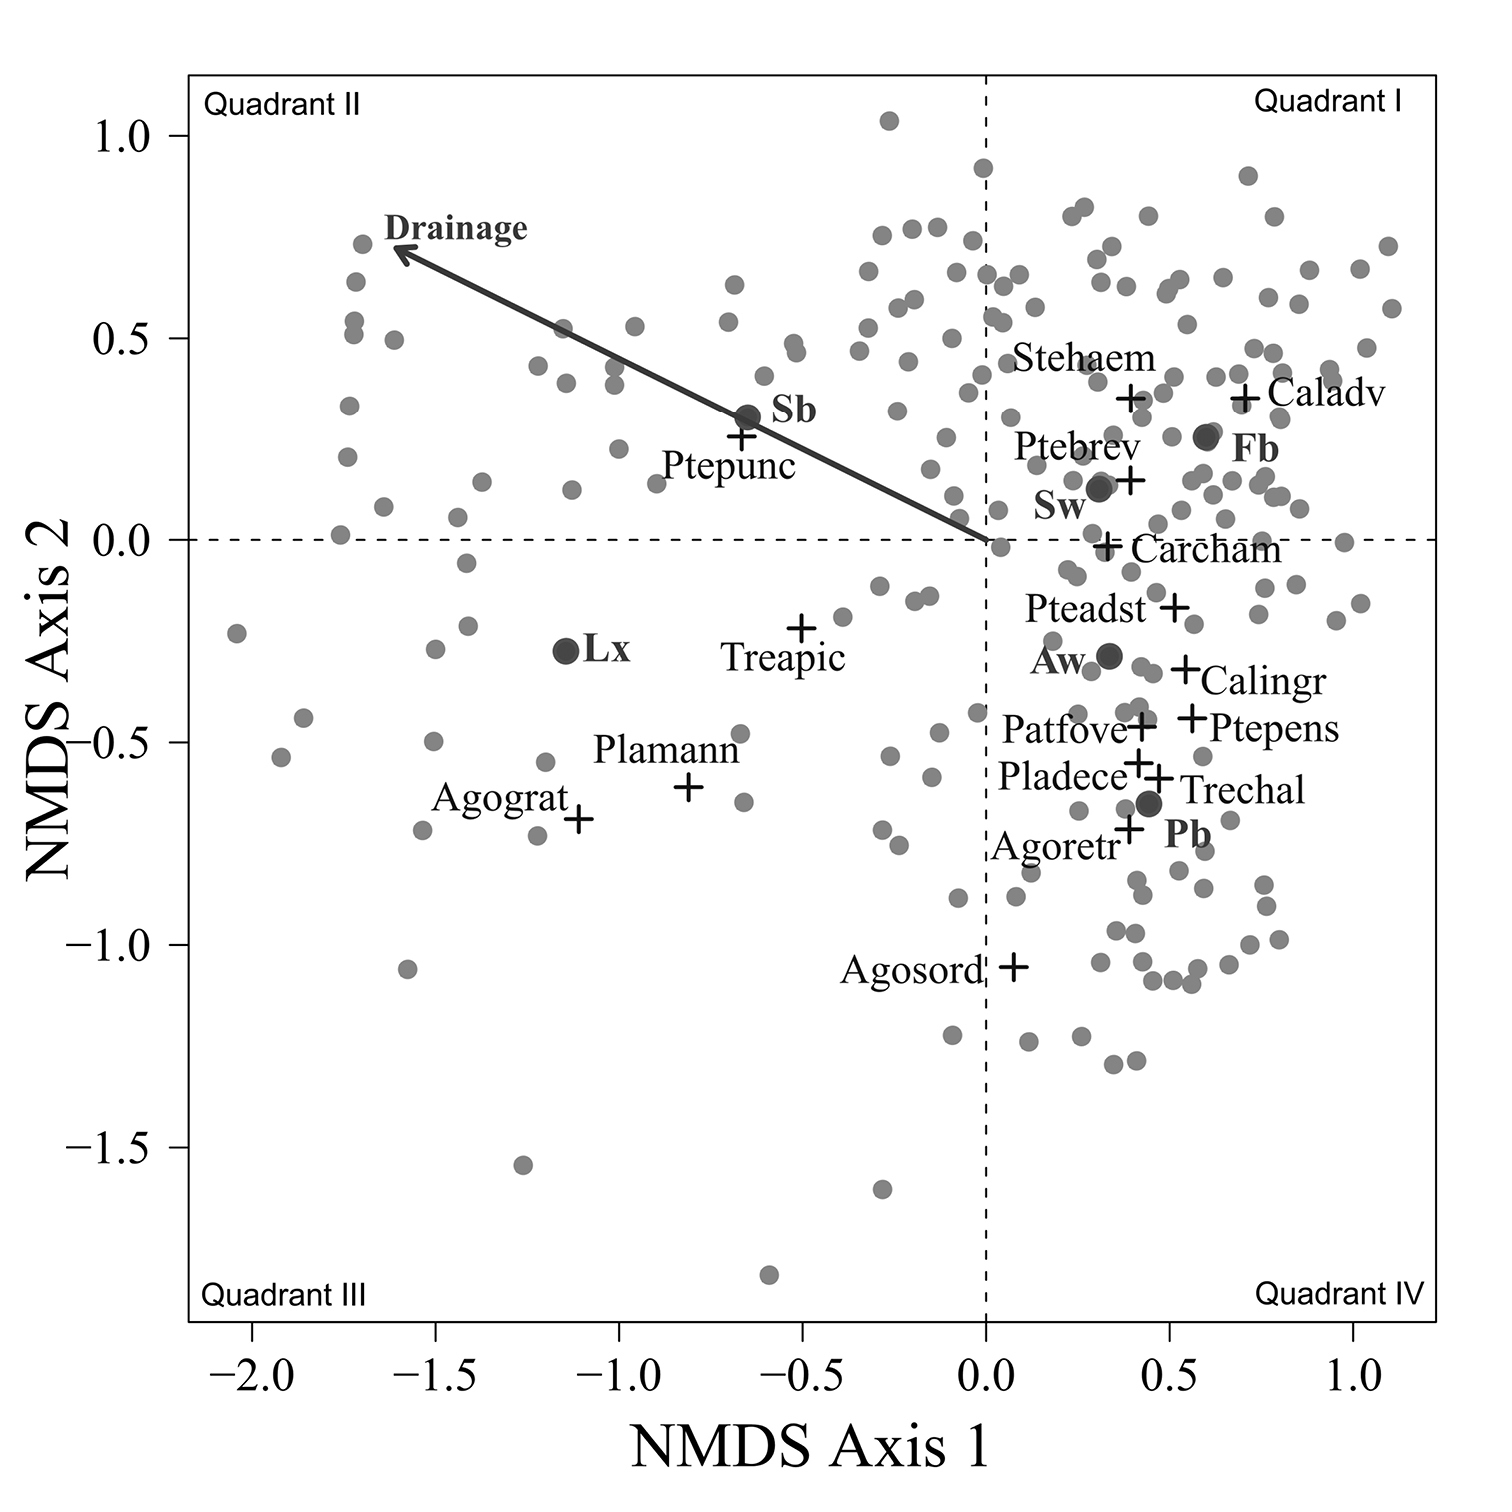
A two dimensional NMS solution arrayed the carabid assemblages collected from 193 sites in four quadrants (Fig. 2) with a stress of 15.1. One third of the sites clustered in the upper right quadrant in which values on both NMS axes were positive. The centroids for , Calathus advena and Pterostichus brevicornis were concentrated in this first quadrant of the ordination diagram, even though these species were captured at a broad range of sites. Centroids for the largest number of abundant species were concentrated in quadrant IV, which included about 25% of the sites. Species in quadrant IV were: Carabus chamissonis Fisher von Waldheim, Pterostichus adstrictus, Calathus ingratus, and with increasingly negative values on axis 2, Patrobus foveocollis, Pterostichus pensylvanicus LeConte, Platynus decentis, Trechus chalybeus, Agonum retractum and Agonum sordens Kirby. Another 25% of the sites were distributed in quadrant II, along with the centroid for Pterostichus punctatissimus and the vector for increasing wetness of drainage classes. This vector indicates a concentration of sites with poorly drained soils in the second quadrant. Only 15% of the sites were located in the quadrant III along with the centroids for Agonum gratiosum (Mannerheim) and Platynus mannerheimii (Dejean). The centroid for Trechus apicalis Motschulsky was also placed in quadrant III, although sites with Trechus apicalis were also widely distributed in the second and fourth quadrant.
Figure 2. NMS ordination of the 193 sites (grey dots) with weighted centroid for beetle (crosses) and tree species (dark dots), stress = 15.1. Vector direction indicates sites with increasingly poor drainage. The abbreviations of the beetle species are as follow: Agograt: Agonum gratiosum, Agoretr: Agonum retractum, Agosord: Agonum sordens, Caladve: Calathus advena, Calingr: Calathus ingratus, Carcham: Carabus chamissonis, Patfove: Patrobus foveocollis, Pladece: Platynus decentis, Plamann: Platynus mannerheimmi, Pteads: Pterostichus adstrictus, Ptebrev: Pterostichus brevicornis, Ptepens: Pterostichus pensylvanicus, Ptepunc: Pterostichus punctatissimus, Stehaem: Stereocerus haematopus, Treapic: Trechus apicalis, Trechal: Trechus chalybeus. Abbreviations for the tree species are; Aw: Populus tremuloides, Fb: Abies balsamea, Lx: Larix laricina, Pb: Populus balsamifera, Sb: Picea mariana, and Sw: Picea glauca.
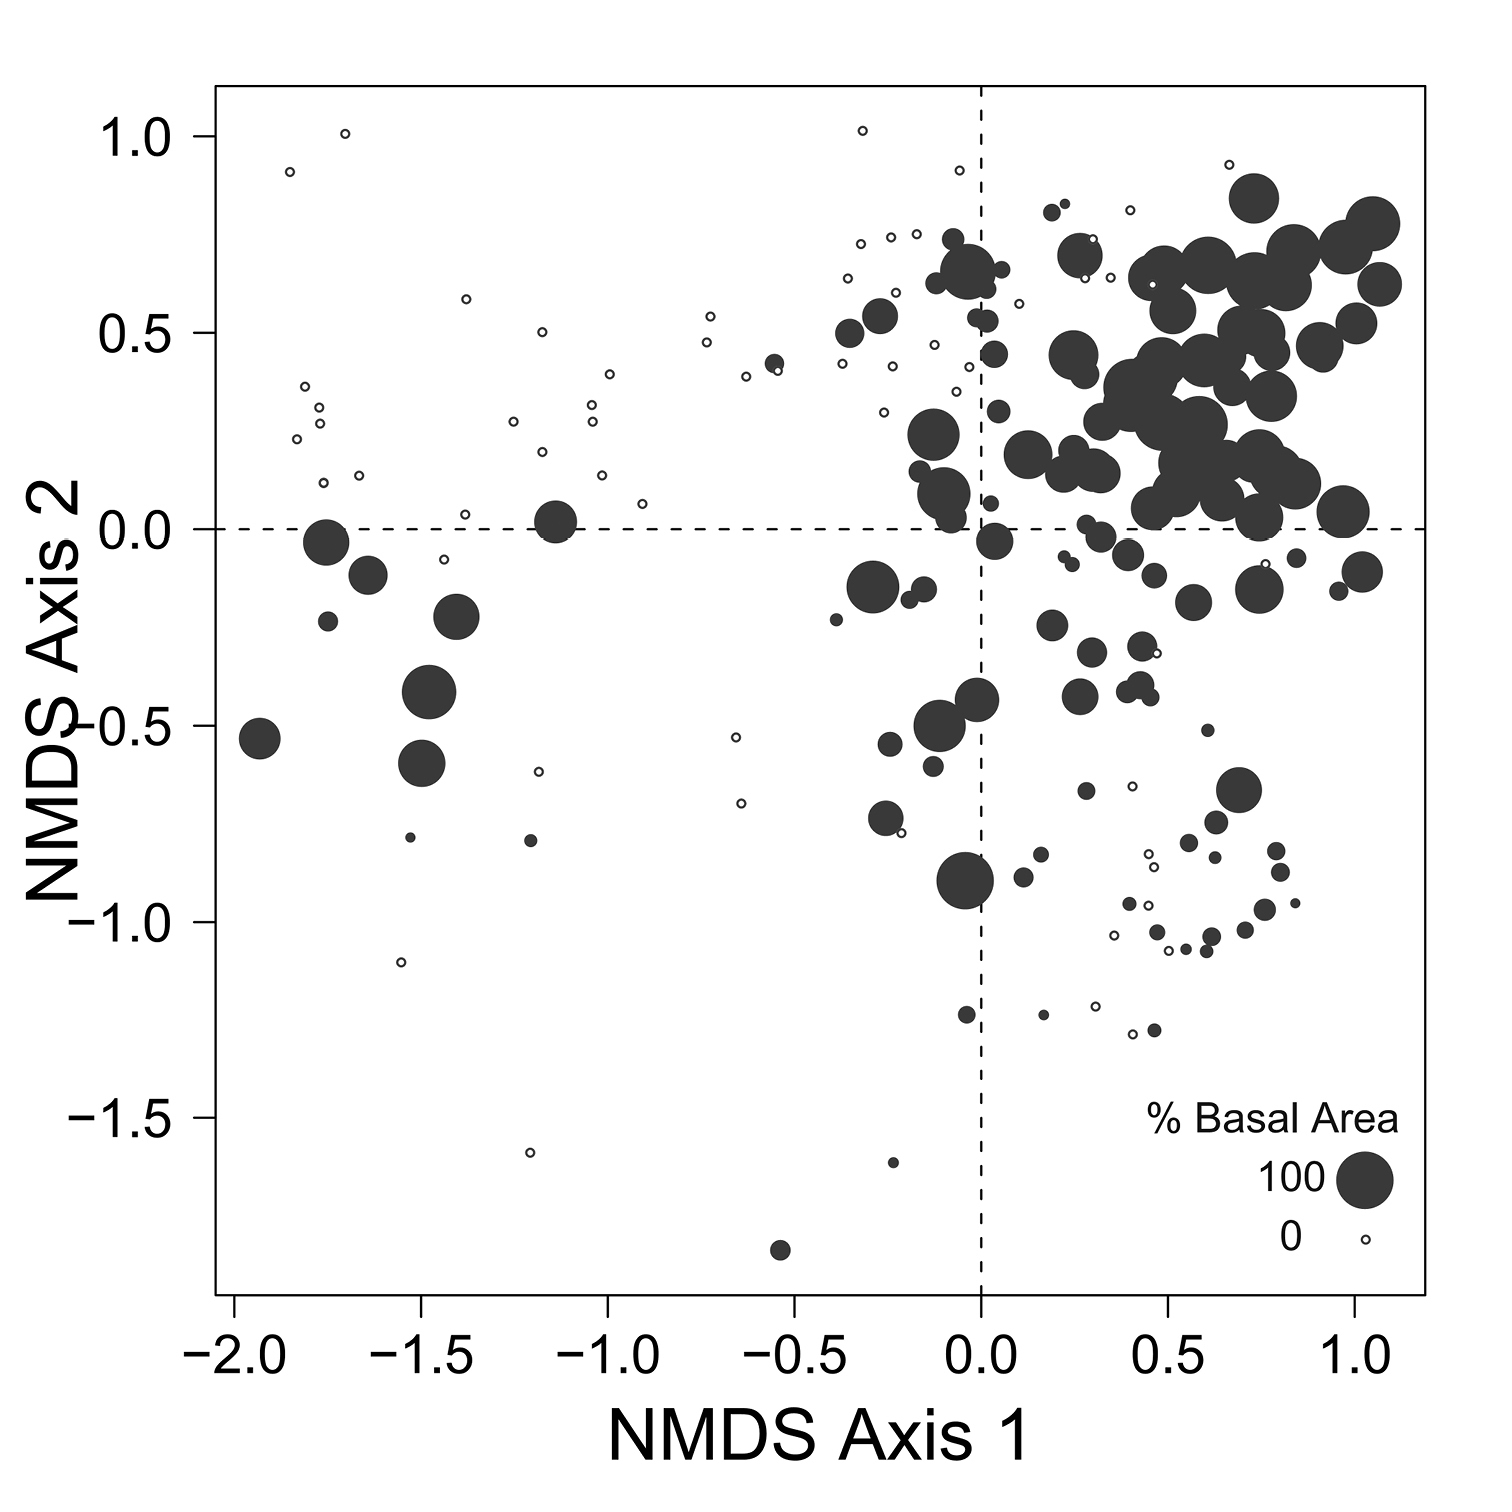
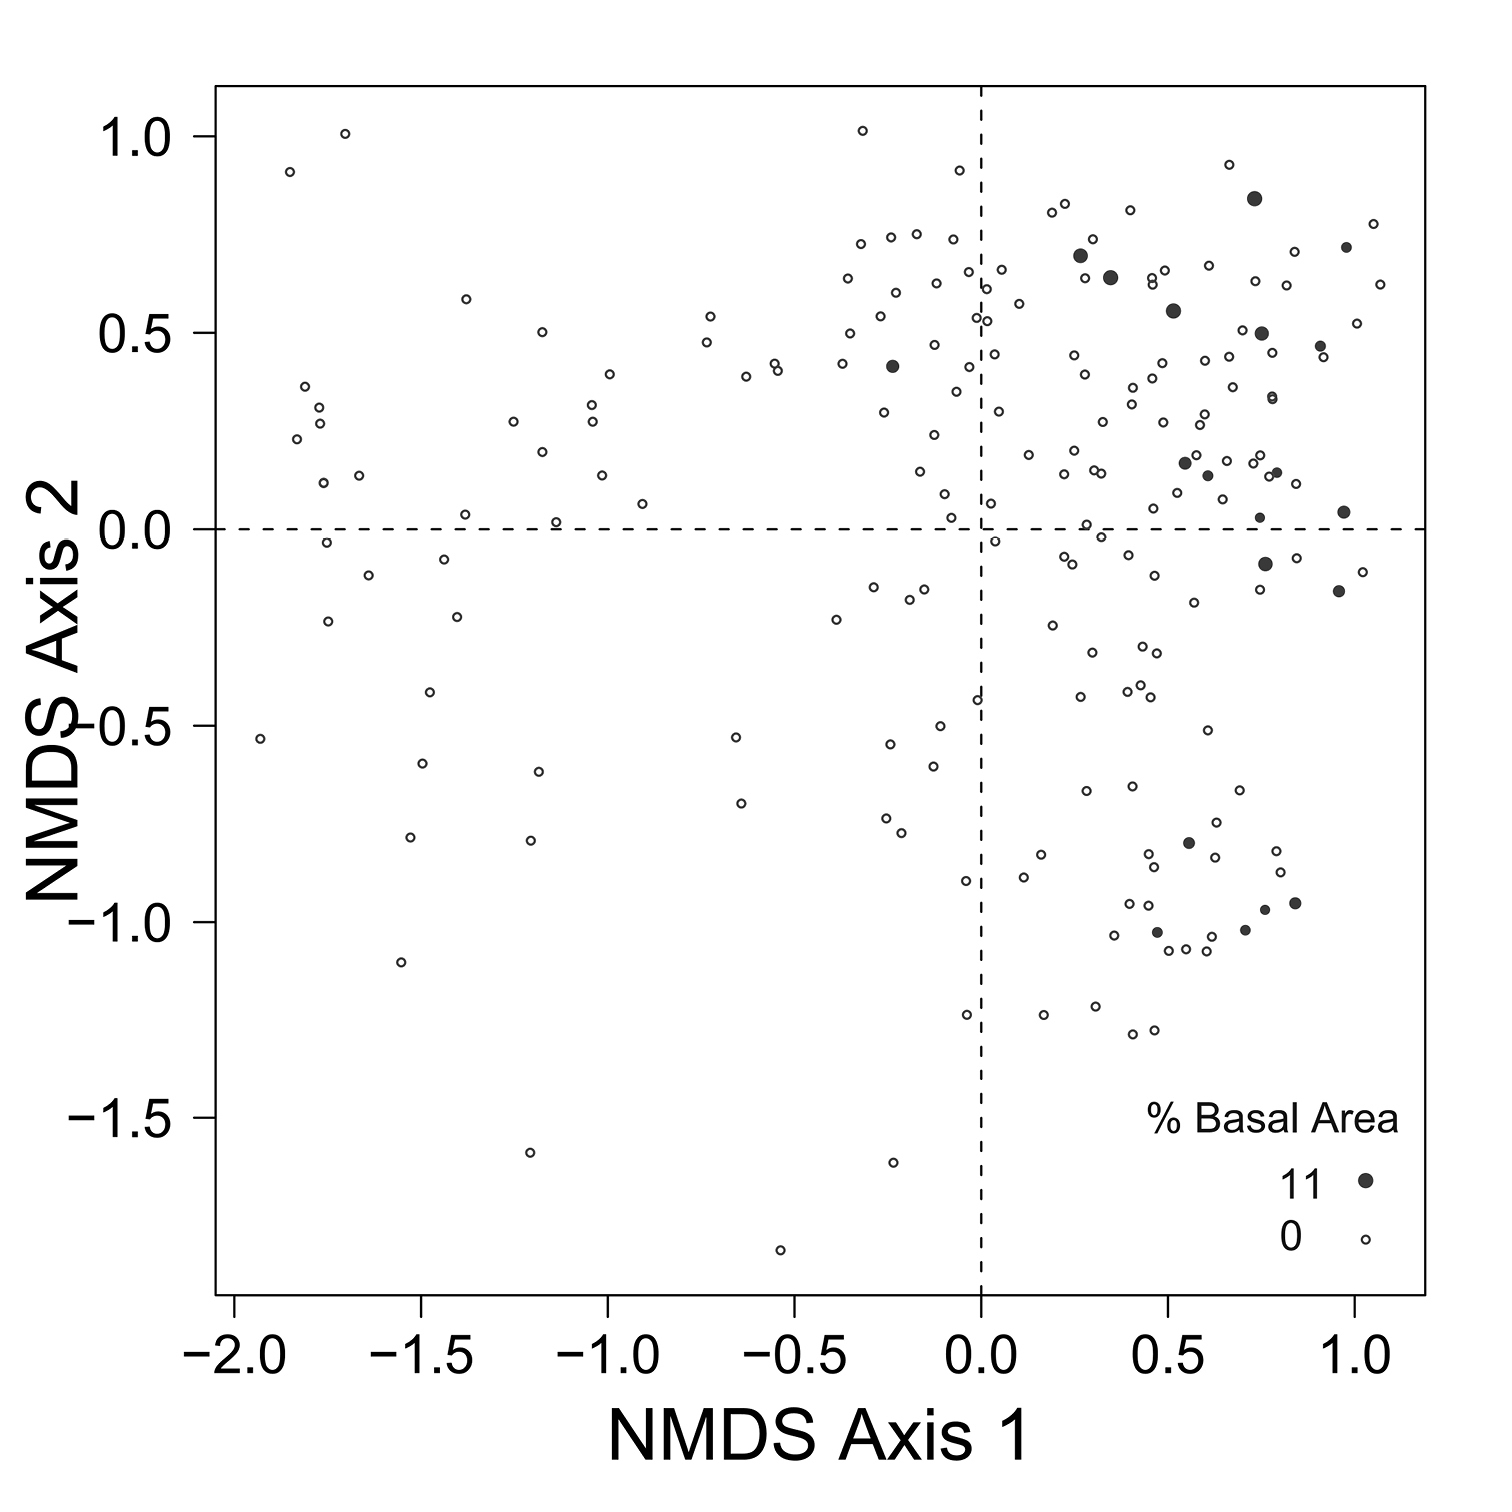
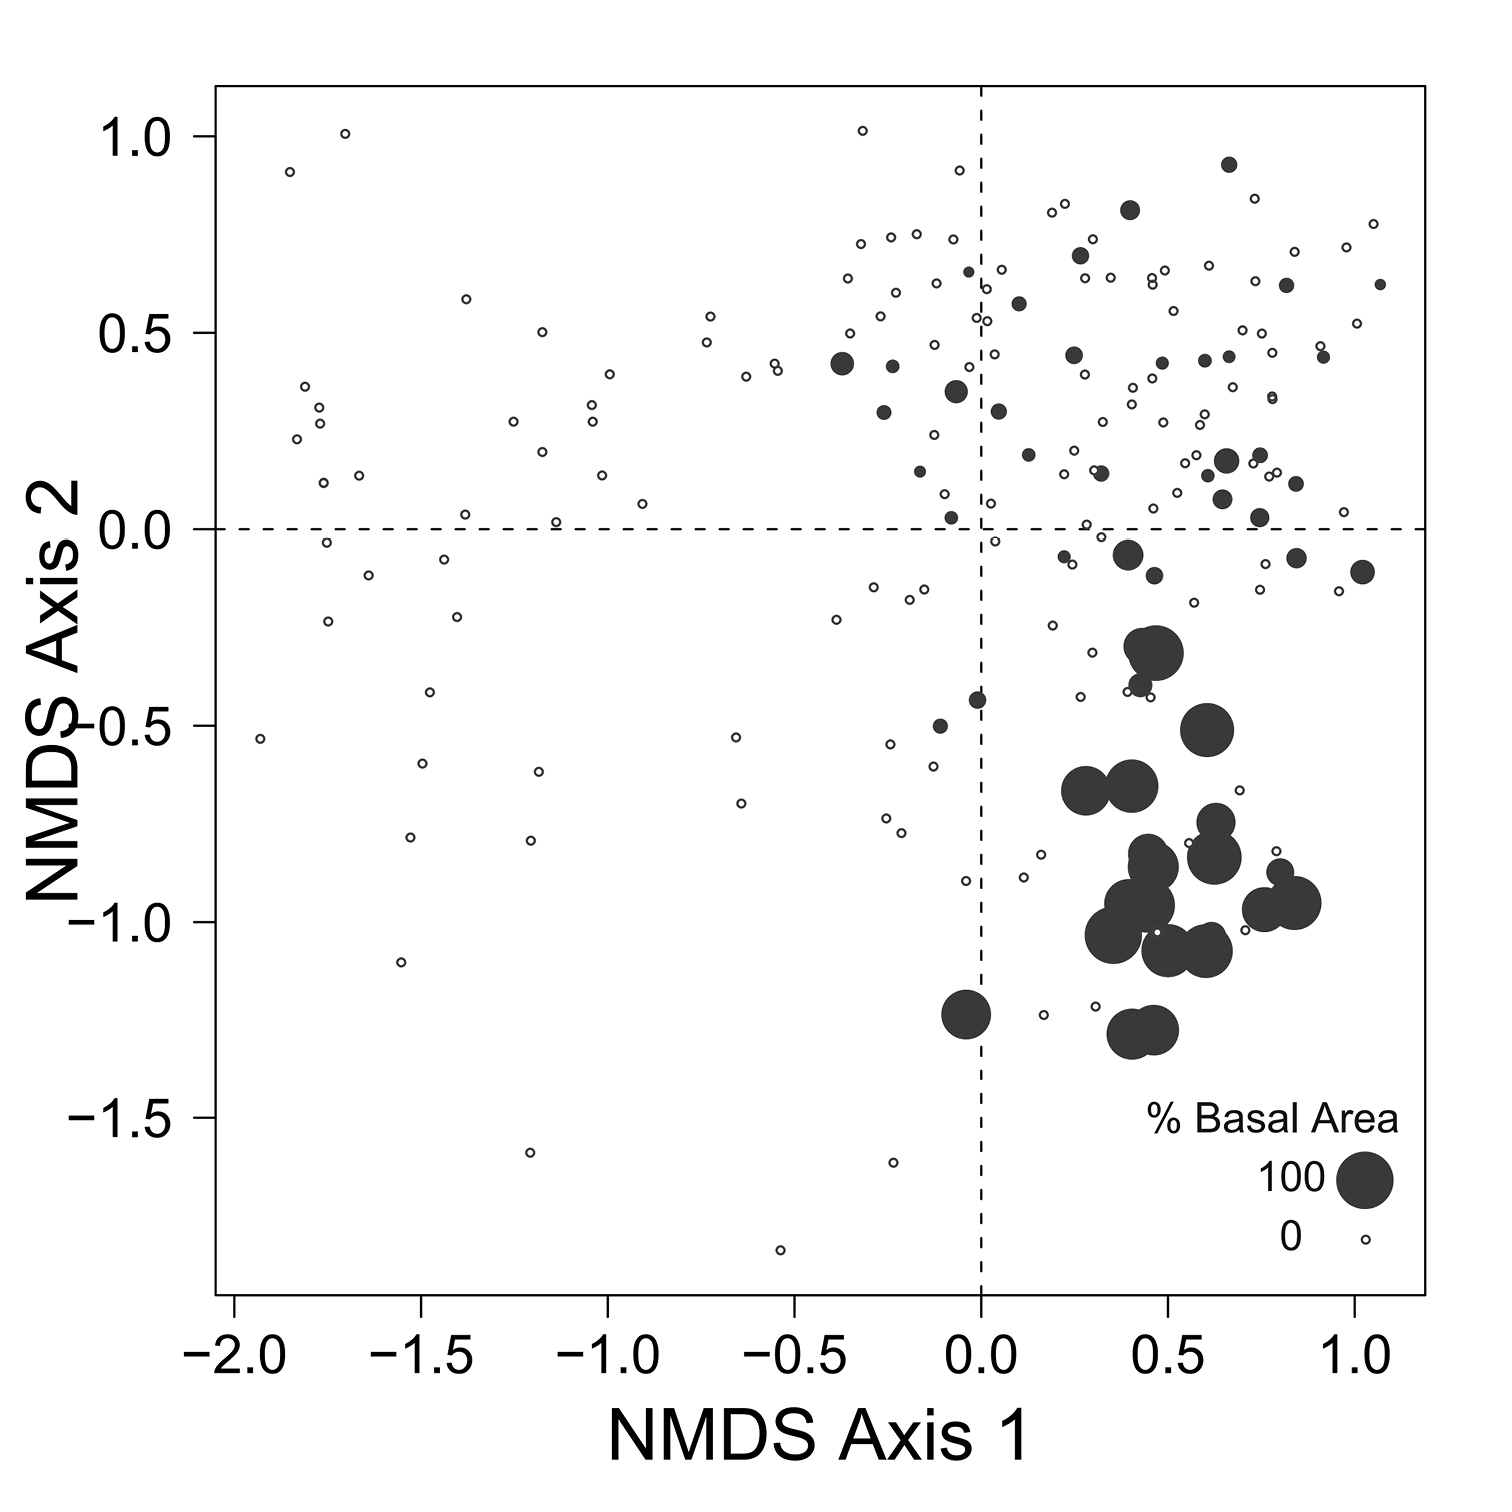
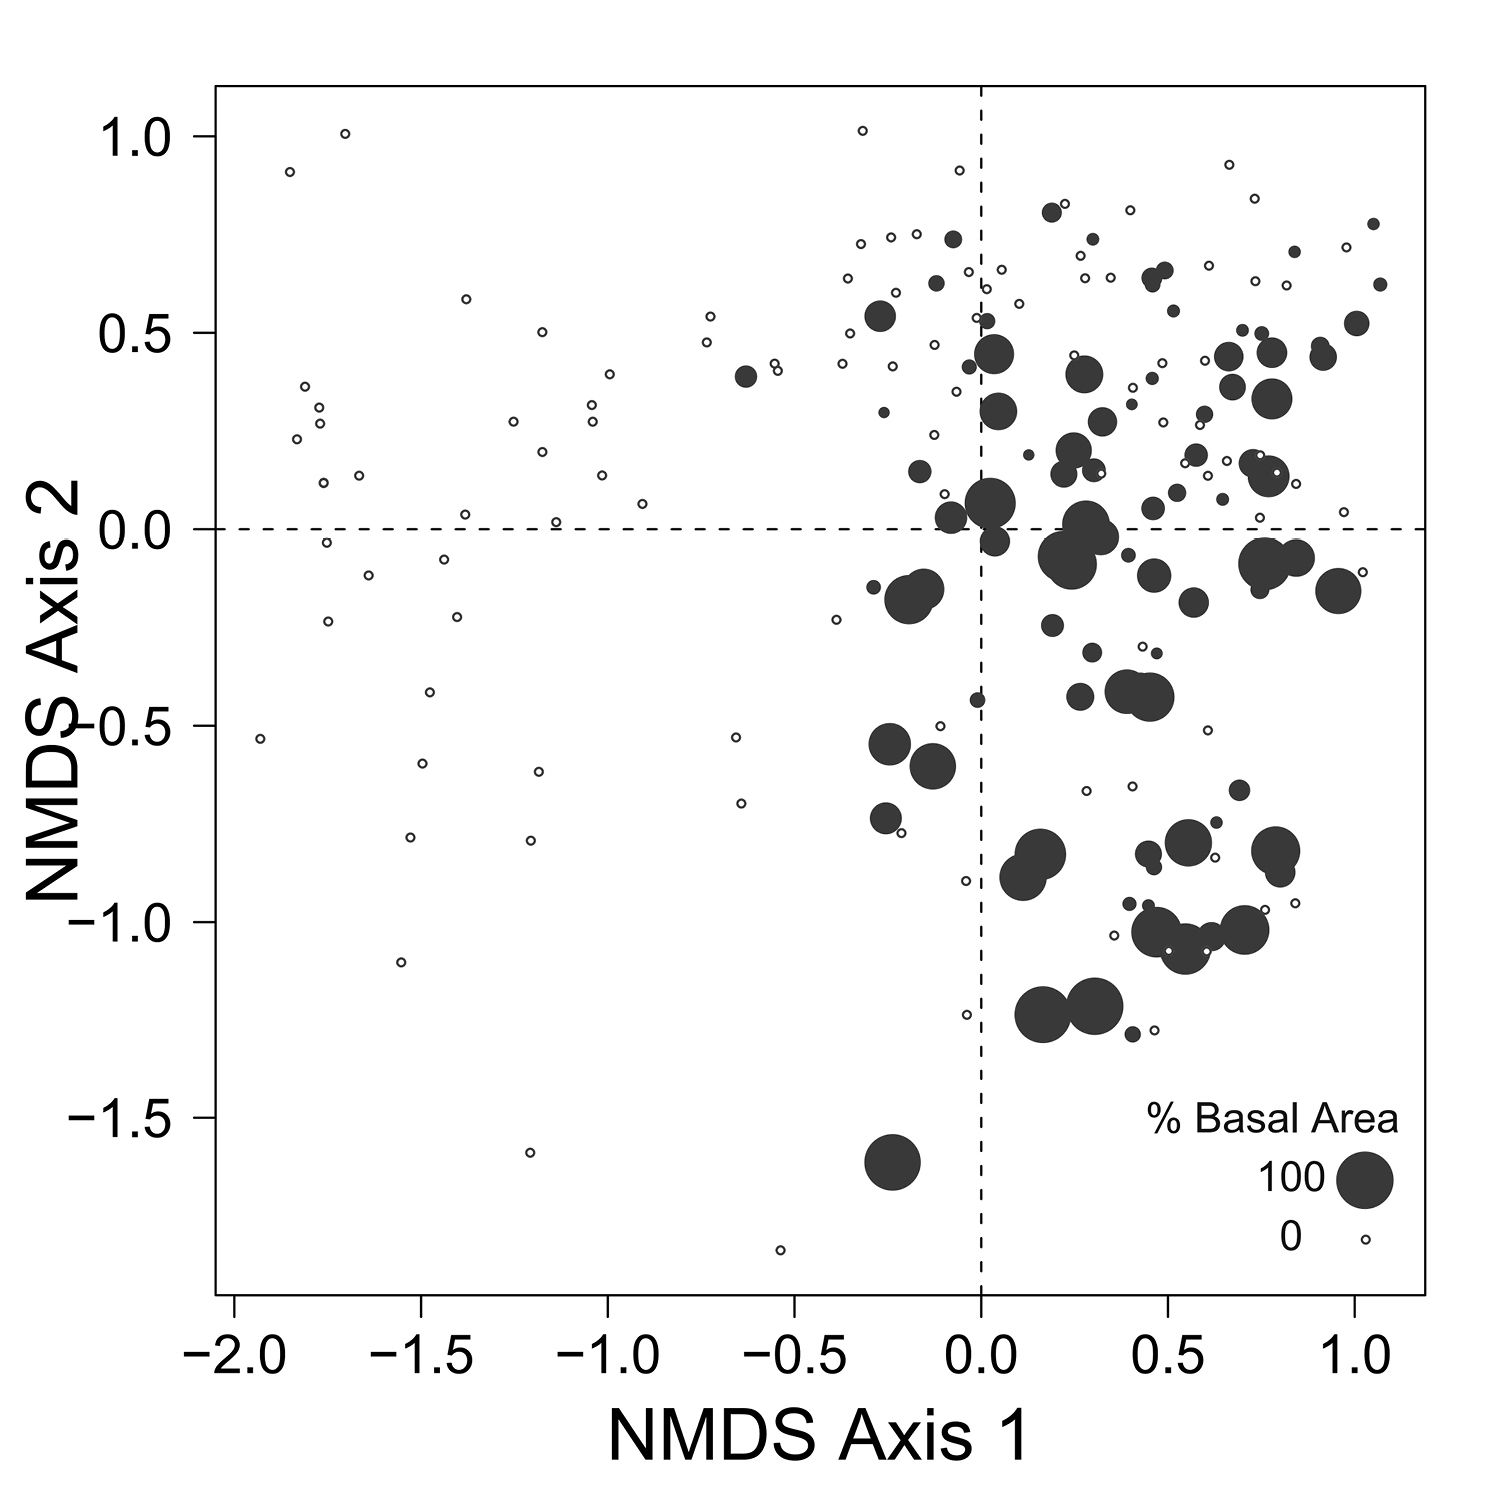
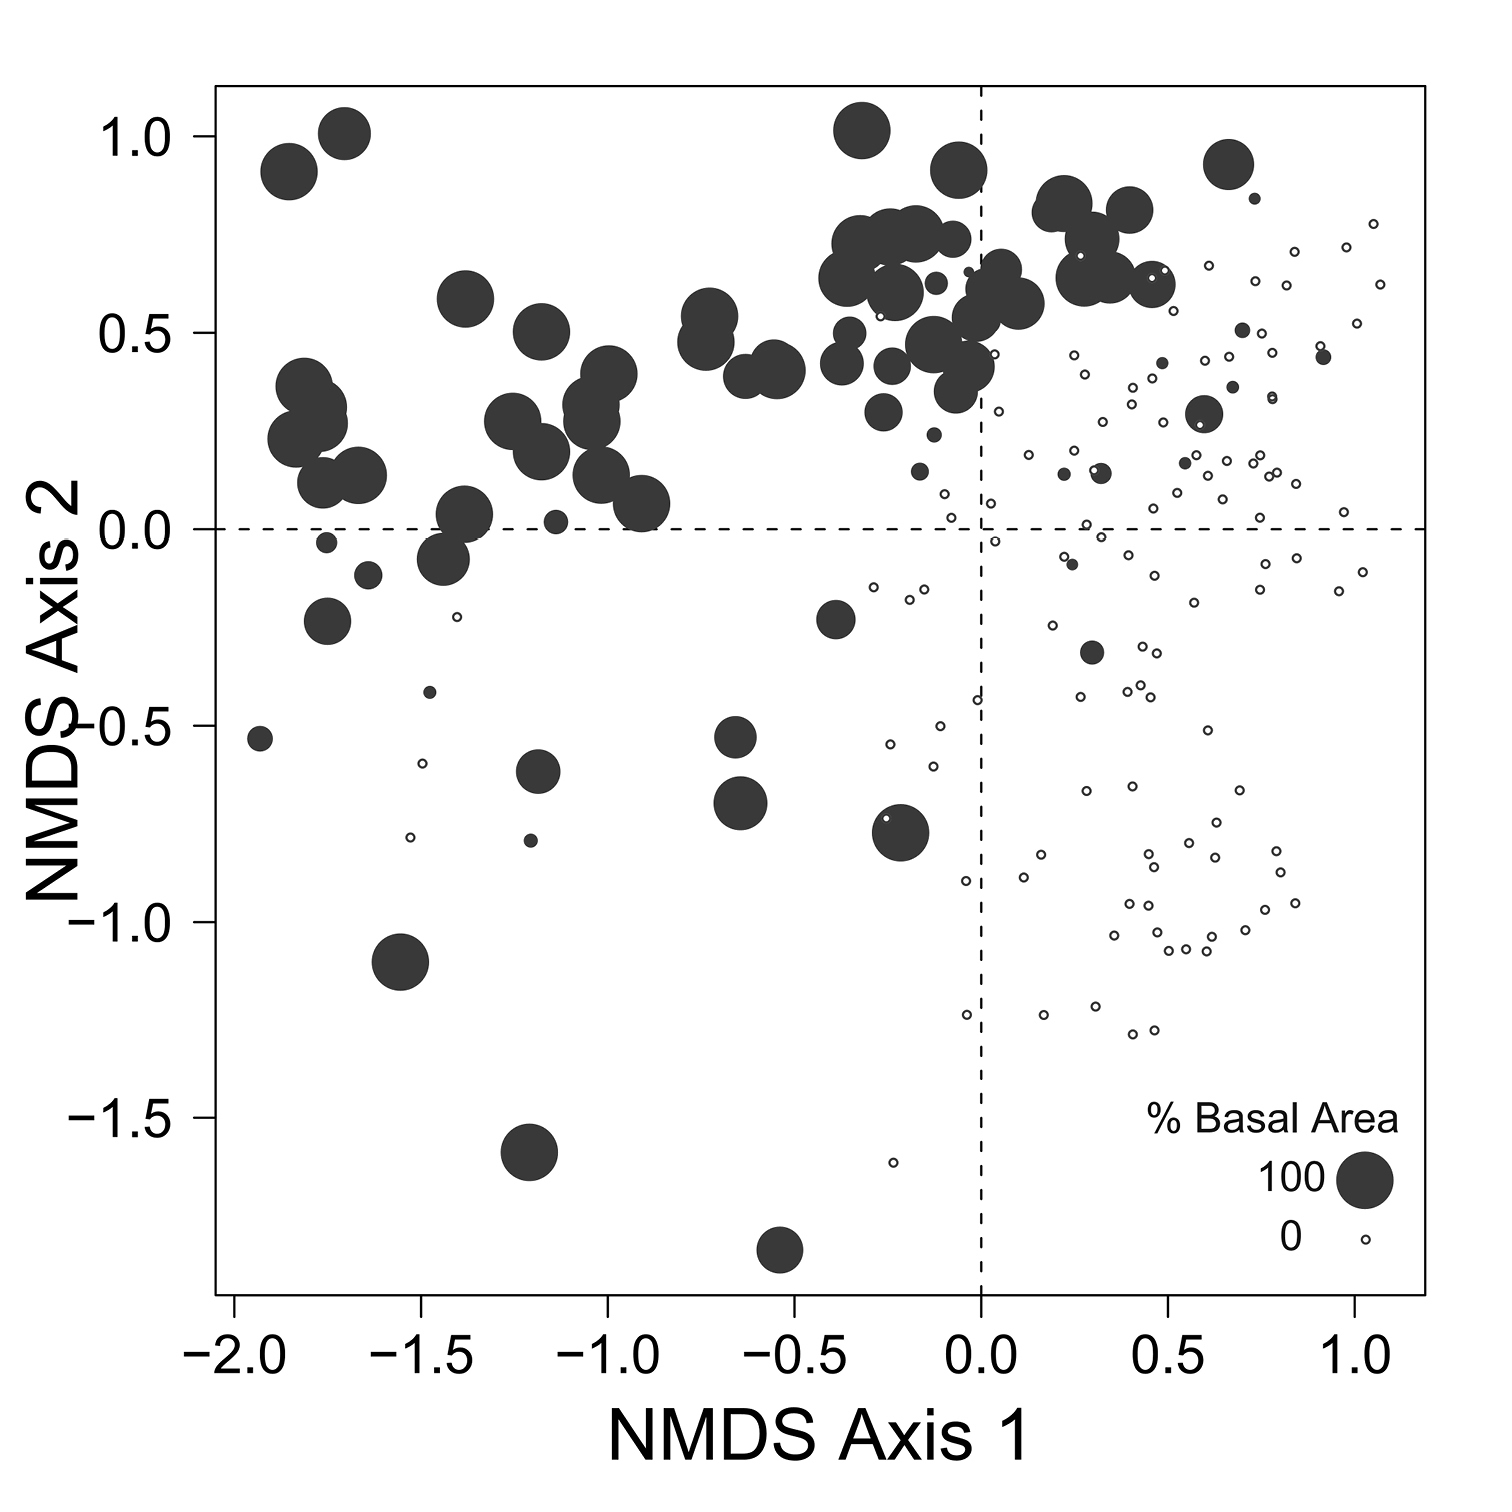
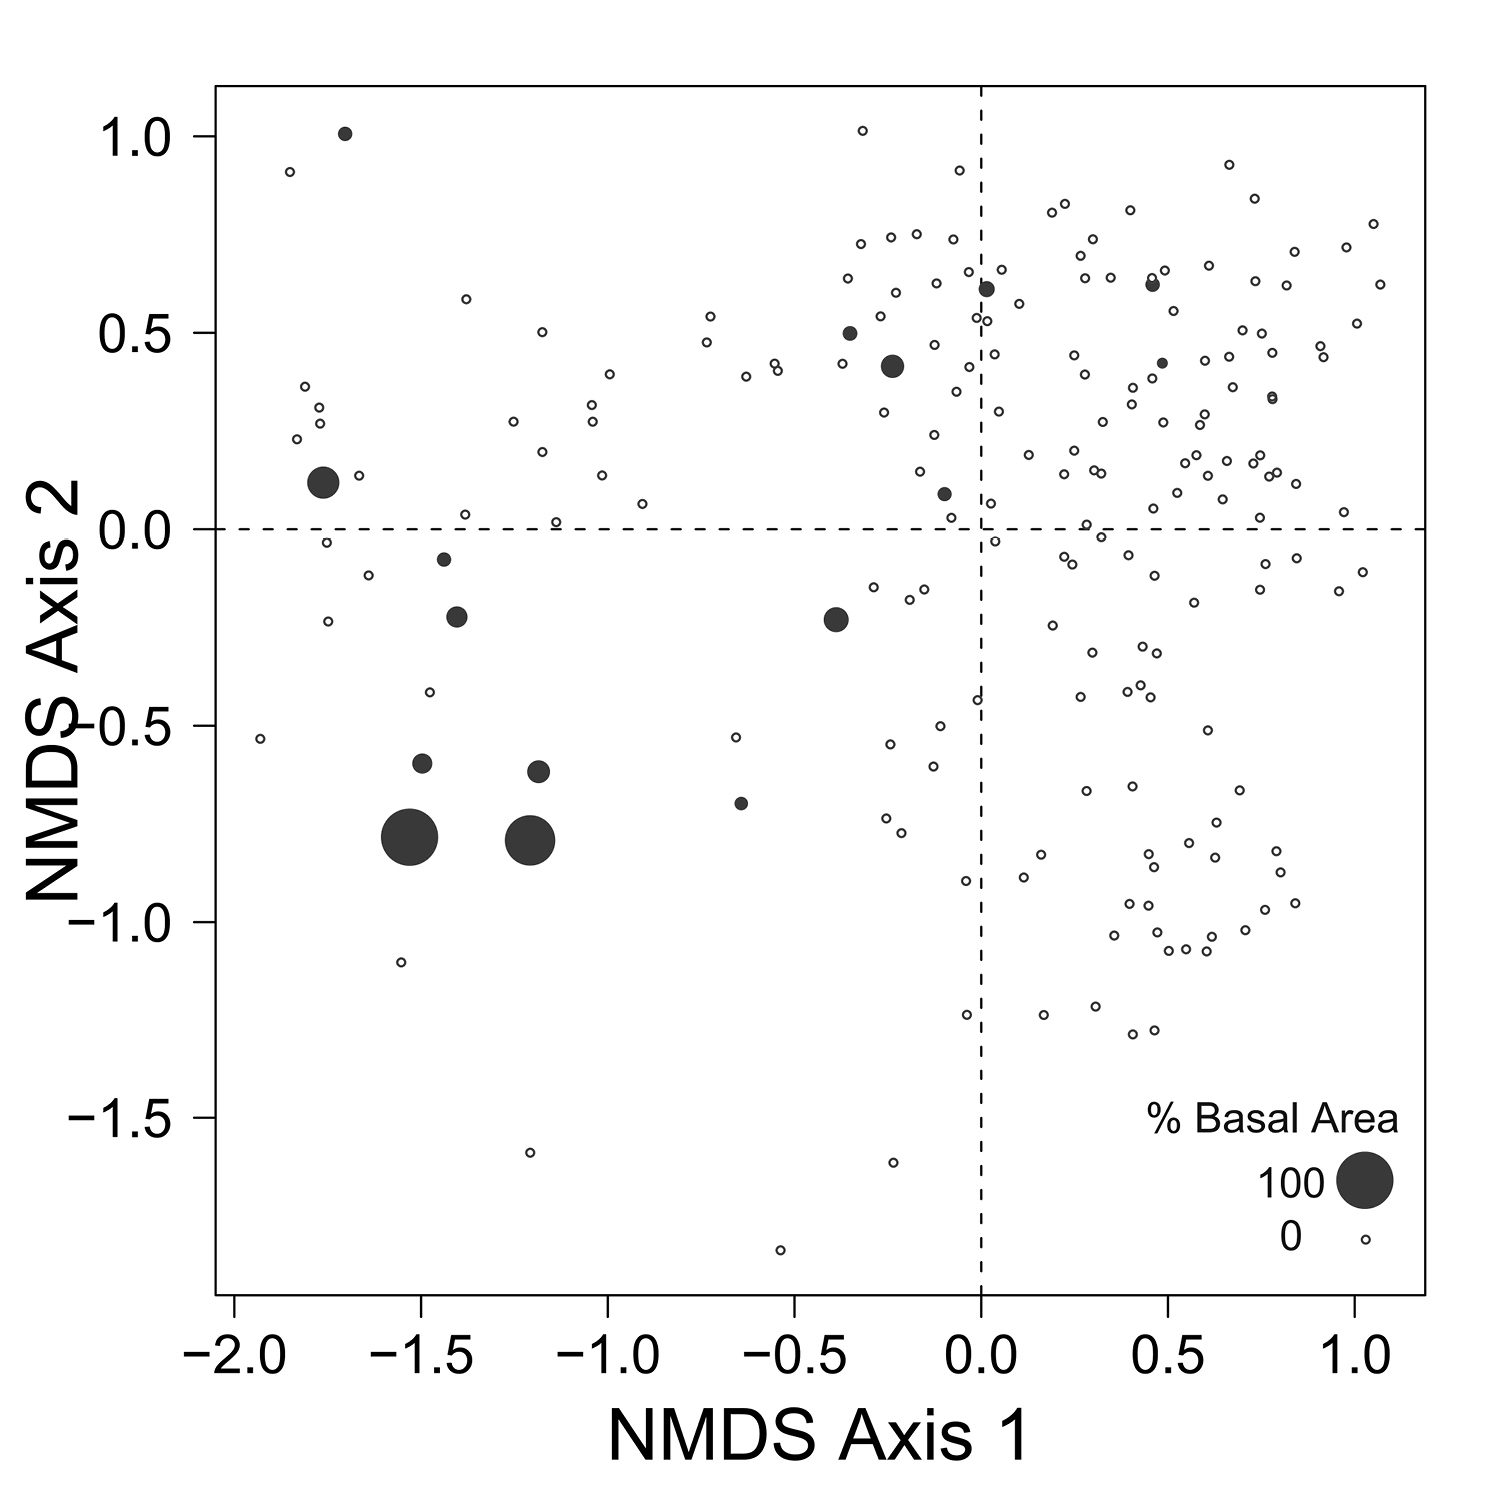
Despite the fact that this ordination was calculated strictly from the beetle data, relative basal area of each tree species is organized in an interpretable pattern when projected into the ordination space of Fig. 2. A detailed depiction of the fit for each tree species is provided in Figs 3 to 8. For example, the highest values of relative basal area for the most abundant tree species, Picea glauca (Fig. 3), were clearly concentrated in the first quadrant together with those for Abies balsamea (Fig. 4), which was more restricted in relation to beetle sites. Sites with maximum values of relative basal area for Populus balsamifera (Fig. 5) were concentrated mainly in the lower part of the fourth quadrant of the ordination, but some intermediate and low values were also encountered in the first quadrant. Populus tremuloides was mostly distributed on the right side of the ordination biplot and seems to perform best when sites are defined by beetles that are characteristic of the first quadrant (Fig. 6). The highest values of relative basal area for Picea mariana occurredtoward the negative end of the x-axis, especially in the second quadrant (Fig. 7). A few wetter sites placed in the third quadrant were dominated by Picea glauca (Fig. 3) and Larix laricina (Fig. 8).
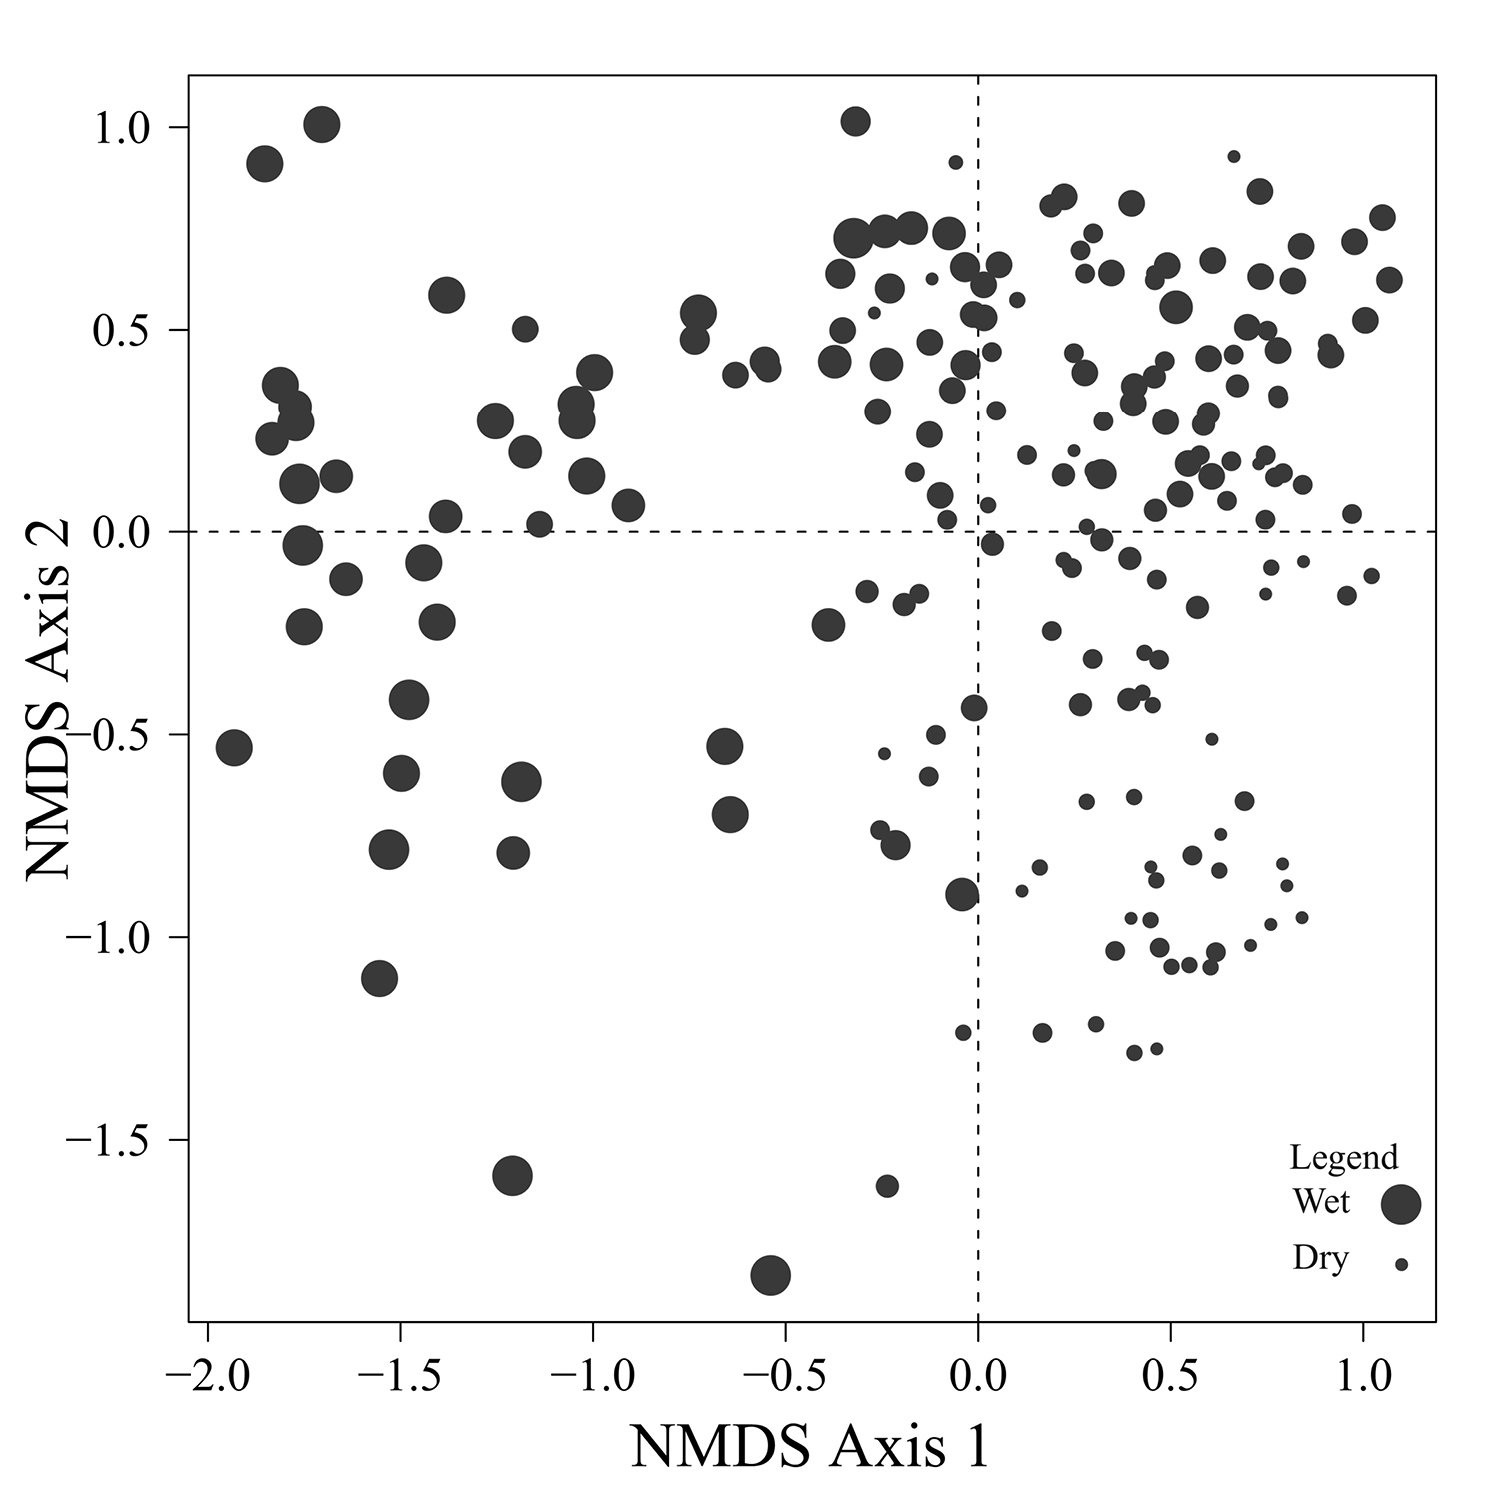
Fig. 9 provides a clear depiction of the drainage classes for each site on the ordination diagram. Sites on the right site of the ordination are generally better drained than sites on the left side of the ordination. Among the sites concentrated on the right side of the ordination, drier sites are mostly found below the x axis while mesic sites are found above the x axis.
Figure 3. Relative basal area of Picea glauca for the 193 sites plotted on the beetle ordination of figure 2.
Figure 4. Relative basal area of Abies balsamea for the 193 sites plotted on the beetle ordination of figure 2.
Figure 5. Relative basal area of Populus balsamifera for the 193 sites plotted on the beetle ordination of figure 2.
Figure 6. Relative basal area of Populus tremuloides for the 193 sites plotted on the beetle ordination of figure 2.
Figure 7. Relative basal area of Picea mariana for the 193 sites plotted on the beetle ordination of figure 2.
Figure 8. Relative basal area of Larix laricina for the 193 sites plotted on the beetle ordination of figure 2.
Figure 9. Drainage values for the 193 sites plotted on the beetle ordination of figure 2. High drainage values represent poorly drained sites.
Ground-beetles were collected in all sites, and in numbers large enough to allow robust statistical analysis. This feature alone contributes to the suitability of this beetle family as useful biodiversity indicators for the mixedwood boreal forest mosaic (
Eight of the species trapped only at the disturbed sites (all except Elaphrus clairvillei) are characteristic of open habitats (
The main ordination (Fig. 2) represents the landscape according to what portion of the overall beetle assemblage is found in each site. The fact that relative basal area of tree species shows a level of organization in ordination space (Fig. 2) suggests that as the ground-beetle assemblage shifts, the species included exploit different resources, and that availability of these resources vary with presence of particular tree species. It is also interesting to note that tree species group in the ordinations according to ecological similarities documented for these trees. Tree cover on the right side of the ordination, for example, is dominated by a combination of Picea glauca, Populus tremuloides, Populus balsamifera, and Abies balsamea. These species are characteristic of uplands in the lower foothills ecoregion of northwestern Alberta, occurring mainly in mesic to well-drained sites either in mixture or pure stands (
The distribution of carabids on the landscape may be explained in even more detail by isolating the connections to particular tree species in relation to what is known about habitat use of these carabids. For example, the beetle species arrayed around the centroid for Populus balsamifera (Agonum retractum, Trechus chalybeus, Platynus decentis, Patrobus foveocollis, and Pterostichus pensylvanicus; see Fig. 2) typically prefer moderately moist ground (
Calathus ingratus and Pterostichus adstrictus are considered as habitat generalists in non-riparian areas of the boreal zone (
Sites located in the first quadrant are dominated by high values of relative basal area for Picea glauca and Abies balsamea, and are associated with high abundances of Stereocerus haematopus, Calathus advena, and Pterostichus brevicornis (Fig. 2). All three of these species are regularly associated with coniferous forest (
Highest abundances of Pterostichus punctatissimus are concentrated in the second quadrant together with the highest relative basal area values for Picea mariana (Fig. 2). Pterostichus punctatissimus, Agonum gratiosum, and Platynus mannerheimii are all recognized to occur in coniferous forest (
Agonum sordens is characterized as hygrophilous (
Despite the fact that ecological linkage between the beetle assemblage and the canopy trees is well depicted using species centroids projected on the beetle ordination (Fig. 2), much ecological information remains hidden. Examination of Figs 3 to 6 reveals that Picea glauca, Populus tremuloides, Populus balsamifera, and Abies balsamea, each occupies a wide range of sites on the right side of the ordination corresponding to upland forest. In the boreal mixedwood forest, the beetle community seems not to respond to the habitat as a mixture of pure coniferous and deciduous stands, but rather, as stands supporting a gradual mixture of conifer and deciduous tree species. In the ordination space, sites for coniferous, mixed and deciduous forest are not tightly grouped according to these categories but are evenly dispersed along this gradient. This provides evidence that the ground-beetle community dynamics on this sort of landscape behaves more like one loosely integrated Gleasonian community instead of tight Clementsian species groups showing similar responses to resource distribution.
There is additional evidence that projecting centroids onto the ordination diagram fails to capture some significant ecological patterns. A few sites with high values of relative basal area for Picea glauca also group together at the lowest values of the x axis of the NMS ordination (Fig. 3). This is intriguing as these sites seem to host a very different beetle assemblage than most sites with high relative basal area of white spruce. The beetle catches were dominated by Pterostichus punctatissimus and Agonum gratiosum, but did not include either Stereocerus haematopus or Calathus advena, species that were characteristic of all other sites with high relative basal area of Picea glauca (Fig. 2). In these exceptional sites, Picea glauca (Fig. 3) grows with Larix laricina (Fig. 8) but the presence of Picea mariana that generally supports a beetle community characteristic of wet sites is less important (Fig. 7). In these circumstances, the carabid community is more typical of wet productive sites. Figure 9 combined with the results shown in Figure 3 confirm that white spruce occurring in the most poorly drained sites support a different assemblage than white spruce occurring on moderately to well-drained sites. Following the widely used approach of projecting Picea glauca distribution onto the ordination with a vector or, simply projecting the centroid for this species on the ordination diagram (Fig. 2), does not reveal this pattern. We suggest that this is evidence that non-linear gradients can affect arthropod community structure. Before such gradients can be studied and understood, they must be first revealed, something accomplished here by ordination in relation to basal area.
Patterns of association between beetle community structure and uncommon tree species having a restricted distribution on the landscape are of special interest in a conservation context. For example, Abies balsamea is at the northwestern edge of its continental range at EMEND and stands are scattered and restricted to narrow habitats (
A similar pattern of association appears between Larix laricina and Platynus mannerheimii (Fig. 2), both of which are uncommon species of the EMEND landscape (Table 1 and 2). Platynus mannerheimii is generally recognized in both North America and Scandinavia as being an uncommon element of the boreal beetle community, having narrow microhabitat requirements and being locally restricted to mires, old wet forests and fire skips (
In general, associations between carabid and tree species, as described previously, match species of the same rank order of abundance on the EMEND landscape (Table 1 and 2). For example, the beetle species collected in the highest number of sites (Stereocerus haematopus and Calathus advena) were associated with Picea glauca, the tree species similarly recorded from the highest number of sites. This is also true for the association between the carabids Pterostichus adstrictus and Calathus ingratus and the tree species, P .tremuloides (second highest number of sites). Pterostichus punctatissimus, the sixth most common carabid, was associated with Picea mariana (noted at the third highest number of sites). Likewise Agonum retractum, Trechus chalybeus, and Patrobus foveocollis were associated with Populus balsamifera (fourth highest number of sites), and Pterostichus brevicornis and Carabus chamissonis were predominately collected at sites with Abies balsamea (fifth highest number of sites). As outlined above, Agonum retractum and Platynus mannerheimii were associated with Larix laricina (recorded at the sixth highest number of sites). We suggest that each tree species indicates its own set of edaphic and perhaps even broader environmental conditions. If so, beetle species requiring conditions related to the most frequent tree encountered on a landscape will also be the most commonly encountered in systematic sampling efforts to the extent that beetle population sizes follow that of tree species. If a habitat is less frequent on a landscape, the beetle requiring this habitat should also be less frequently collected, and this is what we observed. Thus, including all tree species in stand-level forest inventories can have real practical value in developing regional conservation strategies.
ConclusionDespite the indirect nature of potential links between distributions of tree and ground-beetle species, the ecological features associated with their distributions appear to be similar, allowing us to discern surprisingly clear patterns of association. Variation in carabid assemblages over this section of the boreal forest reflects the specific presence of all tree species present on this landscape. It is unknown at present the extent to which these associations simply reflect a response to common features or if, perhaps, the trees themselves contribute to conditions (e.g., through quality of litter) that promote success of particular invertebrate species. Furthermore, although associations between ground-beetle and tree species are strong and interpretable, the potential implication for predicting distribution of other invertebrate taxa remains to be investigated.
Nevertheless, these observations are of interest for regional conservation purposes. Because the boreal forest covers vast areas, it is impossible in cost-effective practice to assess biodiversity reliably, and thus surrogates are needed (
We thank D. Lysk, D. Jensen, B. Shaughnessy, K. Cryer, I. Phillips, D. Hartley, J.P.Z. Bergeron as well as the EMEND field crew for their help in the field and in the laboratory. Discussions with T. Vinge, T.T Work, J.M. Jacobs, T.P. Cobb and D. W. Langor greatly contributed to the development of the ideas and concepts discussed in this paper.
We take special pleasure in dedicating this paper to Ross and Joyce Bell as part of the Bell Fest. We think it is an example of the detailed approach to finding relationships between carabids and their environment that they practiced and taught. The work was supported financially by our industrial forestry partners, Canadian Forest Products, Ltd. and Daishowa-Marubeni International, Ltd., as well as Alberta Sustainable Resource Development, the Sustainable Forest Management Network, the Canadian Forest Service and the Natural Sciences and Engineering Research Council of Canada (NSERC).
