


(C) 2011 Satish Pande. This is an open access article distributed under the terms of the Creative Commons Attribution License, which permits unrestricted use, distribution, and reproduction in any medium, provided the original author and source are credited.
For reference, use of the paginated PDF or printed version of this article is recommended.
Biometric analysis helps in sex differentiation, understanding development and for studies of avian biology such as foraging ecology, evolutionary ecology, and survivorship. We suggest that biometry can also be a reliable, practical and inexpensive tool to determine the age of nestlings in the field by non-invasive methods. As an example we studied the biometry of wing, culmen, talon, tarsus and body mass of nestling southern Indian Spotted Owlets (Athene brama brama). Based on the growth pattern analysis using logistic growth model, discriminant analysis and CHAID (Chi-squared Automatic Interaction Detection) based decision tree, we show that biometry of nestling Spotted Owlets is an easy, reliable and inexpensive method to determine nestling age and to assess growth rate and relative nutritional status. These biometric parameters also allow us to predict their ability to initiate first flight from the nest site. This method is described here for the first time and we postulate that such charts can be devised for other avian species as well, so as to assist conservation biologists and bird rescuers.
Spotted Owlet, Age, Biometry, Nestling, Flight-Predictor
Adult and juvenile birds of the same species are of similar size but are differentiated on the basis of plumage, fault bars, tail shape, castellated feathers, bill shape, cere color, and other parameters (eg.,
Our ability to monitor and understand biometric parameters is important from ecological and conservation perspectives. During the nestling period, these parameters allow one to evaluate parental feeding ability, and to monitor relative nutritional condition between siblings and between neighboring nests of different habitats. Parameters can also help in the rehabilitation of orphaned nestlings in determining whether they are fed appropriately so that growth rates are comparable to nestlings in the wild.
Retrograde calculation of hatching and egg-laying dates can be accurately determined from the age of the nestling or from time of fledging (Blotzheim and Bauer 1980;
In this paper we show how the use of biometry can be a reliable, practical and inexpensive tool to determine the age of nestlings in the field by non-invasive methods, and by taking the minimum required measurements through the use of a flow chart as described. A method to estimate the time of acquiring flight ability using biometric parameters is also investigated and described. We have taken southern Indian Spotted Owlets (Athene brama brama) as an example. Southern Indian Spotted Owlet Athene brama brama is a valid subspecies of spotted owlet Athene brama and is endemic to this zoogeographical region (Ali and Ripley 1969;
A total of 53 active nests of southern Indian Spotted Owlet Athene brama brama were included in our study. The study was conducted for two consecutive years (2003 and 2004) in and around Saswad (18°19'N to 18°20'N and 73°57'E to 74°01'E) in Pune district, Maharashtra, India. The nests were identified by: a) direct information about known nest sites from local residents, b) passive auditory surveys by authors at dawn and dusk during the breeding season, December to April, when owlets are most vocal, c) searching for probable nest sites, when at least three visits to each site were made, d) by requesting local people to inform about new sites found, after making them familiar about the ongoing study through a public-outreach program.
Out of the 53 active nests found, seven nests were intensively studied during the 2003 breeding season for the documentation of breeding biology and biometry. Biometry of eight nestlings from hatching till fledging, from 0 to 32 days, was done at weekly intervals, and the data was entered serially for each chick. A total of 136 measurements were taken, averaging 17 measurements per nestling. We included only those nests that were easily accessible where the exact dates of egg laying and hatching were recorded. Nestlings that died in the middle of the study were excluded. We ringed each nestling with a numbered aluminum ring placed on the tarsus to facilitate individual identification of each nestling. Sexes are alike in external appearance and thus we could not separate between the nestlings in this study based on their sexes (Hipkis et al. 2002).
We used a Vernier calipers (+0.001mm), wing-stop and tail rulers (0.1mm) for measurement, and Pesola spring scales (60 gm, 100 gm) to weigh body mass. In order to be consistent, only two trained researchers (AP & SP) took all measurements. We measured the biometry of five parameters: (a) wing chord: carpal joint to the tip of the longest primary with the wing flattened, (b) tarsus: ankle joint to the attachment of toes where measurements were taken using flexion at proximal and distal joints, (c) talon: length of claw of the middle toe was measured with Vernier caliper from the point of insertion to the tip, (d) culmen: the exposed part of the culmen from the cere to the tip, (e) body mass: all body mass was taken at sunset. Allowing for the fact that Spotted Owlets forage at dusk or at night, this assured an empty stomach, which minimized the effect of meals. This also caused minimal disturbance to the owlets, which resumed their crepuscular and nocturnal activities immediately after our visits to the nests.
Statistical analysisTo each of the biometric character we fitted the logistic model to understand its growth pattern and growth rate (
Character value = a/[1+b*exp(-c*Age)] (1)
Where a, b and c are positive constants. Constant a signifies maximum possible value of the character, constant b signifies the delay in growth associated with the lag phase and constant c is the growth rate. The goodness of fit was determined by regression coefficient.
We also studied the growth patterns by nullifying the effect of size using Principle Component Analysis (PCA) as described by
We performed Discriminant Factor Analysis (DFA) to understand whether different age groups form significantly different clusters and which factors can best discriminate between the clusters (
To predict the nestling age using biometric characters we constructed decision tree (regression tree) using exhaustive CHAID (Chi-squared Automatic Interaction Detection) algorithm. At each step, CHAID chooses the independent (predictor) variable that has the strongest interaction with the dependent variable. Categories of each predictor are merged if they are not significantly different with respect to the dependent variable (
Observations on the biometric parameters of nestling Spotted Owlets of different age groups are given in Table 1. All biometric characters showed a good fit to logistic model of growth (p < 0.01; Fig. 1). Among the five biometric characters talon length had the highest growth rate (2.39 mm/week) followed by body mass (2.2 g/week), while wing chord length showed the least growth rate (1.56 mm/week). Even though the rate at which both culmen and wing chord increased were similar, wing chord showed initial lag and thus attained a mature chord length at 5 weeks (Fig. 2) while culmen attained maximum length in only two weeks.
Mean, standard deviation and coefficient of variation of biometric parameters for age in weeks of nestling Spotted Owlets (Athene brama brama).
| Character | 1st Week(n =11) | 2nd Week(n =11) | 3rd Week(n = 6) | 4th Week(n = 6) | 5th Week(n = 6) | |||||
|---|---|---|---|---|---|---|---|---|---|---|
| xˉ (sd) | CV | xˉ (sd) | CV | xˉ (sd) | CV | xˉ (sd) | CV | xˉ (sd) | CV | |
| Body Mass (g) | 23.36 (9.96) | 42.64 | 82.73 (10.08) | 12.19 | 117.17 (6.62) | 5.65 | 113.83 (12.50) | 10.98 | 126.83 (8.38) | 6.60 |
| Wing Chord (mm) | 13.06 (3.49) | 26.69 | 33.45 (10.20) | 30.48 | 87.42 (5.14) | 5.88 | 103.17 (6.68) | 6.47 | 121.67 (6.53) | 5.37 |
| Talon (mm) | 2.46 (0.81) | 32.89 | 6.43 (0.28) | 4.29 | 7.42 (0.25) | 3.35 | 7.48 (0.26) | 3.53 | 7.85 (0.10) | 1.34 |
| Tarsus (mm) | 14.93 (3.16) | 21.18 | 30.17 (2.91) | 9.66 | 36.22 (1.22) | 3.36 | 38.40 (2.02) | 5.26 | 39.27 (1.76) | 4.49 |
| Culmen (mm) | 6.74 (0.90) | 13.43 | 10.5 (0.40) | 3.86 | 11.33 (0.23) | 2.06 | 11.57 (3.36) | 3.36 | 12.40 (0.41) | 3.35 |
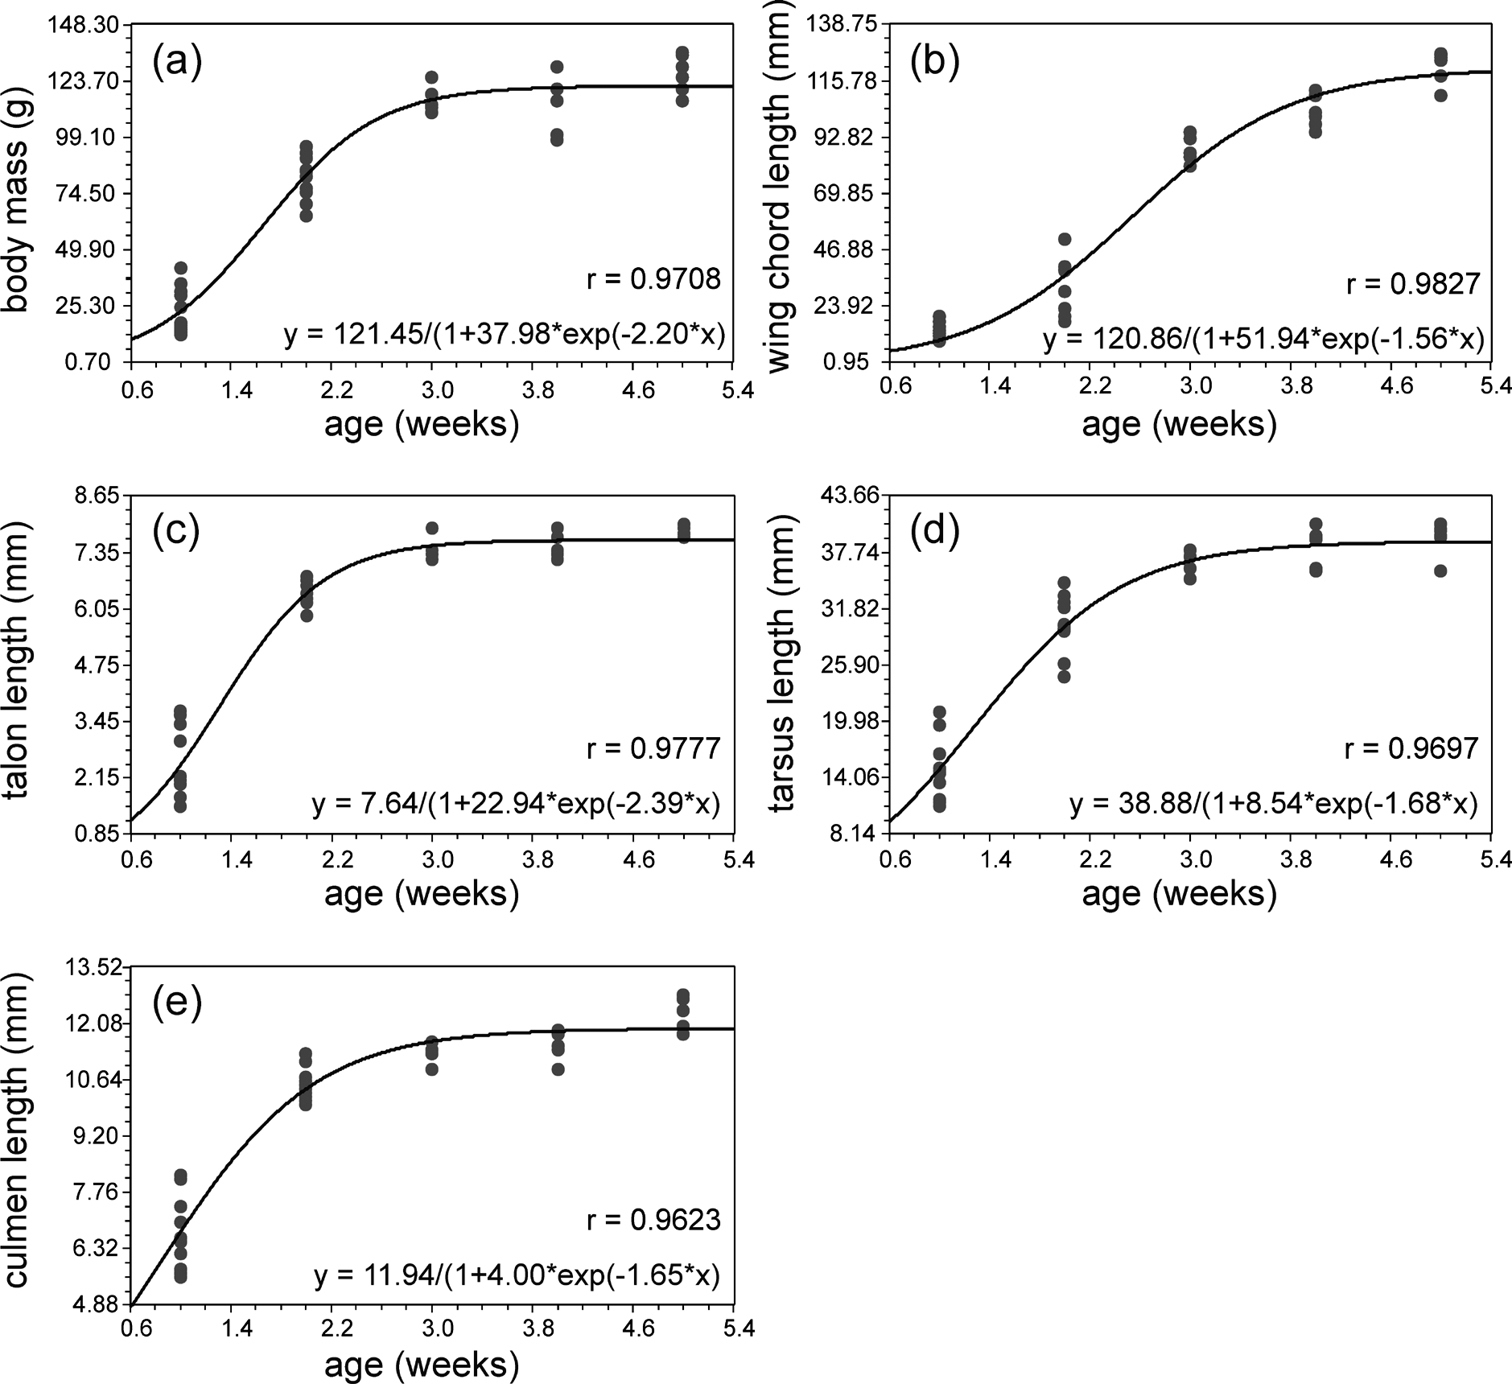
Biometry ofbody mass, wing chord length, talon length, tarsus length and culmen length plotted against the age of nestling Spotted Owlets (Athene brama brama). The smoothed curve is the logistic growth model fitted to the data.
After a small lag body mass displayed linear growth with a steep rise through 2.5 weeks. Eighty percent of adult growth was attained at the end of 2 weeks (Fig. 1a). At 0–1 week the average mean mass was 26.8 gm (11.1 SD, range 13–42, n = 6) and at 4–5 weeks was 125 gm (7.9, 115–135, n = 5). Coefficient of variation (CoV, 41.46) was highest at one week. The nestlings attained 91.9% of adult body mass at 4.5 weeks, and no significant change was found up to 6.5 weeks. We observed a drop in mass at 3.5 weeks, one week prior to fledging (Table 1).
Eigenvalues of the first principle component for four ln-transformed biometric characters for eachage class along with percent variability explained by each principle axis and angle theta between eigenvector and isometric vector.
| Age | Characters | Variability (%) | theta | |||
|---|---|---|---|---|---|---|
| wing | culmen | talon | tarsus | |||
| Week 1 | 0.5873 | 0.2099 | 0.7197 | 0.3051 | 76.14423 | 0.4252 |
| Week 2 | 0.9869 | 0.0124 | 0.0549 | 0.1515 | 91.54507 | 0.9242 |
| Week 3 | 0.8562 | 0.0239 | -0.4256 | 0.292 | 73.92306 | 1.1886 |
| Week 4 | 0.6962 | 0.2667 | 0.338 | -0.5744 | 87.19698 | 1.1987 |
| Week 5 | 0.9299 | 0.3455 | -0.0074 | -0.1261 | 53.56812 | 0.963 |
Out of five biometric parameters, wing chord length showed the longest lag phase. It started growing rapidly only after two weeks and attained maximum length after five weeks (Fig. 1b, 2). The average mean value for wing growth at 0–1 week was 13.98mm (3.67, 10.0–20.0, n = 8) and at 4–4.5 weeks 120 mm (7.7, 110–127, n = 4). CoV (35.3) was highest in the second week. This might be due to sex differences in the nestlings, but because of our inability to sex the birds this remains untested. Similar difference during the first week is seen in growth of other parameters also, which accounts for the higher CoVvalues in this period. However, this aspect needs to be evaluated separately in a future study. Wing chord length is 33 % of adult size at two weeks, 80 % of adult size at 4.5 weeks and 85.4 % adult size at 6.5 weeks.
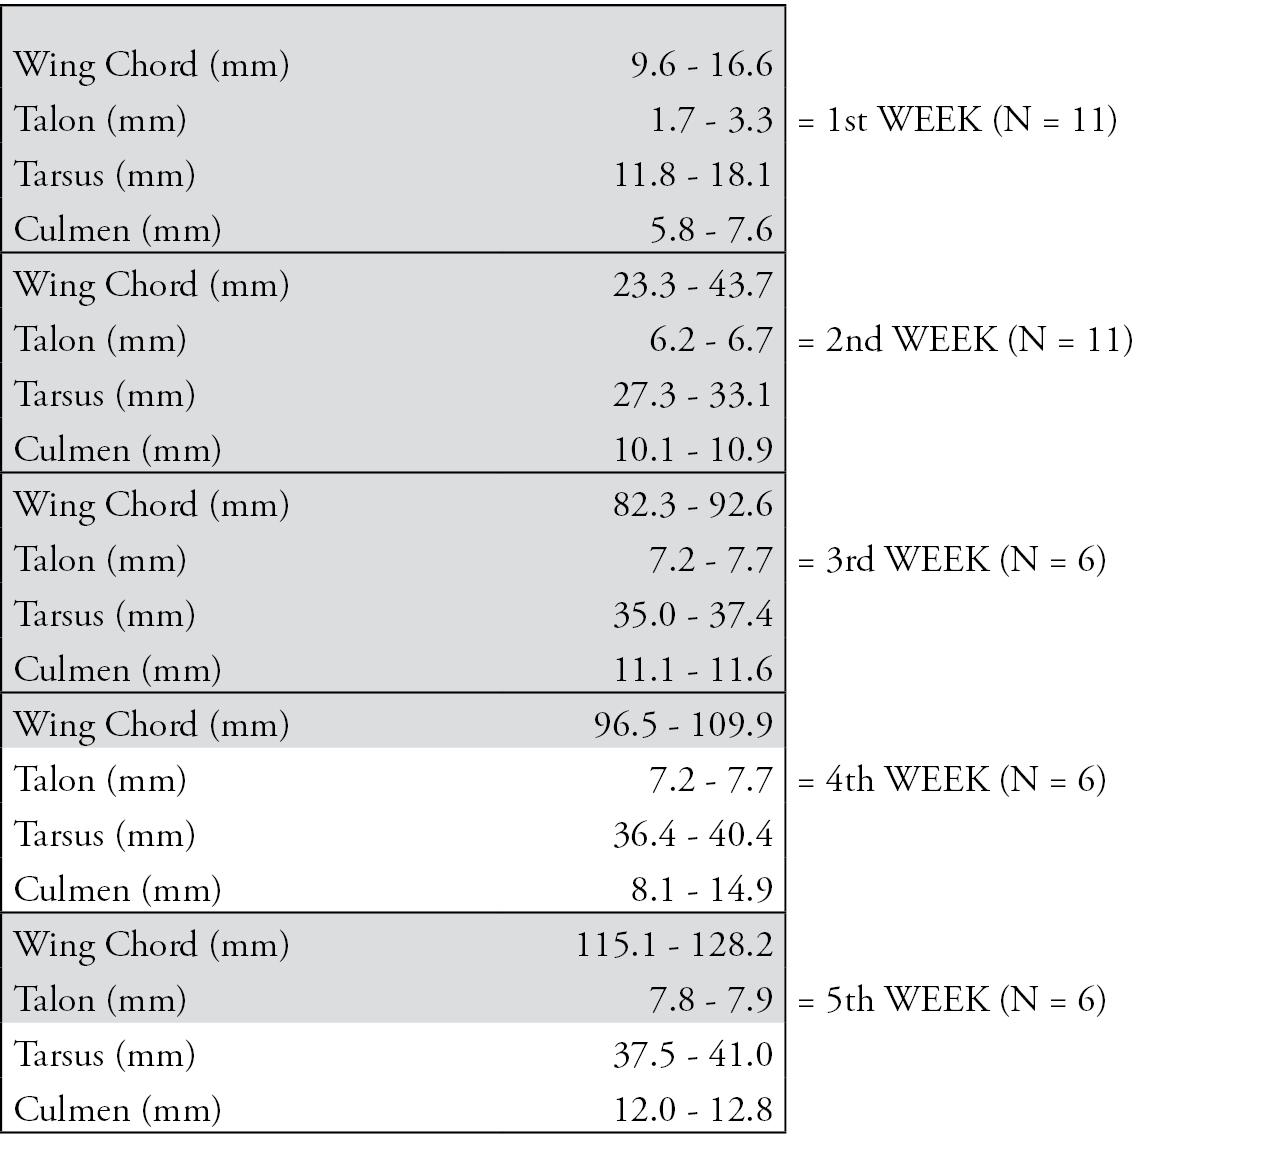
Identification key for ageing nestling Spotted Owlets (Athene brama brama) based on biometrics. Highlighted in grey are those parameters that are most reliable for field use.
The claw of the middle toe, talon, had the maximum growth rate among the five characters. It showed linear growth up to first two weeks and then it slowed down and attained mature size in the third week (Fig 1c). At 0–1 weeks the average mean value was 2.5 mm (0.84, 2–4, n = 5) and at 4–4.5 weeks was 7.9 mm. Adult size was attained at 4.5 weeks. CoV(33.96) was greatest at 0–1 week (Table 1).
Tarsus showed a steep linear growth up to 2.5 weeks, and adult size was attained at 4.5 weeks (Fig. 1d). At 0–1 week the average mean size was 156 mm (3.5, 110–210, n = 7) and at 4–4.5 weeks was changed to average 389 mm (2.1, 360–410, n = 4). CoV (42.88) was greatest at 1–2 weeks (Table 1).
Culmen had a growth rate equal to the wing chord length however it did not show any lag period and grew rapidly from hatching to the second week (Fig. 1e). Culmen attained adult size in the third week. At 0–1 weeks the average mean size was 6.94 mm (0.96, 6–8, n = 7) and at 4–5 weeks was 12.33 mm (0.5, 12–13, n = 4). CoV (13.8) was highest at 0–1 weeks (Table 1).
In the post-fledging and adult Spotted Owlets showed following biometric characters (n = 8): wing chord 150 mm (145–154), body mass 240 gm (235–245), talon 7.85 mm (7.8–7.9), tarsus 37 mm (33–40), culmen 14.5 mm (14–15)(Ali and Ripley 1969; SP, unpubl. data). One ringed fledgling was recaptured at 6.5 weeks following hatching, 2 weeks after fledging. Its biometrics were: wing chord 126 mm (84% of adult), body mass 125 gm (52.1%), talon 7.9 mm (100%), tarsus 40 mm (108%), and culmen 17 mm (117%). A sibling fledgling of this cohort was also recaptured but only body mass was measured.
We also studied the developmental patterns in the size adjusted characters and compared it with the isometric developmental pattern (Table 2). In the first week of development all other characters showed negative allometric relationship (i.e. relationship less than 1) to talon length (eg. Wing chord length / talon length = 0.5873/0.7197 = 0.82 based on Table 2). For second and third weeks all characters had negative allometric relationship with wing chord length followed by tarsus. For the fourth week all characters had negative allometric relationship with wing chord length followed by talon. While, for fifth week all characters had negative allometric relationship with wing chord length followed by culmen. The angle theta between the eigenvectors and isometric vector increased till fourth week.
Predicting age from biometric charactersGrowth rate of different parameters varied significantly with respect to age. This allowed us to derive useful biometric parameters to predict age during the nestling period (Fig. 2). The Discriminant Factor Analysis (DFA) of the data extracted four factors but only first two factors had eigenvalues more than one. The first factor explained 84.86% of the total variation in the data while the second factor explained 14.46% of the total variation and together they explained 99.32% of the variation. All five age groups formed significantly different clusters in DFA (Pillay’s trace = 2.211, F = 8.408, p < 0.0001). Clusters of the first two weeks showed significantly separate clusters while clusters of remaining weeks had partial overlaps (Fig. 3). All factors had high factor loading on the first factor but the maximum was for wing chord length and tarsus length (Fig. 3). Fig. 3 also depicts that first week nestlings can be differentiated from second week nestlings with the biometric characters talon length, culmen length and tarsus length while the nestlings of the second, third, forth and fifth weeks can be primarily separated from each other only using the wing chord length. These observations were consistent with the PCA analysis (Table 2).
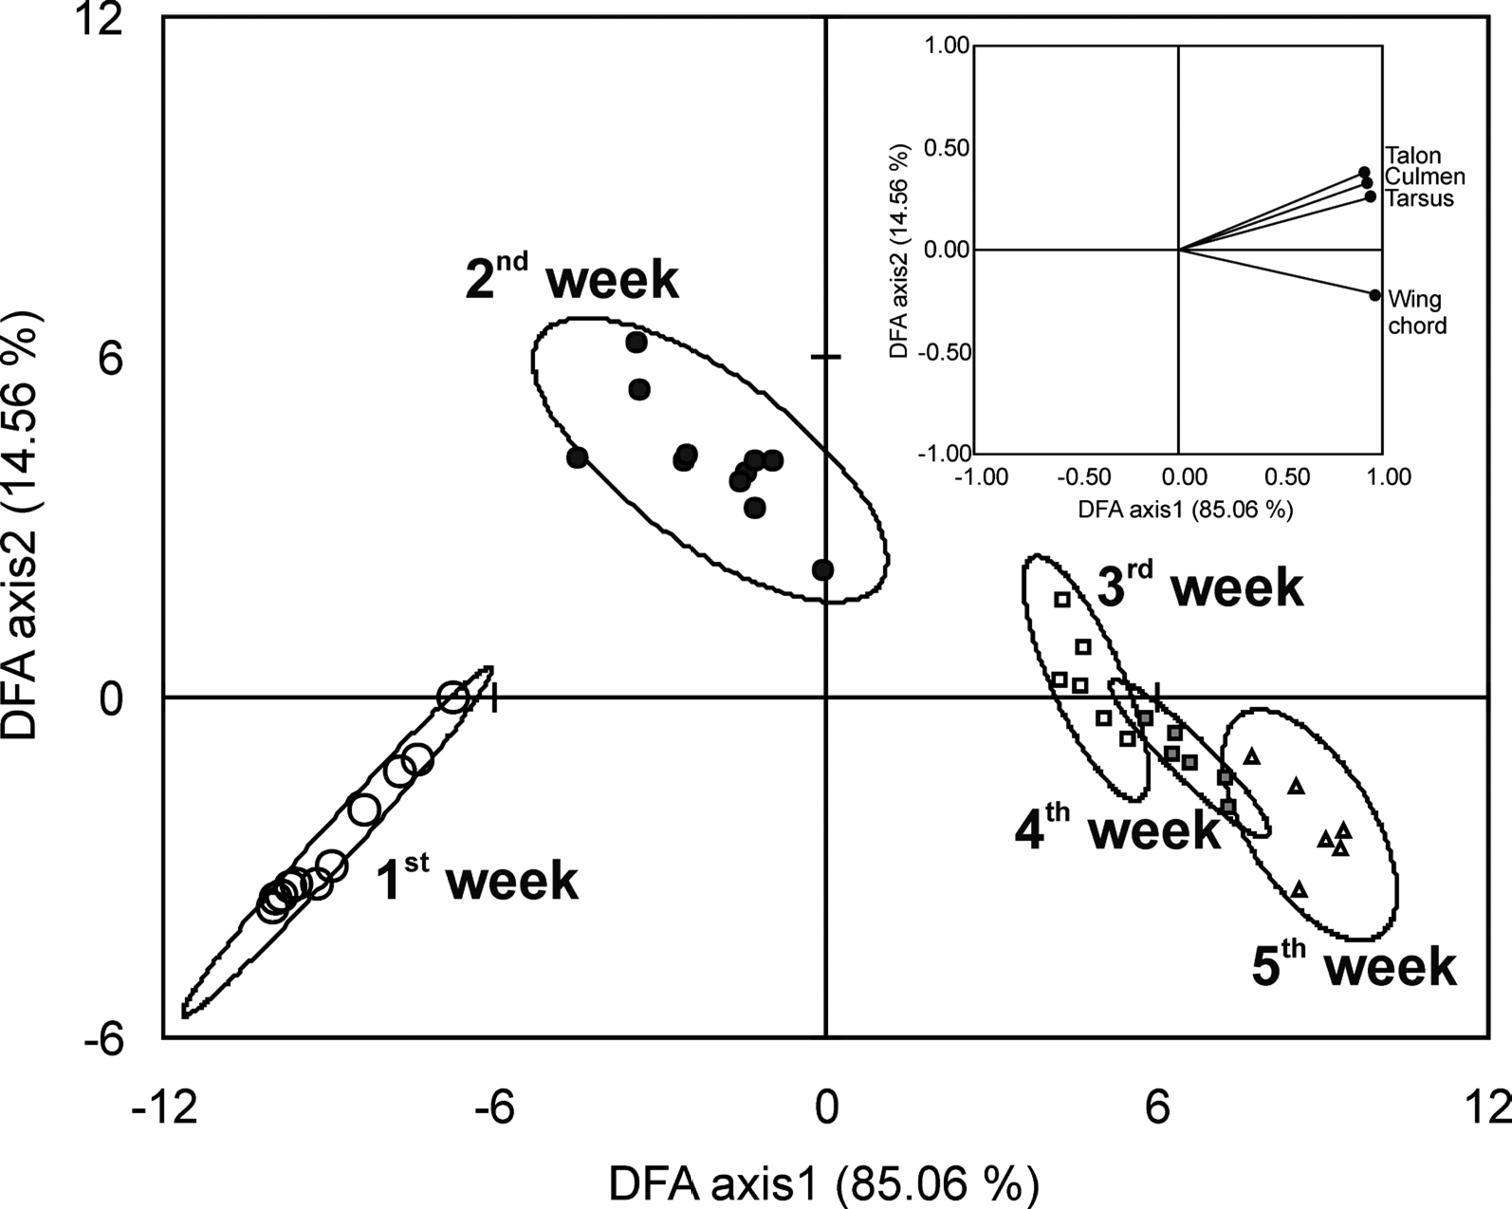
Discriminant Factor Analysis of the age classes based on five biometric characters of nestling Spotted Owlets (Athene brama brama). The figure shows the factor scores of observations. Factor loading of variables is given in the inset. Percentages in parenthesis are percent variation explained by each factor.
To predict the age of a nestling from the minimum biometric characters, we constructed a regression tree using CHAID algorithm. The regression tree could separate the nestling of different ages using three characters - wing chord length, culmen length and tarsus length (Fig. 4). The decision rules which separate the nestling of different ages according to Fig. 4 are as follows.
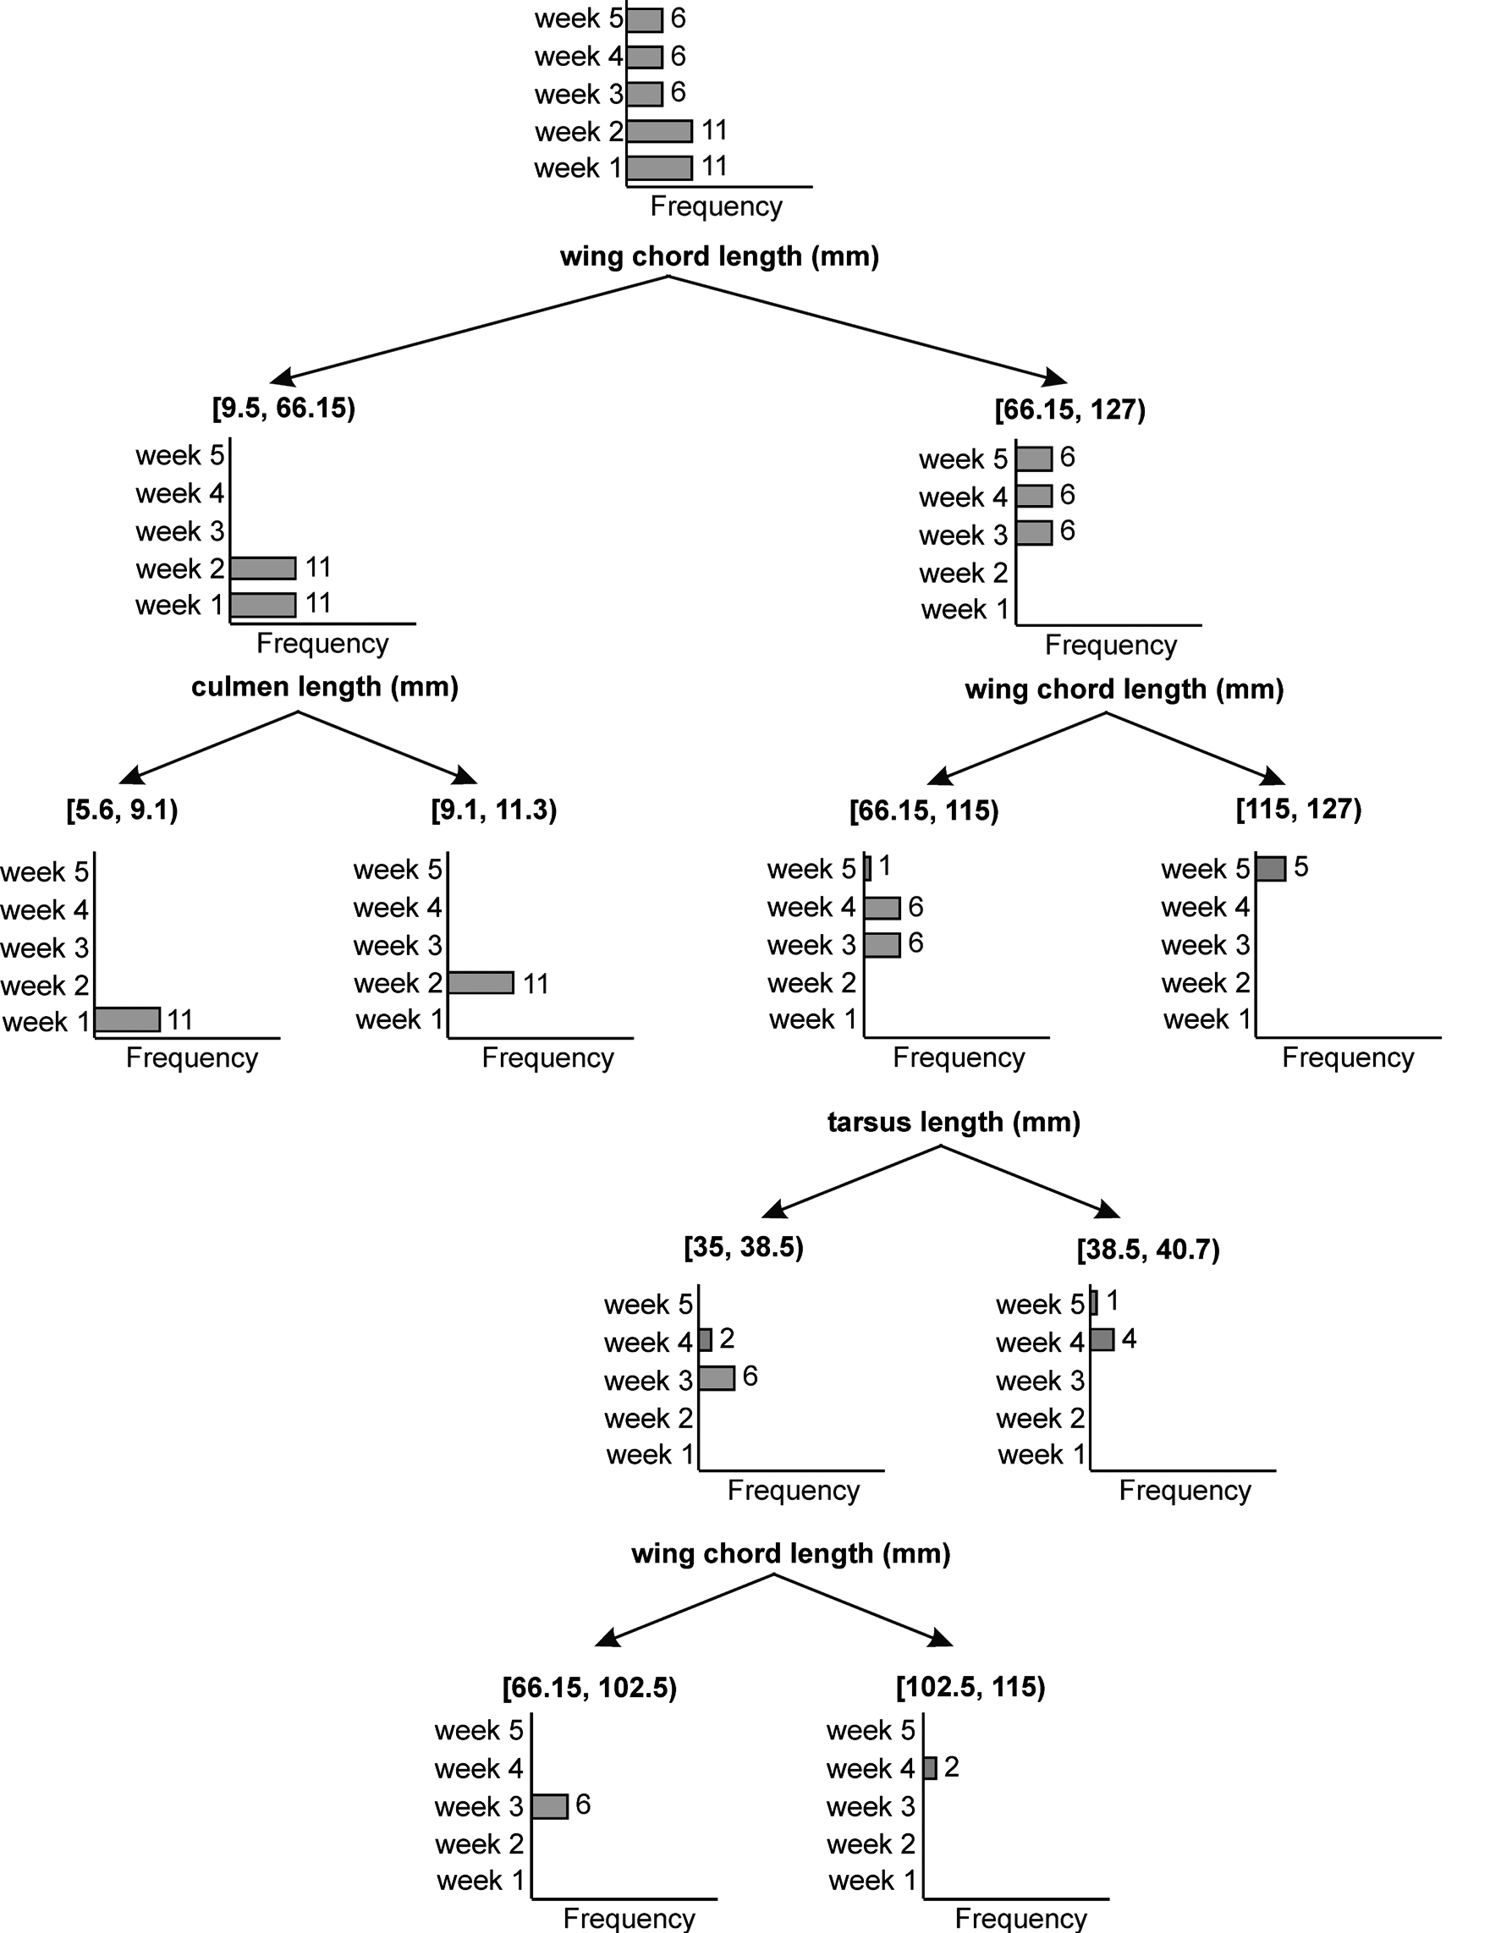
Decision tree based on exhaustive CHAID algorithm. Bar diagrams show the number of individuals in each age class 1 to 5 weeks of nestling Spotted Owlets (Athene brama brama). Numbers on the bars indicate individuals in the given age class.
If wing chord length (mm) is in the range [9.5, 66.15] then Age = 1 week in 50% of cases.
If wing chord length (mm) is in the range [66.15, 127] then Age = 3 weeks in 33.3% of cases.
If culmen length (mm) is in the range [5.6, 9.1] and wing chord length (mm) is in the range [9.5, 66.15] then Age = 1 week in 100% of cases.
If culmen length (mm) is in the range [9.1, 11.3] and wing chord length (mm) is in the range [9.5, 66.15] then Age = 2 weeks in 100% of cases.
If wing chord length (mm) is in the range [66.15, 115] then Age = 3 weeks in 46.2% of cases.
If wing chord length (mm) is in the range [115, 127] then Age = 5 weeks in 100% of cases.
If tarsus length (mm) is in the range [35, 38.5] and wing chord length (mm) is in the range [66.15, 115] then Age = 3 in 75% of cases.
If tarsus length (mm) is in the range in [38.5, 40.7] and wing chord length (mm) is in the range [66.15, 115] then Age = 4 weeks in 80% of cases.
If wing chord length (mm) is in the range [66.15, 102.5] and tarsus length (mm) is in the range [35, 38.5] then Age = 3 weeks in 100% of cases.
If wing chord length (mm) is in the range [102.5, 115] and tarsus is in the range [35, 38.5] then Age = 4 weeks in 100% of cases.
However, we also present a simple flow-chart style of the biometrics with the minimum-maximum measurements (Fig. 2). In this case all five parameters were important to identify the age of the nestling during the first three weeks post-hatching. But only wing chord length was a reliable parameter for the whole study period, especially during the fourth and fifth weeks. Talon growth in the 3rd and 4th week was similar but greater in the 5th week. Tarsus and culmen were reliable only for the first three weeks of post-hatching growth.
Predicting capacity of flightCorrelation between wing chord size and body mass was examined in order to understand when the fledglings are capable of flight. Examination of biometric data of mass gain and wing chord growth revealed that in the early nestling period the growth rate of wing size was less than that of mass, but was equal at 4.5 weeks.
Based on the above, we devised a formula to examine this correlation and determine the optimal wing chord length to body mass ratio to predict when the nestling would be capable of initiating its first attempt at flight.
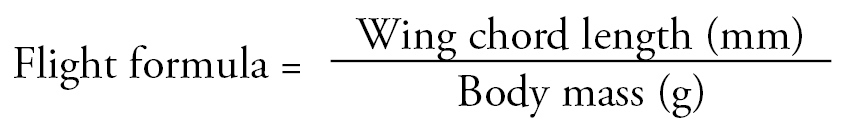
The average value of flight formula of fifth week nestling was 0.96 while nestlings of younger age showed lesser values (Fig. 5). Nestlings of age 1st to 4th week showed average flight formula values 0.59, 0.41, 0.75 and 0.91 respectively. Adults had a test value of 0.97 for males (n = 7) and 0.97 for females (n = 6). However, two fledglings that were flying well at 6.5 weeks showed a test value of 0.99.
Flight formula for different age groups of nestling Spotted Owlets (Athene brama brama). Box plot of flight formula index are plotted for different age groups. When the flight formula approaches unity birds are ready to fly.
In this study we have used only externally measured biometric parameters in order to understand nestling growth rate and to present an idea of how we can use these data to help future studies that may need to evaluate age of hatchlings in Spotted Owlets. However, we consider our limited sources to also be a limiting factor in the depth to which this study could be done at present. Our inability to sex individuals at the nest prevents us from knowing the differential growth rates of males compared to females.
In our study, all five biometric parameters studied in Spotted Owlets showed logistic growth during the nestling period from hatching till 4.5 weeks when they fledged. The growth rate of all the parameters examined in this study is differential, this heterochrony is used to estimate the age of the nestlings. Three parameters - talon, tarsus and culmen - achieve 100 % growth at 4.5 weeks, while body mass gain is 89% and wing chord growth is 80% of adults at 4.5 weeks.
We attribute this differential growth to the required capabilities that enable fledging. Upon fledging each of the individuals has to fend for itself – from predators and for food. This requires fully developed talons, culmen and tarsus, and a significant increase in body mass. In many cases we have observed Spotted Owlets nestlings - similar to many other owl species - walk out of the nest hole and perch on branches of the nest tree prior to gaining the ability of flight. We assume that the reason for this is to escape increased risk of predation at the nest, where the stench and odor from accumulated pellets, fecal matter and other debris is likely to attract predators. We base this assumption on our having documented predation of eggs and nestlings from the nest hole by Small Indian Civet (Viverricula indica) and House Crows (Corvus splendens). We realize that predation avoidance is only one of many reasons, and it is obvious that it’s impossible to learn to fly while housed inside a small, crowded nest cavity.
Owing to the fact that the mean values of wing chord, tarsus and body mass differed significantly between the age groups, based on the flow chart, a comparison of the field measurement with our data will allow the researcher to estimate age with a high level of accuracy. We suggest that only three characters (tarsus length, culmen length and wing chord length) are sufficient for determining the age of the nestling.
The estimation of nestling age from this flow chart is useful for conservation and rescue work. The biometric parameters obtained can be compared with the values of various parameters plotted against age in normal wild nestlings given in this paper. From this normal base line trend, one may evaluate the growth and assess the nutritional status of nestlings reared in an orphanage or by foster parents. If a discrepancy is apparent, appropriate corrective measures can be taken by adjustments in feeding.
The nestlings attained 91.9% of adult body mass at 4.5 weeks but experienced a drop in mass at 3.5 weeks, one week prior to fledging. This trend is also recorded in other birds of prey towards the end of nestling stage and can be explained as a response to achieve appropriate wing loading in order to make the first flight easier (
An analysis of the wing chord length and the body mass using our flight formula (eq. 2) suggests that as the nestling approaches maturity and is capable of first attempt of flight the flight formula value approached unity. In the simplest words our analysis shows that as the wing chord length (mm) approaches body mass (g) the bird becomes capable of flight. This finding is important for rescued fledglings that have suffered injuries or fractures, and for which, appropriate time of release needs to be calculated. The optimal body mass to wing chord ratio helps decide the amount of feeding and time required between rescue and release. We have observed that hand-reared nestlings and rehabilitated adult owls may exhibit good wing flapping, but do not immediately take flight when released. Hence, with the application of our formula one can predict the capability of flight and thus prevent predation after release.
In summary, biometry of wing, body mass, talon, tarsus and culmen of nestling Spotted Owlets is an easy, reliable and inexpensive method to determine nestling age, to assess growth rate and nutritional status, and to predict ability to initiate first flight. This method is described here for the first time for Spotted Owlets, and we postulate that such charts can be devised for other avian species as well.
We thank Anand Pandit and Ashish Bavdekar provided the facilities for this analysis at K. E. M. Hospital and Research Center, Pune. Field work was assisted by Banda Pednekar, Pramod Pawashe, Prashant Deshpande, Kumar Pawar and Unmesh Barbhai. Susan Craig improved an earlier draft of the paper. The study was assisted by the Vatsala Joshi Grant donated by Govind Mudholkar, Rochester, New York, to ELA Foundation, Pune. We are grateful to Indian Forest Department for allowing the study.