


(C) 2011 Chin-Fah Wang. This is an open access article distributed under the terms of the Creative Commons Attribution License, which permits unrestricted use, distribution, and reproduction in any medium, provided the original author and source are credited.
For reference, use of the paginated PDF or printed version of this article is recommended.
Morphological variation of Huangiella lanyuensis (Huang, 2001) and Tumoris sanasaii Huang, 2001 from Taiwan was analyzed using multivariate statistical methods. We show that these species are the same and propose to use the name Tumoris sanasaii. No significant differences between populations from Lanyu and Green Island (type localities for Huangiella lanyuensis and Tumoris sanasaii, respectively) were found; however, mites from Yangmingshan (northern Taiwan) differed substantially from these two groups. Synonymy resulted from our study is as follows: Huangiella Kammerer, 2006 is a junior synonym of Tumoris Huang, 2001; Absentia lanyuensis Huang, 2001 is a junior synonym of Tumoris sanasaii Huang, 2001. We also study the sexual variation of populations from Green Island. The result showed the females significantly larger than the males at 17 variables.
Multivariate analysis, Eriophyid mites, Lanyu, Green Island, valid name, Tumoris sanasaii
Eriophyid mites, also known as gall, blister, erineum,
bud and rust mites, have more than 200 genera and about 3700
described species worldwide (
Here we add another mite population from Symplocos cochinchinensis cochinchinensis in northern Taiwan and made several morphometric analyses to determine if these groups are distinct. Sexual variation in the Green Island population was also analyed by multivariate analysis to reveal the morphological difference between sexes.
Materials and methods Acquisition of specimens and preparation of slide specimensSpecimens used in the present study were collected from Lanyu (22°2'45", 121°31'50") in 31-Aug.-1994, 18-Aug.-1998 and 28-May-2008, from Green Island (22°39'52", 121°29'17") in 5-Jun.-2000 (collected from different trees), and from Yangmingshan (25°10'15", 121°34'26") in 18-Aug.-1999 and 24-Aug.-1999 (prepared and measured by CFW and KWH). Specimen mounting was followed by
Through microscopic examination, 136 out of the 246 slides prepared from the mite samples collected from Symplocos cochinchinensis philippinensis on Lanyu and Green Island were found to be the species in question. Eighty-five individuals allowing measurements of all morphometric variables, including 32 females from Lanyu (LF), 22 males and 31 females from Green Island (GM and GF, respectively), were chosen for morphometric measurement and analysis. We also prepared mite specimens collected from Symplocos c. cochinchinensis in Yangmingshan (north Taiwan). Out of 24 individuals, 16 females (YF) were chosen for measurements.
Variable Selection and MeasurementThirty-three variables for morphometric analyses were selected and measured (Table 1).
The variables includes ones based on the the homologous landmarks or
length of setae commonly used in taxonomic descriptions. The distance
between setal tubercles was measured by truss method (
33 morphometric characters and their abbreviation used in this study.
| Variables | Abbreviation | |
|---|---|---|
| 1 | body length | BL |
| 2 | shield length | SL |
| 3 | shield width | SW |
| 4 | distance between the dorsal tubercles | Dt-Dt |
| 5 | dorsal setae length | Ds.l |
| 6 | distance between the 1st coxal tubercles | Ct1-Ct1 |
| 7 | 1st coxal setae length | Ct1.l |
| 8 | distance between the 2nd coxal tubercles | Ct2-Ct2 |
| 9 | the 2nd coxal setae length | Ct2.l |
| 10 | distance between the 3rd coxal tubercles | Ct3-Ct3 |
| 11 | the 3rd coxal setae length | Ct3.l |
| 12 | cross distance from the 1st to the 2nd coxal tubercles | Ct1\Ct2 |
| 13 | distance from the 1st to the 2nd coxal tubercles | Ct1-Ct2 |
| 14 | cross distance from the 2nd to the 3rd coxal tubercles | Ct2\Ct3 |
| 15 | distance from the 2nd to the 3rd coxal tubercles | Ct2-Ct3 |
| 16 | genital width | Gs.W |
| 17 | genital length | Gs.L |
| 18 | distance between the genital tubercles | Gt-Gt |
| 19 | genital setae length | Gs.l |
| 20 | distance between the lateral tubercles | Lt-Lt |
| 21 | lateral setae length | Lt.l |
| 22 | cross distance from the lateral tubercles to the 1st ventral tubercles | Lt\Vt1 |
| 23 | distance from the lateral tubercles to the 1st ventral tubercles | Lt-Vt1 |
| 24 | distance between the 1st ventral tubercles | Vt1-Vt1 |
| 25 | the 1st ventral setae length | Vt1.l |
| 26 | distance between the 3rd ventral tubercles | Vt3-Vt3 |
| 27 | the 3rd ventral setae length | Vt3.l |
| 28 | cross distance from the 3rd coxal tubercles to the genital tubercles | Ct3\Gt |
| 29 | distance from the 3rd coxal tubercles to the genital tubercles | Ct3-Gt |
| 30 | cross distance from the genital tubercles to the lateral tubercles | Gt\Lt |
| 31 | distance from the genital tubercles to the lateral tubercles | Gt-Lt |
| 32 | cross distance from the genital tubercles to the 1st ventral tubercles | Gt\Vt1 |
| 33 | distance from the genital tubercles to the 1st ventral tubercles | Gt-Vt1 |
We evaluated geographic and sexual variations in morphology with multivariate analysis of variance (MANOVA). Morphometric data obtained from 101 mites from three localities was analyzed. Females of Yangmingshan, females of Lanyu, and females of Green Island (YF+LF+GF) were used to test if they are the same species, whereas the individuals from Green Island (GM and GF) were used to detect the sexual variation. Morphometric measurements (including distance between setal bases and the lengths of setae) were standardized by subtracted the mean. Principal components analysis (PCA) was then applied to reduce multicollinearity. Variation among populations in derived orthogonal principal components was firstly identified with MANOVA. Once a significant result was detected, pair-wise MANOVA tests after Bonferroni adjustment (α-level: 0.05 divided by n comparisons) were followed to identify the pair(s) leading to the difference. We also created a canonical centroid plot, which provides a convenient way for simultaneously inspect differences among populations (the canonical centroid plot depicted the 95% confidence interval for centroid of each population and an overlap of boundary represents no difference in response variables).
We then applied analysis of variance (ANOVA) to determine which response variable (i.e. PC1, PC2, etc.) accounted for the variation. Lastly, differences in those morphometric measurements with high absolute loadings in selected principal components (those that significantly differed among populations) were tested with ANOVA or t-test. For the MANOVA test, normality of response variables (PC values for morphometric measurements) was confirmed with Shapiro–Wilk test, and multivariate outliers were identified with jackknifed Mahalanobis distance. All the procedures were implemented in JMP 8.0 (SAS Institute Inc., Cary, N.C.).
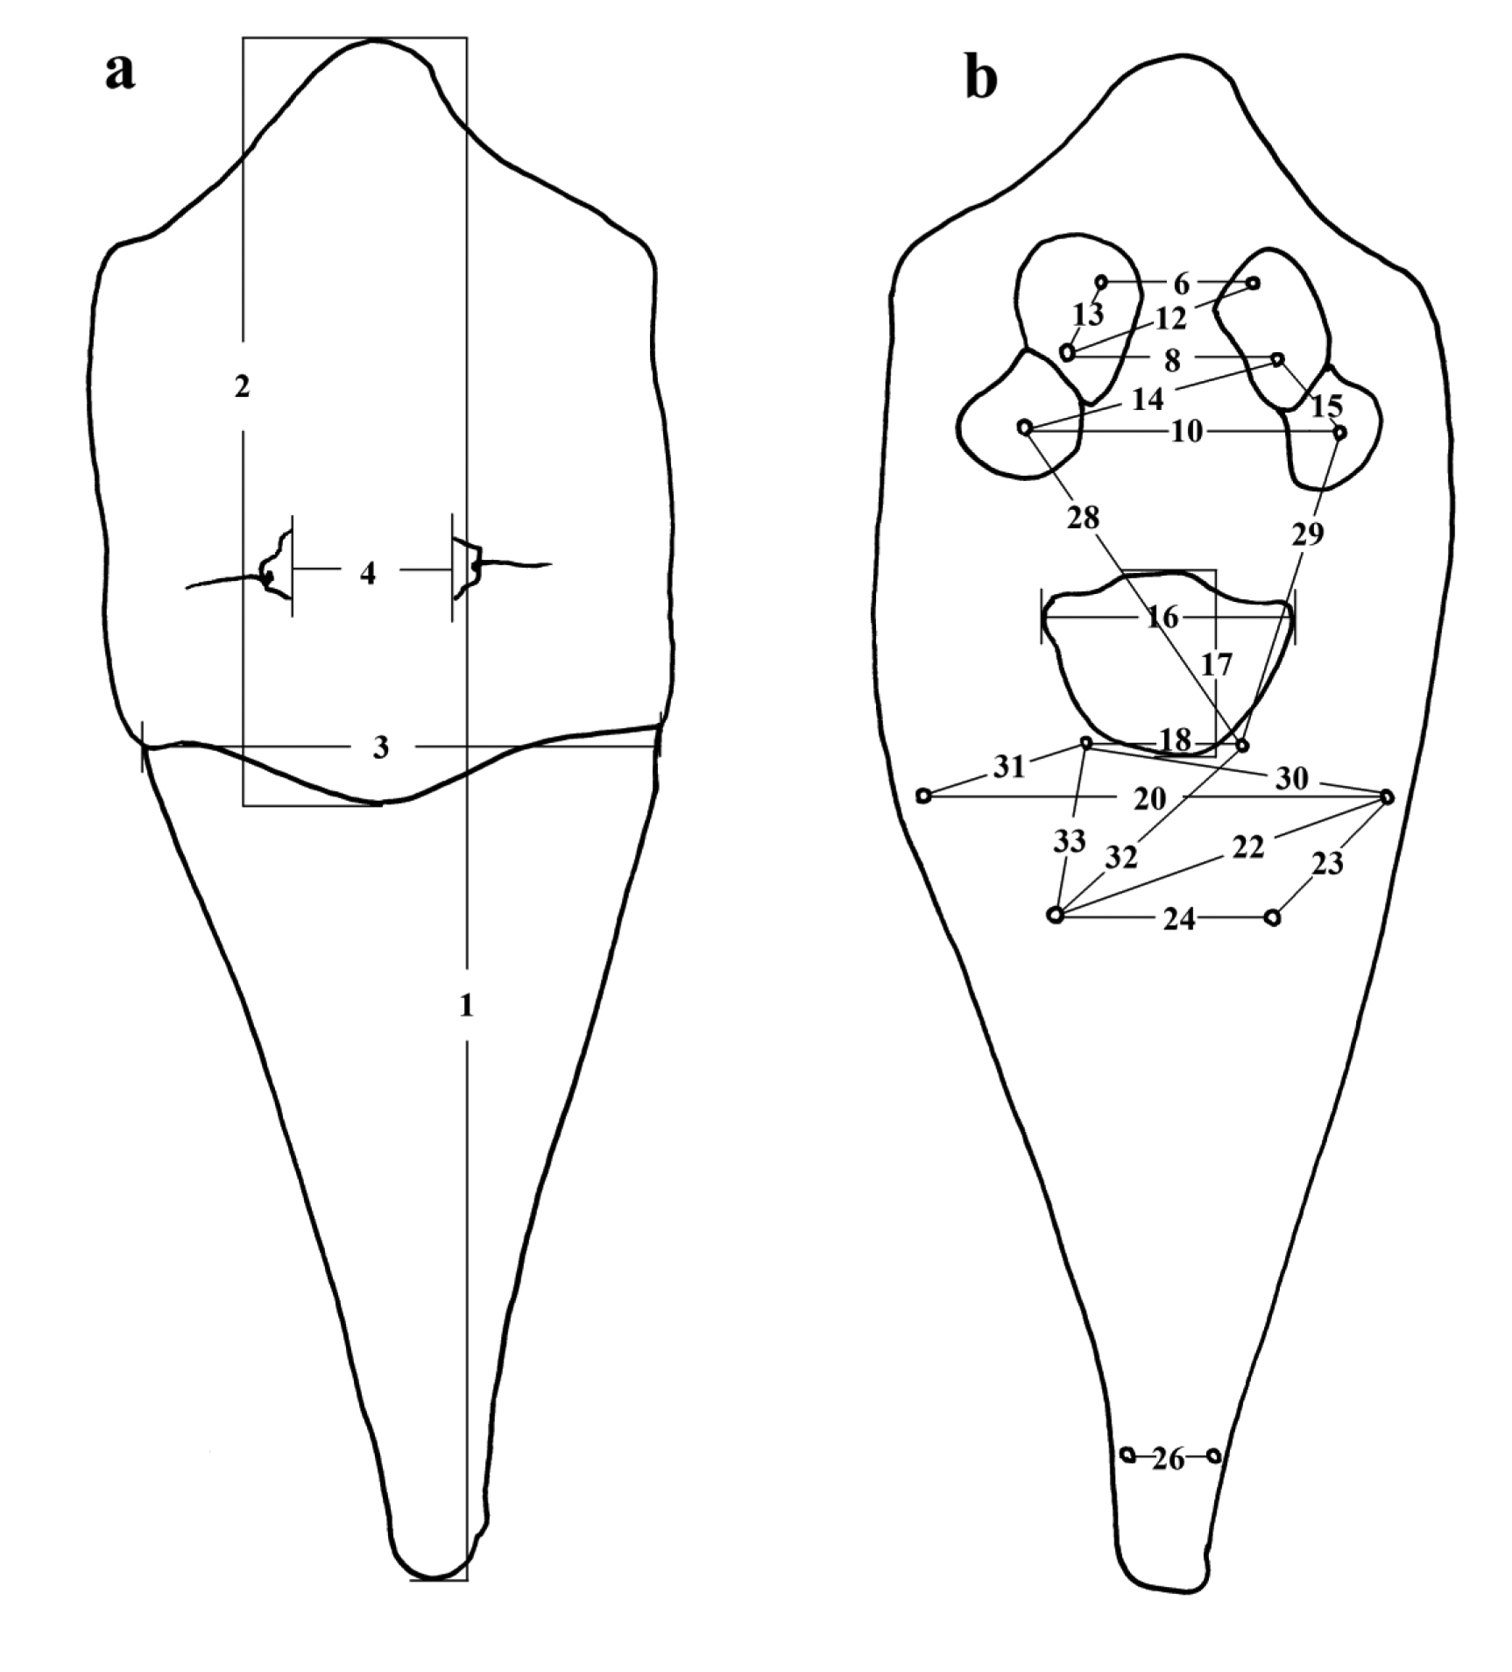
Contour drawing of Tumoris sanasaii Huang, 2001 and the measurement of the 33 variables used in this study. The number corresponds to the number of the variable listed in Table 1. a dorsal view b ventral view.
We applied PCA to reduce the dimensionality in 33 standardize morphometric variables. The three principal axes (PC1–3) were normally distributed within the three locations (Shapiro–Wilk test, W ranged from 0.92 to 0.97, all P> 0.05), and there were no outliers in PC values. PC1, PC2, and PC3 varied significantly among the three locations (MANOVA Wilks’ λ test: F6, 60= 6.04, P<0.0001). Canonical centroid plot revealed that morphological characteristics in Yangmingshan (YF) statistically differed from those in Lanyu (LF) and Green Island (GF) (pair-wise MANOVA: F3, 11= 13.54 and F3, 20= 14.56, respectively; both P< 0.001), whereas the latter two cannot be distinguished from each other (F3, 27= 2.59, P> 0.05) (Fig. 2). Further ANOVA showed that these variations were due to the differences in PC1 (F2, 32= 8.83, P< 0.001) and PC3 (F2, 32= 8.13, P< 0.005), but cannot be explained by PC2 (F2, 32= 0.43, P= 0.65). Absolute values of loadings were higher in Bl, Lt-Lt, Lt\Vt1, Vt1-Vt1, Gt\Lt, and Gt-Lt for PC1, and higher in Sw and Ct1-Ct2 for PC3 (Table 2). Among these variables (using original measurements), Bl (YF: 151.7±3.1 (mean±1SD), 147.9–155.2 (range); LF+GF: 135.3±13.2, 114.3–178.1; t-test, t= 2.44, P< 0.05) and Sw (YF: 61.5±2.0, 58.7–63.3; LF+GF: 51.7±5.6, 39.5–66.8; t= 3.45, P< 0.005) in YF were significantly different (all were larger) from those in LF and GF (combined due to similarity in morphology).
Sexual variationThe three principal axes derived from 33 standardized morphometric variables were normally distributed (W ranged from 0.93 to 0.98, all P> 0.05), and varied significantly between the males (GM) and the females (GF) in Green Island (MANOVA F3, 34= 46.51, P<0.0001) (Fig. 3). Sexual differences were observed in PC1 (t-test, t= 11.87, P< 0.001), but not in PC2 (t= -0.51, P= 0.62) and PC3 (t= 0.14, P= 0.89). Absolute loadings were higher in Bl, Sl, Ds.l, Ct3-Ct3, Ct1\Ct2, Gs.w, Gs.l, Gt-Gt, Lt-Lt, Lt\Vt1, Lt-Vt1, Vt1-Vt1, Ct3\Gt, Ct3-Gt, Gt\Lt, Gt-Lt, and Gt\Vt1 for PC1 (Table 2). Sexual variation was observed in all these 17 variables (t-test), with the females significantly larger than the males (Table 3).
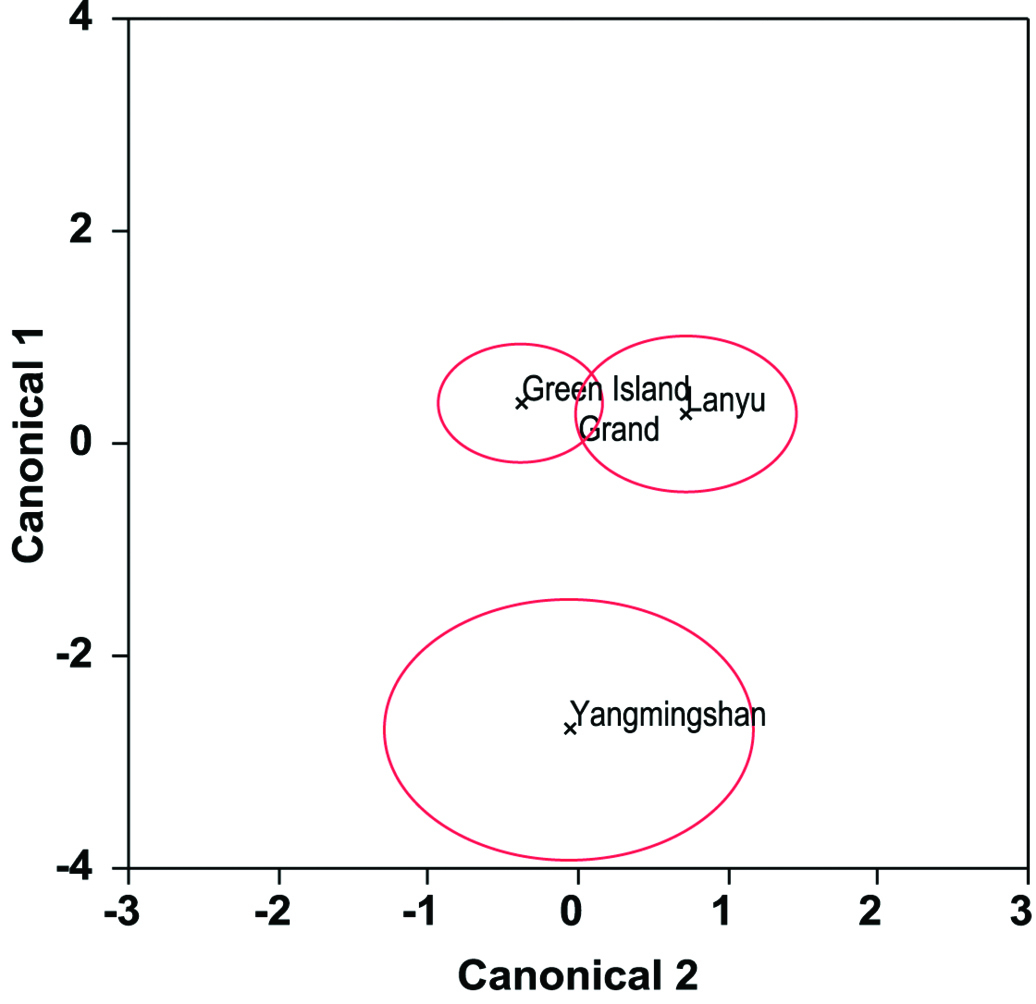
Canonical centroid plot for geographical variation in morphometric characteristics for Yangmingshan (YF), Lanyu (LF) and Green Island (GF).
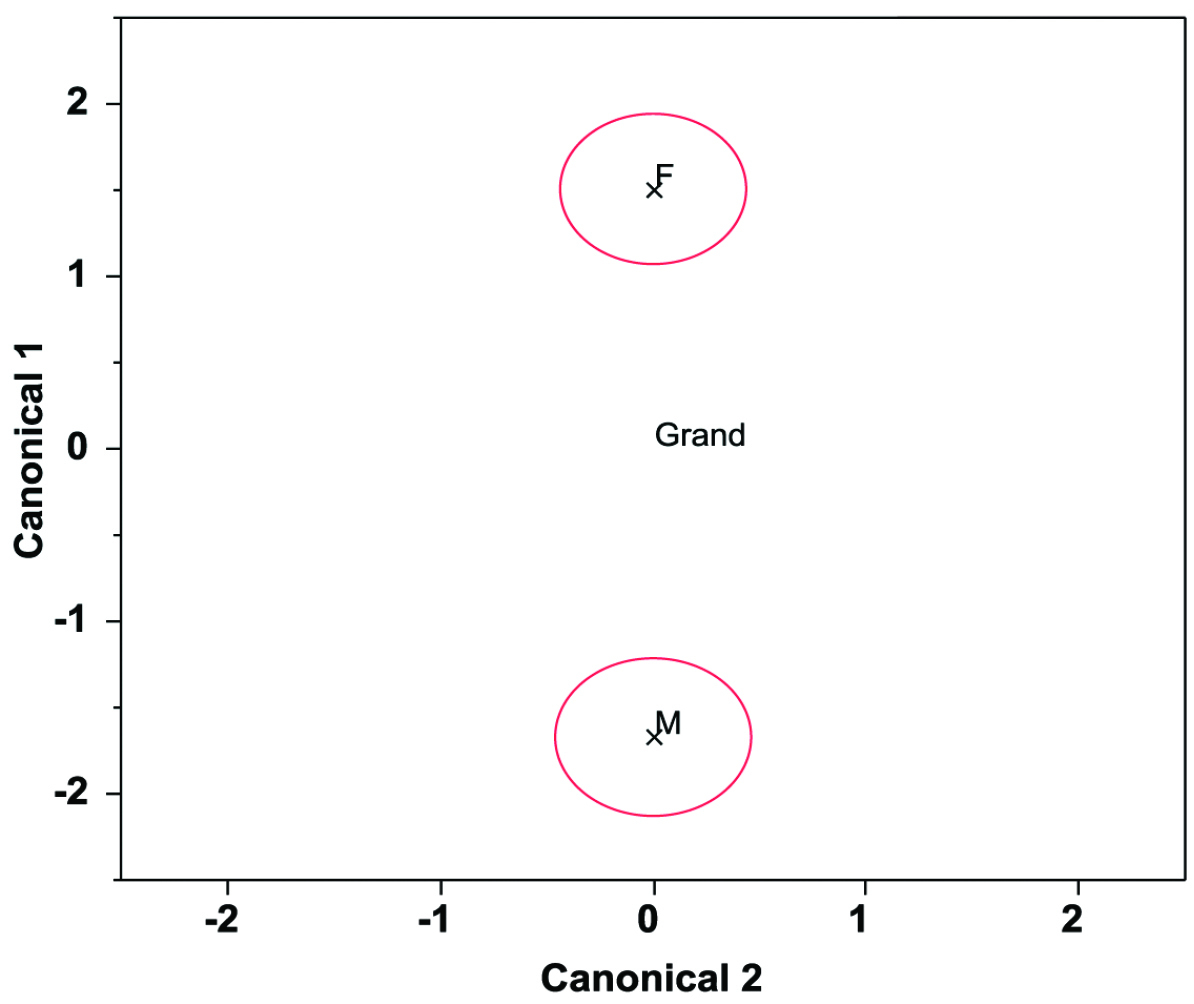
Canonical centroid plot for sexual variation in morphometric characteristics for male (M) and female (F) of Green Island.
The analyses on geographical groups revealed no significant differences between the Lanyu and Green Island populations, indicating that Huangiella lanyuensis and Tumoris sanasaii are actually the same. On the other hand, the group from Yangmingshan, previously identified by KWH as Tumoris sanasaii, is distinct. Though sharing similar diagnostic characters with Tumoris sanasaii, the Yangmingshan group differs significantly from the true Tumoris sanasaii by morphometry. The former group feeds on a different subspecies of host plant in the temperate northern Taiwan, in contrast to true Tumoris sanasaii living on subtropical or tropical Green Island and Lanyu. At present it is difficult to determine whether it is intra- or inter-specific difference. We would suggest their differentiation being above subspecies level because eriophyid mites have more rapid evolution rate than their host plants. A further study using multidisciplinary approaches would be required to solve the problem.
Owing to the reduced morphological structures and
minute size of eriophyids, descriptive diagnosis is usually
unsatisfactory in differentiating closely related species. Molecular
identification is also difficult owing to the hardness to isolate a
single individual of an identified species from a mite community without
making a slide. Morphometric analyses thus provide a reasonable option
with balance in effectiveness and efficiency. The present and many
previous studies have proved morphometrics a useful tool in eriophyoid
classification (
Loadings in principal components of geographical and sexual variations in morphometric variables of Eriophyoid mites in Taiwan (only PCs that significantly differ among populations were shown).
| Morphometric variables | Geographical variation | Sexual variation | |
|---|---|---|---|
| PC1 | PC3 | PC1 | |
| Bl | -0.85 | 0.27 | 0.60 |
| Sl | 0.30 | 0.51 | 0.80 |
| Sw | -0.02 | -0.64 | 0.59 |
| Dt-Dt | -0.33 | 0.47 | 0.23 |
| Ds.l | -0.26 | 0.55 | 0.61 |
| Ct1-Ct1 | 0.35 | 0.18 | 0.49 |
| Ct1.l | -0.01 | 0.19 | 0.27 |
| Ct2-Ct2 | 0.37 | -0.12 | 0.55 |
| Ct2.l | 0.49 | -0.21 | 0.41 |
| Ct3-Ct3 | 0.23 | -0.19 | 0.66 |
| Ct3.l | 0.32 | -0.35 | 0.20 |
| Ct1\Ct2 | 0.54 | 0.27 | 0.60 |
| Ct1-Ct2 | -0.15 | 0.61 | 0.41 |
| Ct2\Ct3 | 0.40 | -0.12 | 0.58 |
| Ct2-Ct3 | -0.07 | -0.05 | 0.40 |
| Gs.w | 0.57 | 0.03 | 0.90 |
| Gs.l | 0.36 | 0.02 | 0.90 |
| Gt-Gt | -0.05 | -0.10 | 0.74 |
| Gs.l 2 | -0.47 | -0.21 | 0.36 |
| Lt-Lt | 0.66 | 0.48 | 0.83 |
| Lt.l | 0.02 | -0.49 | 0.20 |
| Lt\Vt1 | 0.71 | 0.18 | 0.85 |
| Lt-Vt1 | 0.33 | -0.19 | 0.65 |
| Vt1-Vt1 | 0.60 | 0.27 | 0.67 |
| Vt1.l | -0.53 | -0.11 | 0.26 |
| Vt3-Vt3 | 0.04 | 0.15 | 0.14 |
| Vt3.l | 0.37 | -0.31 | -0.05 |
| Ct3\Gt | 0.51 | -0.49 | 0.88 |
| Ct3-Gt | 0.39 | -0.40 | 0.72 |
| Gt\Lt | 0.69 | 0.34 | 0.89 |
| Gt-Lt | 0.70 | 0.50 | 0.69 |
| Gt\Vt1 | 0.60 | -0.17 | 0.85 |
| Gt-Vt1 | 0.40 | -0.24 | 0.37 |
The 17 characters with significant difference between male and female of Tumoris sanasaii in Green Island.
| Morphometricvariables | Male | Female | t-value | ||
|---|---|---|---|---|---|
| mean±1SD | range | mean±1SD | range | ||
| Bl | 126.6±6.2 | 114–137 | 132.7±9.4 | 114–159 | 2.32* |
| Sl | 50.0±2.7 | 45–54 | 54.7±3.1 | 50–60 | 5.05*** |
| Ds.l | 6.6±1.1 | 4.9–8.7 | 8.2±1.8 | 4.9–12 | 3.36** |
| Ct3-Ct3 | 16.8±0.8 | 14–18 | 18.5±1.2 | 16–20 | 4.96*** |
| Ct1\Ct2 | 9.4±0.6 | 8.3–11 | 10.2±1.0 | 8.7–13 | 2.82* |
| Gs.w | 14.0±1.6 | 11–18 | 19.0±1.3 | 16–21 | 10.78*** |
| Gs.l | 4.7±1.5 | 2.6–7.9 | 12.3±1.0 | 8.9–16 | 13.36*** |
| Gt-Gt | 11.1±1.4 | 9–15 | 14.0±1.1 | 12–16 | 6.95*** |
| Lt-Lt | 34.0±1.4 | 31–37 | 37.8±2.2 | 33–41 | 6.39*** |
| Lt\Vt1 | 29.4±1.1 | 26–31 | 33.7±2.3 | 27–38 | 7.26*** |
| Lt-Vt1 | 18.6±1.5 | 16–21 | 20.8±2.2 | 14–23 | 3.48** |
| Vt1-Vt1 | 15.4±1.2 | 12–17 | 18.7±2.1 | 16–24 | 5.92*** |
| Ct3\Gt | 21.0±1.0 | 19–23 | 24.8±1.2 | 23–28 | 10.91*** |
| Ct3-Gt | 15.8±1.3 | 13–18 | 18.7±1.8 | 17–25 | 5.68*** |
| Gt\Lt | 22.3±1.1 | 19–24 | 25.9±1.2 | 24–29 | 9.31*** |
| Gt-Lt | 10.7±1.0 | 9–12 | 12.3±1.2 | 10–14 | 4.49*** |
| Gt\Vt1 | 19.5±1.1 | 18–21 | 22.1±1.3 | 20–25 | 6.80*** |
*P<0.05; **P<0.005; ***P<0.001
http://species-id.net/wiki/Tumoris
Plate 1a, b, c, dTumoris sanasaii Huang, by original designation.
Body spindle-shape, narrowing abruptly posteriorly; shield pentagonal, lobe present, with bulge between scapular tubercles, scapular tubercles set ahead of rear shield margin, seta directed upward; leg segments normal, coxae with 3 pairs of tubercles and seta, hind genual seta absent; empodium simple; opisthosoma differentiated into broader dorsal annuli and narrower ventral annuli, first dorsal annulus broad, fused forming a broad plate joined to prodorsal shield, dorsum with 3 ridges, median ridge ending before submedian ridges, the second ventral tubercle and setae (e) absent; coverflap with short ridges at base.
This genus is close to Proneotegonotus Mohanasundaram 1983, but differs from the latter by the absence of the second ventral tubercle and setae (e), presence of the first ventral tubercles and setae (d), and a bulge between the dorsal tubercles in prodorsal shield.
In
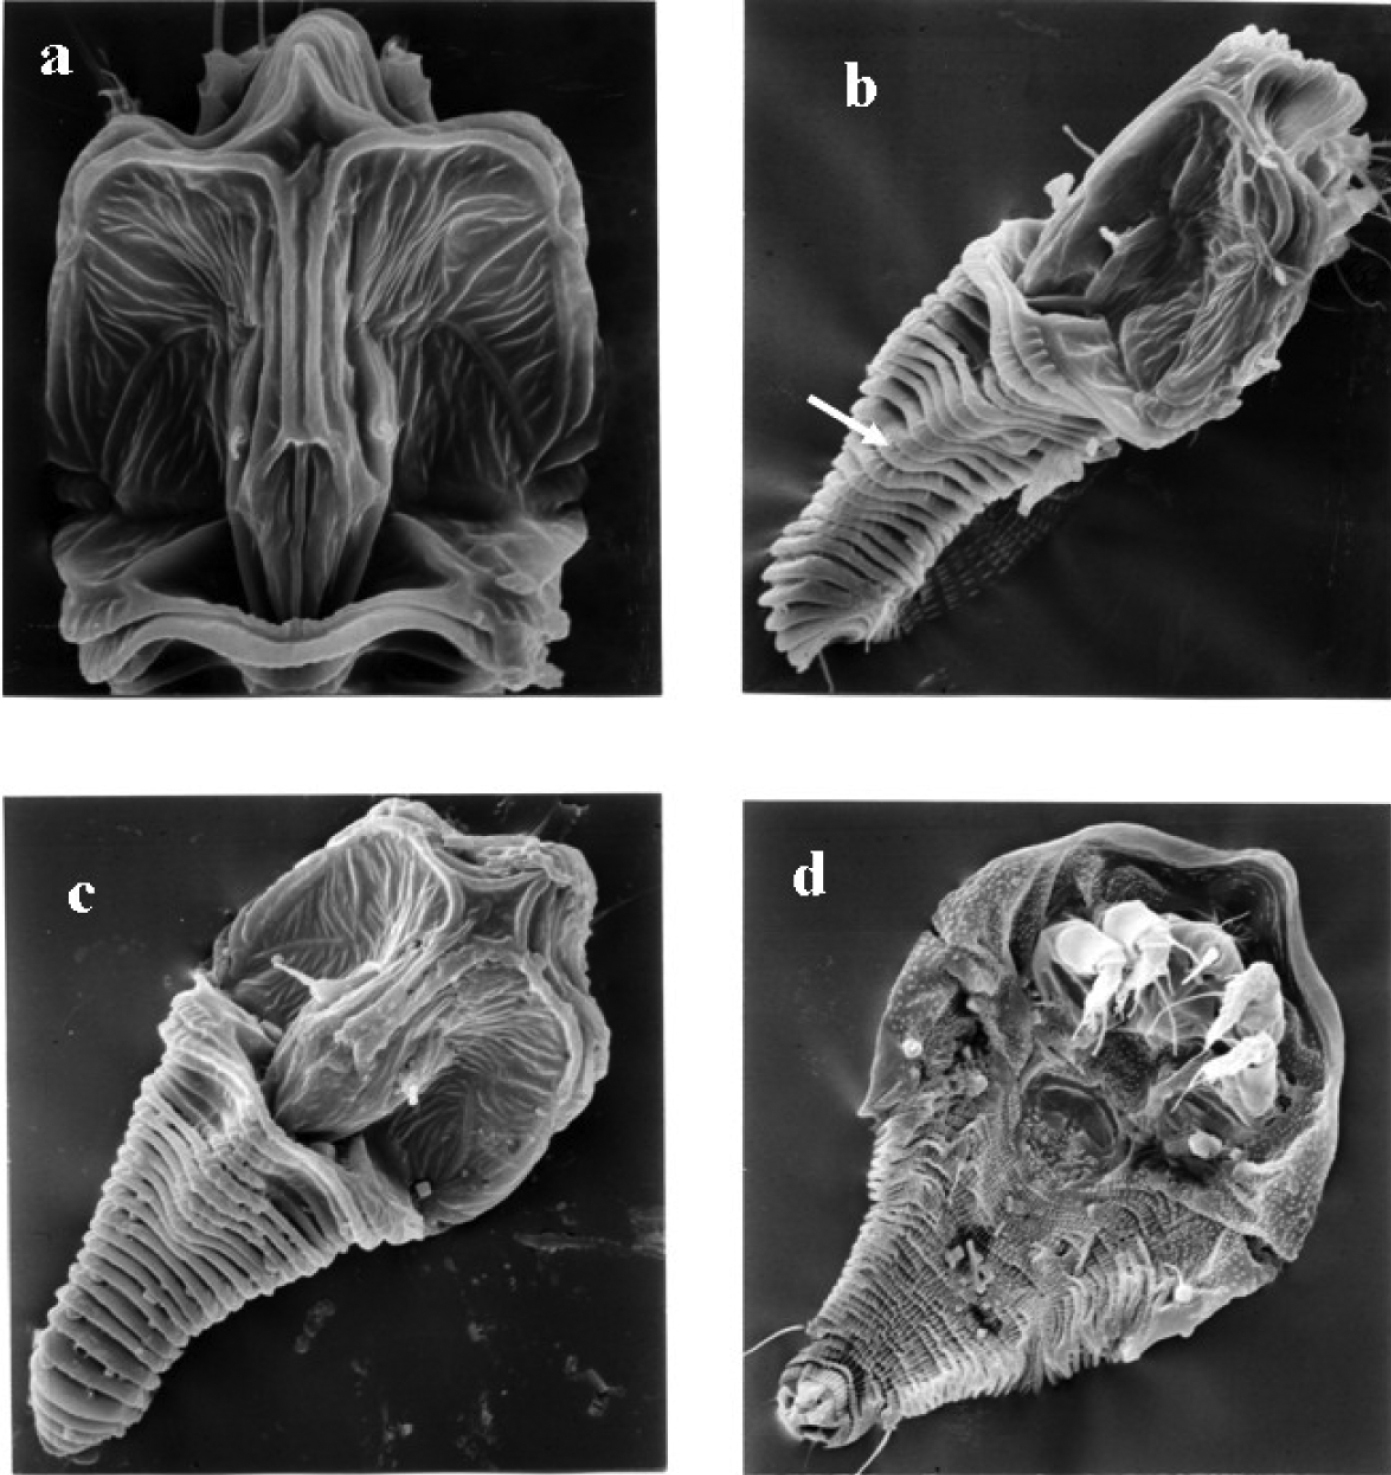
SEM micrographs of Tumoris sanasaii Huang, 2001. a prodorsal shield b lateral view, white arrow means submedian ridge c dorsal view d ventral view.
We wish to thank Mr. C.K. Lin, Drs. C, M. Wang, C.H. Chen, and H.F. Yen (NMNS) for helping us to identify the host plants. Thanks are also due to Miss S.K. Hu for her assistance with the SEM, and to Miss R. Wang and J. Jeng for organizing the data for morphometric analyses. We are grateful to Dr. H.D. Huang (NMNS) for his comment and editorial improvement on this article.