


(C) 2011 Ingmar Harry. This is an open access article distributed under the terms of the Creative Commons Attribution License, which permits unrestricted use, distribution, and reproduction in any medium, provided the original author and source are credited.
For reference, use of the paginated PDF or printed version of this article is recommended.
While pitfall trapping is generally accepted as the standard method for sampling carabid beetles, this method has rarely been used in mountain ecosystems, mainly due to the high labour intensity it involves. As part of a research project in the German Alps, we investigated the phenologic appearance of adult carabid beetles in mountain ecosystems along with the consequences of possible reductions in sampling periods. Our results show that an early activity peak among carabids is predominant in mountain ecosystems. However, there are differences among species: the main group of species showed the highest activity directly after snow melt, a second group showed a delayed activity peak and a small third group had no clear peak at all. Based on this study, we recommend two fortnightly sampling periods as a minimum for a sampling programme: one immediately after snow melt, and a second sampling period after a pause of two weeks.
Carabidae, mountain ecosystems, phenology, sampling effort, pitfall traps
Since harsh abiotic conditions along with high spatial
heterogeneity dominate mountain ecosystems, in stark contrast to the
surrounding landscapes, alpine sites are interesting for ecological and
biogeographical research (
Carabidae is a group often used as indicator and/or model taxon (
Nevertheless, very few investigations have been carried out using pitfall traps in high elevation mountain areas (cf.
Annual rhythms of activity and reproduction have been a
major issue in carabidology, dating back to Larsson’s pioneering work
in this field (
For mountain ecosystems, literature covering the
reproductive seasonality of ground beetles is sparse. There are some
works dealing with the phenology of carabids at high altitudes (
A long-term research project in the “Allgäuer Hochalpen” in the German Alps was conducted in an area protected under the European Union ”Habitats Directive”. The project aimed at assessing effects of intensive long-term grazing of sheep and associated grazing regime changes after extensive cattle pasturing in 2000. In this project, intensive sampling of epigeic arthropods was performed over 6 years using pitfall traps. In this paper we focus on the seasonal activity of carabid beetles, primarily in the subalpine, but also in the alpine research area. We (1) describe the phenology of carabid beetles in the mountain ecosystems; and (2) investigate the consequences of reducing the number of sampling periods in order to present an optimized sampling scheme for recording the maximum number of species in subalpine and alpine altitudes of the northern Alps.
Methods Study areaThe mountain pasture “Alpe Einödsberg“ (10, 28°; 47,
32°) is located in the German Alps (south-western Bavaria) and is part
of the “Allgäuer Hochalpen”, an area protected under the European Union
”Habitats Directive”. The study area ranges in altitude from 1400 to
2000 meters above sea level (m a. s. l). and encompasses a total area of
about 2 km². Most of the predominantly west-facing slopes consist of
meadows dominated by Nardus stricta. Woodland belts dominated by Norway spruce (Picea abies) and krummholz made up of Alnus viridis, occur throughout the pasture zone (Fig. 1).
There is a 2 km ridge running north-south along the upper segment of
the pasture. Additional information about the vegetation and geology is
given in
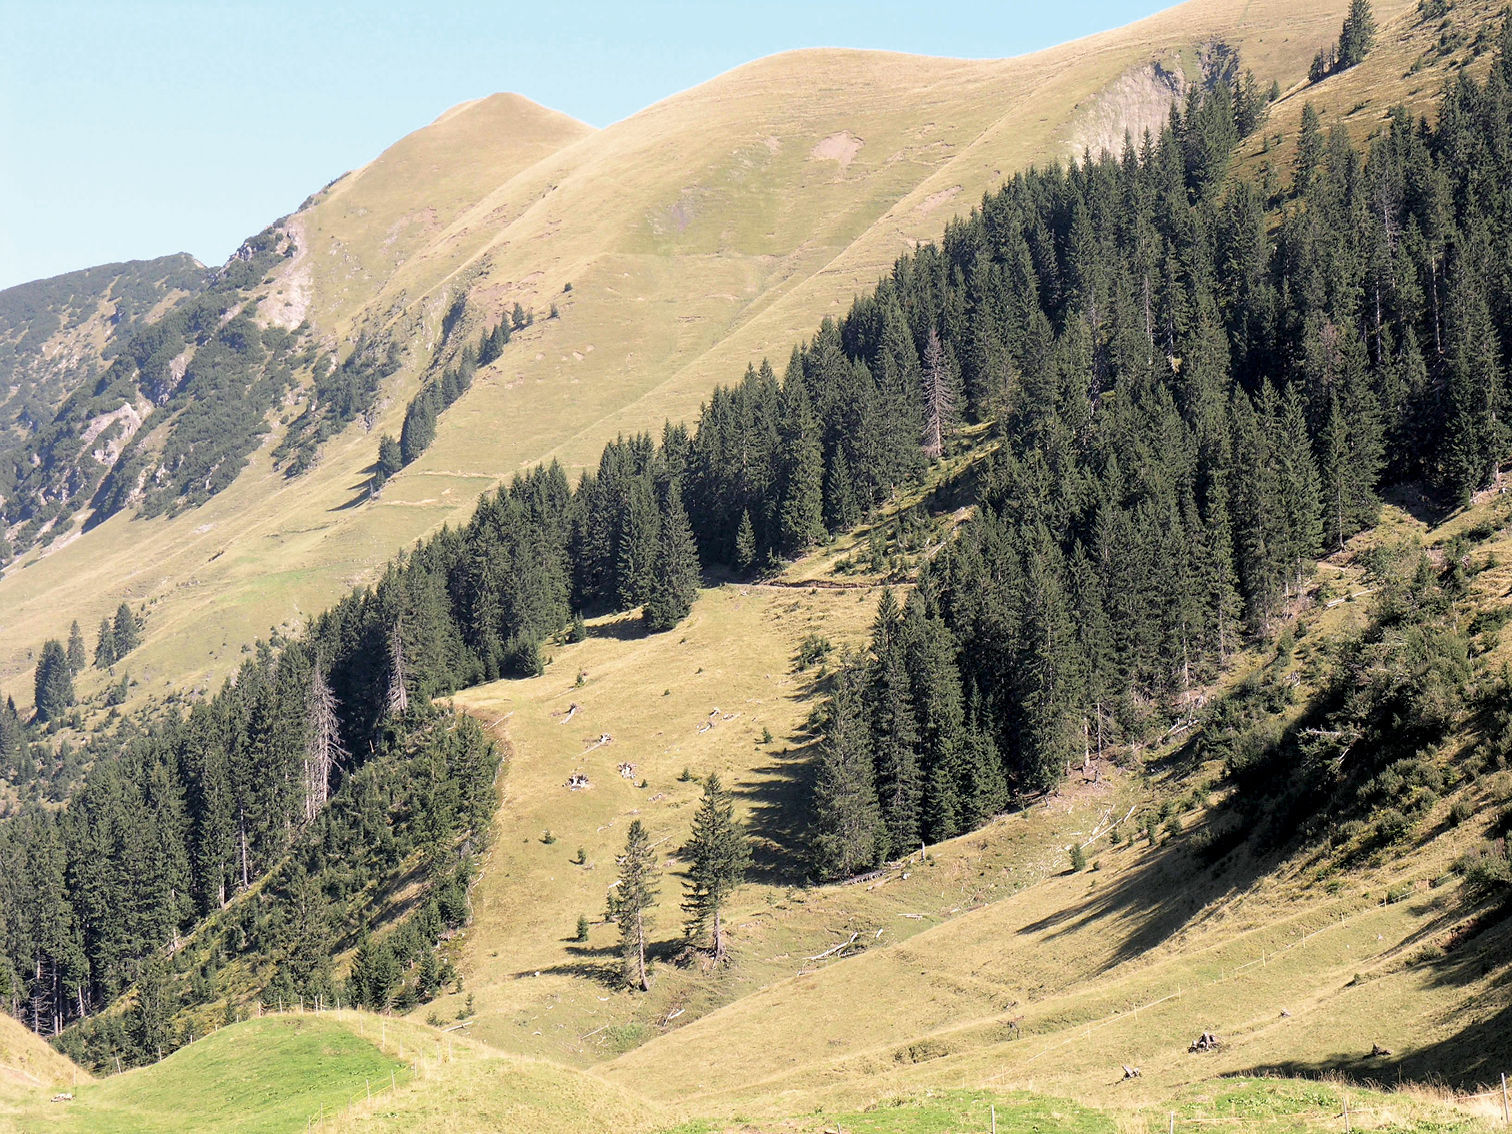
The study area “Alpe Einödsberg”. Position of some sampling sites is indicated.
In 2005, sampling was conducted at 25 sites. Sampling was focused on Nardus stricta-dominated meadows on slopes and on ridge sites dominated by Deschampsia cespitosa. In addition, several forest sites and open sites at lower altitudes were sampled (Table 1).
Sample sites. Altitude is given in m a. s. l., incline and exposition in °.
| site | type | altitude | inclination | exposition |
|---|---|---|---|---|
| V02 | ridge | 1875 | 12 | 180 |
| V03 | ridge | 1880 | 21 | 210 |
| V05 | ridge | 1885 | 29 | 275 |
| V06 | slope | 1751 | 34 | 255 |
| V08 | slope | 1776 | 35 | 260 |
| V10 | slope | 1809 | 38 | 235 |
| V11 | slope | 1703 | 27 | 250 |
| V16 | surface erosion | 1790 | 35 | 230 |
| V23 | sucession Alnus viridis | 1765 | 38 | 300 |
| X01 | ridge | 1884 | 25 | 250 |
| X03 | slope | 1896 | 33 | 270 |
| X04 | ridge | 1980 | 32 | 280 |
| X05 | ridge | 1993 | 9 | 250 |
| X07 | slope | 1781 | 39 | 265 |
| X08 | slope | 1786 | 35 | 260 |
| X09 | slope | 1798 | 37 | 255 |
| X10 | ridge | 1911 | 28 | 275 |
| X11 | slope | 1751 | 34 | 300 |
| X13 | krummholz | 1750 | 38 | 320 |
| X14 | forest | 1565 | 24 | 270 |
| X15 | forest | 1550 | 34 | 285 |
| X17 | open, low altitude | 1434 | 24 | 245 |
| X18 | open, low altitude | 1476 | 31 | 270 |
| X20 | slope | 1720 | 31 | 300 |
| X21 | ridge | 1990 | 5 | 280 |
At each sampling site, 6 pitfall traps (with a
diameter of 6 cm, filled with 10% acetic acid, 90% water) were
installed at a distance of 6 m from each other. In order to protect the
traps from heavy rain and from cattle-related damage, traps were placed
in a metal tube with a transparent plastic cover (
The pitfall traps were installed at the beginning of June, just after the first snowmelt at the ridge, and were removed at the end of September 2005 after a period of snow cover. Traps were emptied every fortnight. Altogether, there were 8 sampling periods, these were numbered chronologically (1: June 5th – 18th, 2: June 19th – July 2nd, 3: July 3rd – July 18th, 4: July 19th – August 1st, 5: August 2nd – August 15th, 6: August 16th – August 29th, 7: August 30th – September 12th, 8: September 13th – September 26th).
Carabids were identified to species level; the nomenclature of the species follows Müller-Motzfeld et al. (2004). Not all specimens of Bembidion incognitum and Bembidion deletum could be identified to species level and they were thus treated as ‘Bembidion incognitum/deletum’ in Table 2.
List of carabids trapped over the whole sampling period and their traits ‘hindwing development’ (b: brachypter, d: dimorphic, m: macropteric) and body size class. For each species the sum of individuals caught (sum) as well as the percentage of individuals per sampling period 1 to 8 are given.
| Species | wing type | body size | sum | 1 5.6.-18.6. | 2 19.6.-3.7. | 3 4.7.-18.7. | 4 19.7.-1.8. | 5 2.8.-15.8. | 6 16.8.-29.8. | 7 30.8.-12.9. | 8 13.9.-26.9. |
|---|---|---|---|---|---|---|---|---|---|---|---|
| Pterostichus jurinei (Panzer, 1803) | b | 4 | 4431 | 30.1 | 33.2 | 16.1 | 7.3 | 2.7 | 1.9 | 4.7 | 4.0 |
| Pterostichus burmeisteri Heer, 1838 | b | 5 | 2094 | 25.2 | 13.4 | 12.1 | 9.5 | 4.5 | 5.5 | 17.7 | 12.0 |
| Pterostichus unctulatus (Duftschmid, 1812) | b | 3 | 1386 | 24.4 | 21.2 | 17.0 | 11.8 | 5.3 | 8.0 | 9.2 | 3.2 |
| Pterostichus pumilio (Dejean, 1828) | b | 2 | 1044 | 20.3 | 15.8 | 23.7 | 23.6 | 8.7 | 2.6 | 2.7 | 2.7 |
| Pterostichus multipunctatus (Dejean, 1828) | b | 4 | 669 | 37.1 | 35.1 | 4.5 | 5.8 | 4.3 | 3.9 | 6.1 | 3.1 |
| Pterostichus melanarius (Illiger, 1798) | d | 5 | 578 | 13.5 | 31.1 | 30.3 | 11.8 | 5.4 | 3.1 | 4.0 | 0.9 |
| Abax parallelepipedus (Piller & Mitterpacher, 1783) | b | 5 | 577 | 9.5 | 25.1 | 16.8 | 19.6 | 7.3 | 10.1 | 10.6 | 1.0 |
| Trechus obtusus Erichson, 1837 | d | 2 | 509 | 14.3 | 14.5 | 20.8 | 27.3 | 9.4 | 5.7 | 3.9 | 3.9 |
| Carabus auronitens Fabricius, 1792 | b | 6 | 432 | 19.9 | 29.9 | 24.5 | 16.4 | 4.4 | 3.7 | 1.2 | |
| Carabus violaceus Linné, 1758 | b | 7 | 365 | 5.5 | 21.9 | 27.4 | 29.0 | 6.8 | 6.6 | 2.5 | 0.3 |
| Amara erratica (Duftschmid, 1812) | m | 3 | 282 | 31.6 | 52.8 | 13.5 | 1.4 | 0.7 | |||
| Leistus nitidus (Duftschmid, 1812) | d | 3 | 167 | 10.2 | 26.3 | 24.6 | 16.8 | 5.4 | 6.6 | 9.0 | 1.2 |
| Oreonebria picea (Dejean, 1826) | b | 4 | 159 | 32.7 | 30.8 | 16.4 | 15.1 | 2.5 | 1.9 | 0.6 | |
| Calathus melanocephalus (Linné, 1758) | d | 3 | 102 | 5.9 | 2.9 | 28.4 | 17.6 | 26.5 | 12.7 | 4.9 | 1.0 |
| Pterostichus strenuus (Panzer, 1796) | d | 3 | 97 | 52.6 | 23.7 | 11.3 | 6.2 | 2.1 | 1.0 | 3.1 | |
| Calathus micropterus (Duftschmid, 1812) | b | 3 | 76 | 14.5 | 23.7 | 28.9 | 14.5 | 3.9 | 11.8 | 2.6 | |
| Harpalus latus (Linné, 1758) | m | 4 | 74 | 10.8 | 20.3 | 12.2 | 21.6 | 16.2 | 12.2 | 6.8 | |
| Poecilus versicolor (Sturm, 1824) | m | 4 | 73 | 26.0 | 52.1 | 12.3 | 4.1 | 4.1 | 1.4 | ||
| Pterostichus diligens (Sturm, 1824) | d | 2 | 73 | 57.5 | 20.5 | 11.0 | 4.1 | 2.7 | 4.1 | ||
| Dyschirius globosus (Herbst, 1784) | d | 1 | 51 | 54.9 | 7.8 | 15.7 | 13.7 | 3.9 | 2.0 | 2.0 | |
| Cicindela campestris Linné, 1758 | m | 4 | 44 | 15.9 | 22.7 | 27.3 | 13.6 | 11.4 | 2.3 | 4.5 | 2.3 |
| Carabus sylvestris Panzer, 1796 | b | 6 | 36 | 58.3 | 16.7 | 2.8 | 8.3 | 2.8 | 8.3 | 2.8 | |
| Amara aulica (Panzer, 1797) | m | 5 | 32 | 6.3 | 50.0 | 43.8 | |||||
| Bembidion bipunctatum nivale Heer, 1837 | m | 2 | 32 | 84.4 | 3.1 | 9.4 | 3.1 | ||||
| Trichotichnus laevicollis (Duftschmid, 1812) | d | 3 | 30 | 26.7 | 23.3 | 13.3 | 23.3 | 3.3 | 6.7 | 3.3 | |
| Amara lunicollis Schiödte, 1837 | m | 3 | 24 | 29.2 | 62.5 | 4.2 | 4.2 | ||||
| Notiophilus biguttatus (Fabricius, 1779) | d | 2 | 23 | 8.7 | 17.4 | 17.4 | 30.4 | 4.3 | 4.3 | 13.0 | 4.3 |
| Bembidion incognitum/deletum | m | 2 | 19 | 52.6 | 21.1 | 15.8 | 10.5 | ||||
| Cychrus attenuatus (Fabricius, 1792) | b | 5 | 19 | 5.3 | 5.3 | 15.8 | 36.8 | 5.3 | 21.1 | 10.5 | |
| Amara nigricornis C.G. Thomson, 1857 | m | 3 | 17 | 17.6 | 41.2 | 17.6 | 17.6 | 5.9 | |||
| Nebria rufescens (Stroem, 1768) | m | 4 | 17 | 23.5 | 23.5 | 23.5 | 11.8 | 11.8 | 5.9 | ||
| Bembidion lampros (Herbst, 1784) | d | 2 | 15 | 73.3 | 6.7 | 13.3 | 6.7 | ||||
| Cychrus caraboides (Linné, 1758) | b | 5 | 11 | 27.3 | 45.5 | 9.1 | 9.1 | 9.1 | |||
| Bembidion properans (Stephens, 1828) | d | 2 | 7 | 14.3 | 57.1 | 28.6 | |||||
| Loricera pilicornis (Fabricius, 1775) | m | 3 | 6 | 16.7 | 66.7 | 16.7 | |||||
| Nebria brevicollis (Fabricius, 1792) | m | 4 | 3 | 33.3 | 33.3 | 33.3 | |||||
| Agonum sexpunctatum (Linné, 1758) | m | 3 | 2 | 100.0 | |||||||
| Acupalpus flavicollis (Sturm, 1825) | m | 2 | 1 | 100.0 | |||||||
| Amara familiaris (Duftschmid, 1812) | m | 3 | 1 | 100.0 | |||||||
| Amara praetermissa (C.R. Sahlberg, 1827) | m | 3 | 1 | 100.0 | |||||||
| Carabus glabratus Paykull, 1790 | b | 7 | 1 | 100.0 | |||||||
| Chlaenius nigricornis (Fabricius, 1787) | m | 4 | 1 | 100.0 | |||||||
| Cicindela sylvicola Dejean, 1822 | m | 5 | 1 | 100.0 | |||||||
| Harpalus affinis (Schrank, 1781) | m | 4 | 1 | 100.0 | |||||||
| Pterostichus vernalis (Panzer, 1796) | d | 3 | 1 | 100.0 | |||||||
| Synuchus vivalis (Illiger, 1798) | d | 3 | 1 | 100.0 | |||||||
| Total | 13585 | 24.9 | 25.8 | 17.2 | 12.1 | 4.8 | 4.1 | 7.0 | 4.2 |
In order to compare species and sites with different numbers of individuals, percentage of total catches per sampling period were used. Total number of species per sampling period and mean number of species per site and sampling period were compared.
For comparison of phenology at different altitudes, the sites were divided into three altitude classes (<1600, 1600–1850, >1850 m a. s. l.) which contained similar numbers of sites. The weighted mean phenological appearance was calculated for each species per altitude class. Differences among classes were tested with a t-test, whereby we only used data for species which occurred at each sampling site and for which at least 10 individuals per class were found. Differences in phenological appearance in the traits: ‘hindwing development’ and ‘body length’ were also tested. For ‘hindwing length’ the groups ‘brachypter’, ‘dimorphic’ and ‘macropterous’ were tested using a t-test; for body size, species were grouped into 7 classes (mean body length < 3 mm, 3–6 mm, 6–9 mm, 9–12.5 mm, 12.5–20 mm, 20–27 mm, >27 mm) and a Spearman rank correlation was performed. Bonferroni corrections were conducted for each test family. For t-tests, data were checked for normality with Shapiro-tests.
Species accumulation curves (also called sample-based
rarefaction curves) were used to compare sampling effort and species
richness measures (
Several reduced datasets with data from two sampling periods were produced. Rarefaction curves and species number per site were compared across the whole dataset, single sampling periods and different combinations of sampling periods.
To understand how the assemblage of carabid beetle species could be represented in the case of a reduced sampling effort we computed a dissimilarity matrix based on Bray-Curtis distances. For this analysis, species numbers were standardised to percentage-data of total species numbers per site and square-root-transformed. Based on this matrix a hierarchical cluster procedure was conducted using Ward´s minimum variance method.
ResultsIn total, 13, 585 specimens representing 47 species of carabid beetles were trapped over the sampling period (Table 2). The 10 most abundant species occurred throughout the whole altitudinal range of the study area.
General seasonal activity began with a maximum at the beginning of the study and showed a continuously decreasing tendency up until the end of September (Fig. 1). Focusing on individual numbers, the highest activity was in June, where >50% of individuals were caught. In July, activity declined slowly, and in the second half of the sampling timespan, August and September combined, only 20% of the total number of individuals were trapped.
The number of recorded species follows a similar trend: after a minute increase up to the first half of July, the number of species decreased. Mean species number per site was almost constant from June to the beginning of July, and then decreased up to the end of the study period (Fig. 2a).
The extremes in beetle activity were greatest at sites above 1850 m a.s.l. relative to the other two altitude classes: the maximum in June was higher and the low activity from the second half of July until September was even more pronounced (Fig. 2b). Differences between the activity phenology of low and mid-altitude classes were not significant (t=-0.322, p=0.753); however, mean activity of ground beetle species occurring at all elevations was earlier at higher altitudes than at the mid-altitude and lower sites (t=4.33, p=0.001).
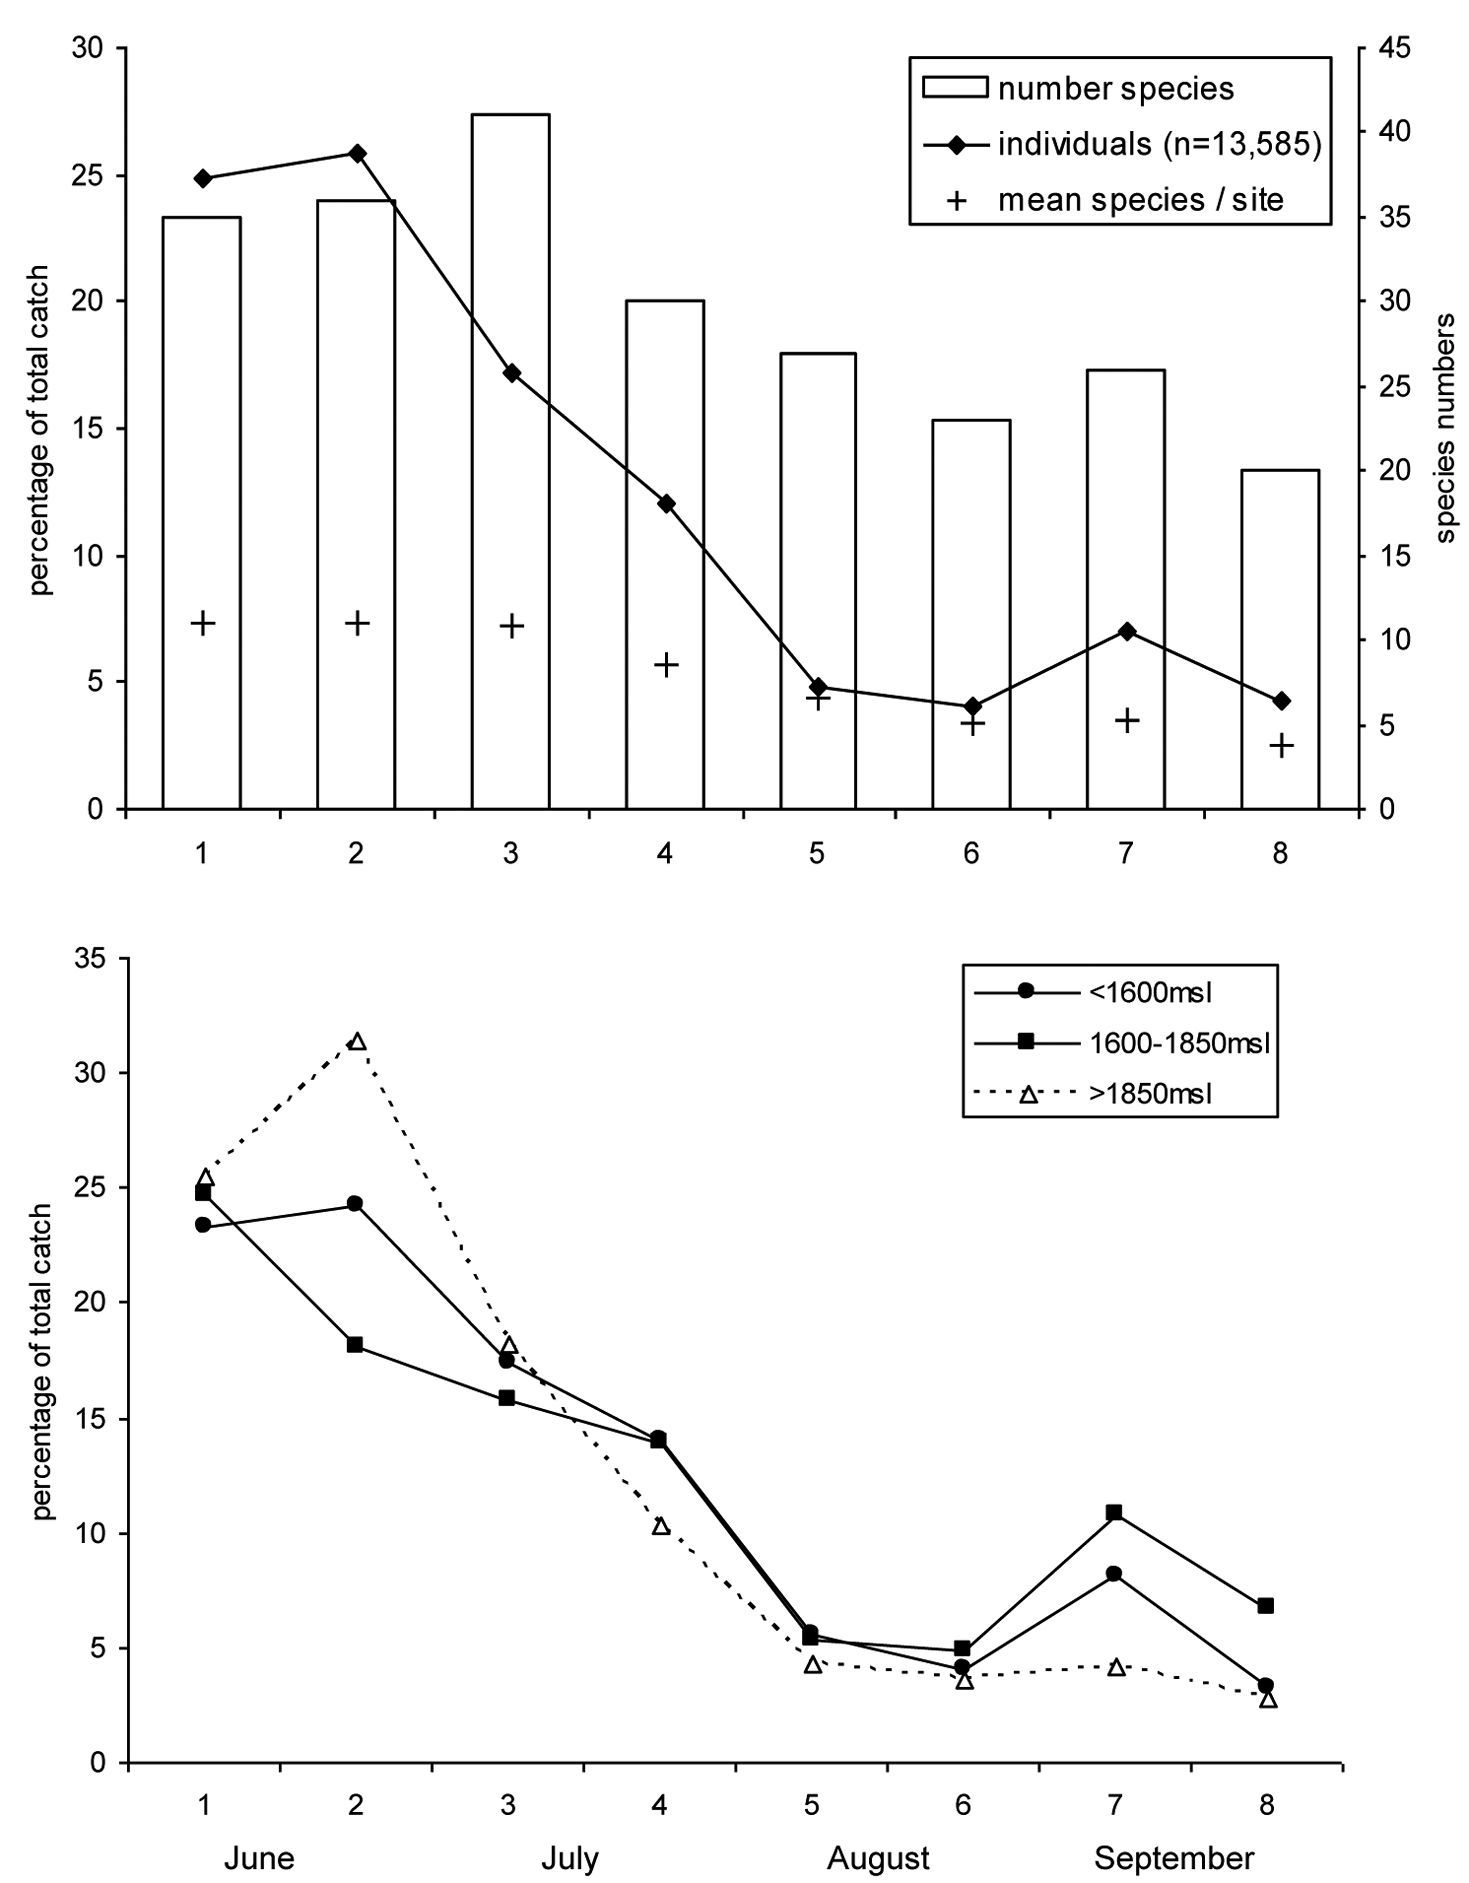
Phenology of ground beetles. a Overview over all sites. Number of individuals is converted to percentage of total catch. b Seperated for the three site classes of altitude. On the horizontal axis the sampling interval is given. For exact sampling periods, see Table 2.
All species of which at least 10 individuals were caught had their activity peak in June or July, approximately two thirds of the species in June, and one third in July (Table 2).
Species can be divided into three groups according to their phenology: (1) The first and largest group of species shows quite a distinct activity peak in June (Fig. 3a) and often a strong decline already occurring in July (e.g. Pterostichus multipunctatus, Bembidion bipunctatum). Some of these species are almost absent in the second half of the year (Amara erratica, Bembidion bipunctatum). The strength of the spring activity peak may also be less pronounced (e.g. Carabus auronitens). (2) A second group of species shows a delayed activity peak (Fig. 3b). In most cases, the magnitude of the peak was weaker than seen in the early species. In species with a delayed activity peak, there are also cases with absence in the second half of the year (Amara aulica). (3) The third group is comprised of species that show no clear activity peak (Fig. 3c), i.e. which are active over the entire sampling timespan. Only a few species fit into this latter scheme. Most of these are characterized by a weak peak in June, followed by a slow decline in activity. Some of the species exhibit a relatively high activity in the autumn (Pterostichus burmeisteri, Abax paralellepipedus).
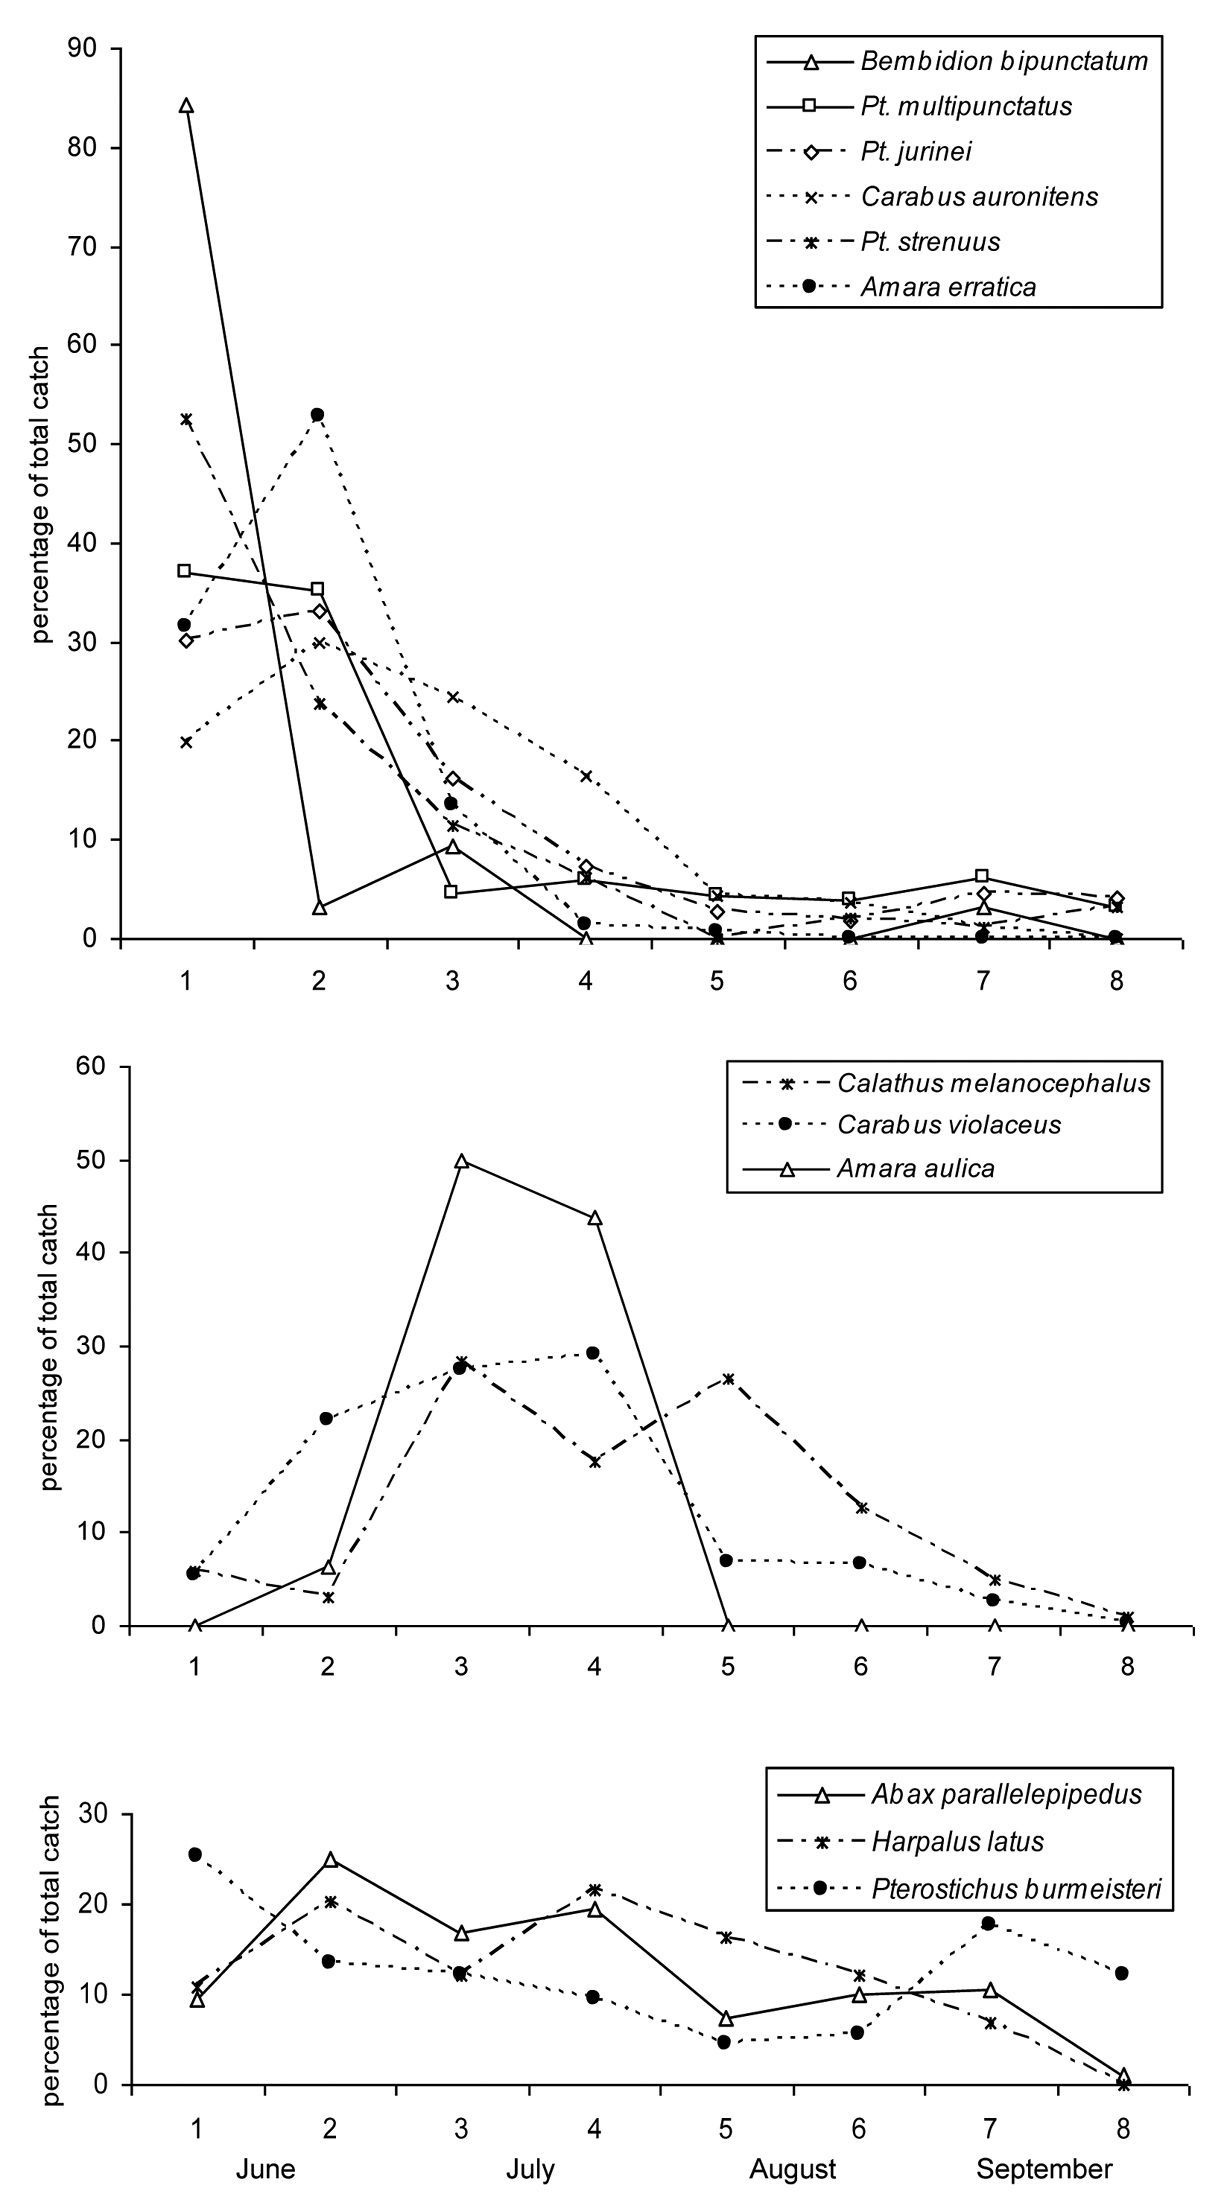
Phenology of single species. a Species with an early activity peak, b Species with a delayed activity peak and c Species without a clear activity peak. On the horizontal axis the sampling interval is given. For exact sampling periods, see Table 2.
We were unable to find any significant relationship between phenological appearance and hindwing development of the species. Similarly, for body size no significant difference was found, although there is a weak trend of larger species appearing later in the year (t=1.61, df=44, p=0.114).
The sample-based accumulation curves of the first three sampling periods are almost identical at the start, and considerably steeper than the curves of subsequent periods and the curve based on the entire dataset (Fig. 4). After 25 samples, the curves of the first three periods split: the third period curve attains higher values, and the first and second period curves follow a similar trend. Decreasing overall activity after the spring peak is also discernible in the rarefaction curves: the curves for sampling periods 4–8 are clearly below the curve for complete sampling (the curve for sampling period 4 is greater than the total sample curve at the start of the rarefaction process and then falls below it).
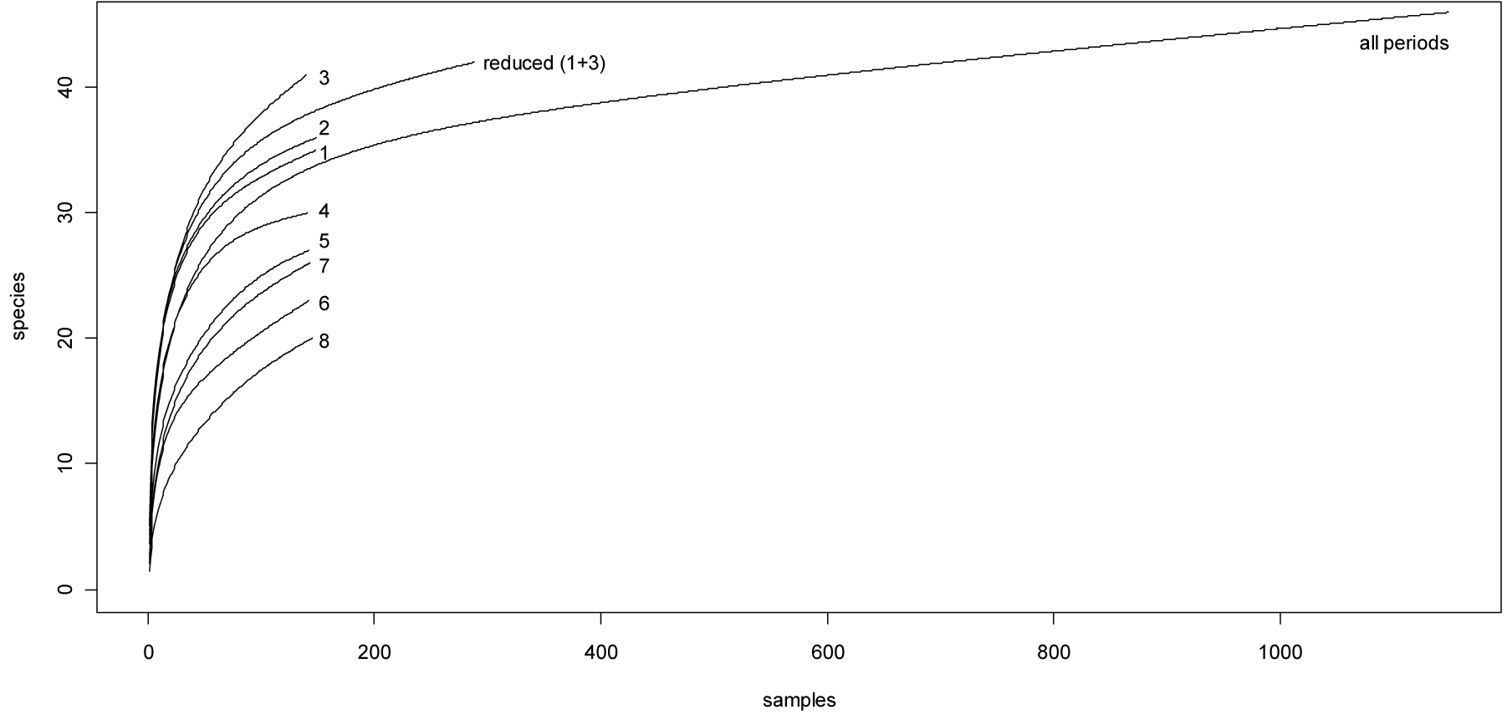
Sample-based rarefaction curves. Numbers refer to the different sampling periods.
Table 3 illustrates the effects of a reduced sampling effort on observed species richness. While single sampling periods achieve a maximum of 65% of the total number of species over the entire sampling timespan, a combination of two early sampling periods can exceed 80% of the total amount of species (sampling periods 1 and 2 or 1 and 3). Best results are obtained when sampling effort is reduced to sampling periods 1 and 3. With the reduced datasets for sampling periods 1 and 3, 91.3% of all species were detected. Per site, the mean quota was 83%, and varied between 68.8 and 100%. The quota of species detected was seen to be independent of altitude or number of specimens caught.
Comparison of species trapped per site for different sampling efforts. In the column Species the total number of species per site is given. Percentage of species caught is indicated for each single sampling period and a selection of two combined periods. The mean percentage of species caught per site (mean/site) for each effort is calculated.
| site | single periods | two periods | species | ||||||||||
|---|---|---|---|---|---|---|---|---|---|---|---|---|---|
|
1 5.6.-18.6. |
2 19.6.-3.7. |
3 4.7.-18.7. |
4 19.7.-1.8. |
5 2.8.-15.8. |
6 16.8.-29.8. |
7 30.8.-12.9. |
8 13.9.-26.9. |
1+2 | 1+3 | 2+3 | 1+4 | ||
| V02 | 64 | 59 | 73 | 41 | 23 | 23 | 32 | 14 | 86 | 86 | 82 | 73 | 22 |
| V03 | 68 | 64 | 73 | 32 | 36 | 32 | 32 | 27 | 86 | 86 | 82 | 73 | 22 |
| V05 | 76 | 76 | 57 | 57 | 19 | 14 | 19 | 10 | 90 | 86 | 90 | 81 | 21 |
| V06 | 56 | 75 | 50 | 38 | 56 | 44 | 38 | 6 | 81 | 69 | 75 | 63 | 16 |
| V08 | 77 | 54 | 69 | 62 | 62 | 62 | 31 | 15 | 77 | 92 | 77 | 77 | 13 |
| V10 | 45 | 65 | 80 | 60 | 45 | 40 | 25 | 20 | 65 | 85 | 95 | 65 | 20 |
| V11 | 63 | 69 | 69 | 50 | 44 | 13 | 31 | 25 | 81 | 88 | 81 | 75 | 16 |
| V16 | 71 | 53 | 47 | 29 | 41 | 29 | 18 | 12 | 71 | 88 | 71 | 76 | 17 |
| V23 | 53 | 100 | 60 | 67 | 47 | 27 | 33 | 7 | 100 | 73 | 100 | 80 | 15 |
| X01 | 82 | 88 | 71 | 47 | 24 | 12 | 18 | 24 | 94 | 88 | 94 | 82 | 17 |
| X03 | 64 | 57 | 71 | 43 | 50 | 36 | 36 | 29 | 86 | 86 | 86 | 64 | 14 |
| X04 | 61 | 56 | 50 | 44 | 44 | 44 | 33 | 28 | 72 | 72 | 67 | 72 | 18 |
| X05 | 73 | 68 | 77 | 64 | 45 | 36 | 36 | 32 | 95 | 100 | 82 | 91 | 22 |
| X07 | 53 | 53 | 60 | 73 | 60 | 40 | 20 | 27 | 67 | 73 | 67 | 80 | 15 |
| X08 | 73 | 60 | 60 | 60 | 47 | 47 | 47 | 27 | 87 | 87 | 73 | 80 | 15 |
| X09 | 83 | 67 | 67 | 67 | 50 | 33 | 33 | 25 | 92 | 83 | 83 | 100 | 12 |
| X10 | 46 | 92 | 77 | 38 | 46 | 38 | 23 | 15 | 92 | 85 | 100 | 54 | 13 |
| X11 | 63 | 53 | 63 | 42 | 37 | 37 | 32 | 32 | 68 | 79 | 68 | 68 | 19 |
| X13 | 65 | 59 | 65 | 47 | 18 | 18 | 53 | 35 | 71 | 88 | 82 | 76 | 17 |
| X14 | 53 | 73 | 67 | 53 | 33 | 47 | 47 | 33 | 87 | 80 | 80 | 60 | 15 |
| X15 | 71 | 57 | 71 | 93 | 50 | 43 | 57 | 29 | 79 | 86 | 71 | 93 | 14 |
| X17 | 79 | 43 | 50 | 43 | 36 | 14 | 21 | 21 | 79 | 79 | 50 | 86 | 14 |
| X18 | 53 | 37 | 58 | 32 | 21 | 11 | 26 | 11 | 63 | 79 | 63 | 63 | 19 |
| X20 | 63 | 69 | 44 | 56 | 44 | 25 | 19 | 44 | 81 | 69 | 88 | 69 | 16 |
| X21 | 68 | 73 | 68 | 50 | 27 | 18 | 27 | 14 | 82 | 86 | 86 | 73 | 22 |
| all sites | 76 | 78 | 89 | 65 | 59 | 50 | 57 | 43 | 83 | 91 | 91 | 80 | 46 |
| mean/site | 65.4 | 65.3 | 64.8 | 52 | 40.9 | 32 | 32.4 | 23.2 | 81.3 | 82.9 | 79.7 | 75 | 100 |
Classification showed that a reduced dataset (periods 1 and 3 only) represents the assemblage structure in a similar way to the complete dataset: All sites are grouped together until the last splitting, where they are divided as a result of sampling intensity (Fig. 5).
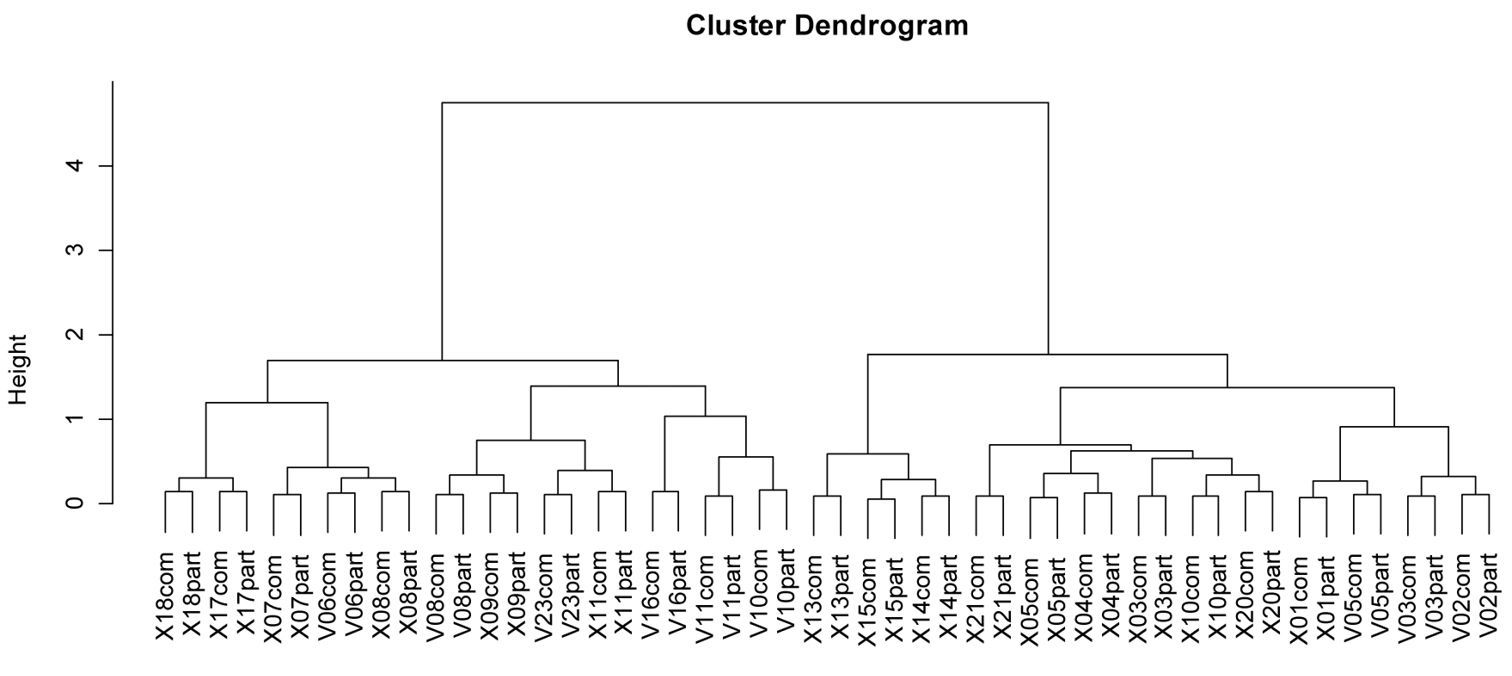
Dendrogram of sites with data from complete sampling (comp) and sampling periods 1 and 3 (part). The dendrogram is based on Bray-Curtis distances and uses Ward´s minimum variance method.
The strong activity peak observed in our study at the
start of the plant growing season has already been observed in many
carabids in mountain regions, especially in subalpine and alpine
ecosystems (
However, snow edge species (
While most papers focus on the abundant species, our
data show that an early activity peak can also be observed for less
abundant species.
Although high spring activity was seen for all species,
we observed differences between species: we were able to divide our
species into three groups according to their phenological appearance.
While the first group (early and strong spring activity peak) is most
frequently described in mountain ecosystems, delayed spring activity
has already been shown for some species by other authors (
The observed activity densities of species, with some
species having a strong and early peak and others with a delayed peak
led us to the conclusion that the best results can be expected by
reducing the sampling to two periods at the beginning of the season. In
fact, sampling periods 1 and 3 showed the highest average coverage of
the sites’ species richness, and the quota of species trapped was
better than that suggested by
We would like to thank the Bayerischen Naturschutzfonds for financial support and the SMNK for carrying out the project. We thank Thomas Harry, Florian Raub and Ludger Scheuermann for their help during field work and Franziska Meyer for help in the laboratory. Special thanks goes to the cow-herder Helmut Radeck and his family for their hospitality. Many thanks to Gillian Cerbu and Linda Froome for language improvements.