


(C) 2011 Michael Gerisch. This is an open access article distributed under the terms of the Creative Commons Attribution License, which permits unrestricted use, distribution, and reproduction in any medium, provided the original author and source are credited.
For reference, use of the paginated PDF or printed version of this article is recommended.
Environmental variability is the main driver for the variation of biological characteristics (life-history traits) of species. Therefore, life-history traits are particularly suited to identify mechanistic linkages between environmental variability and species occurrence and can help in explaining ecological patterns. For ground beetles, few studies directly related species traits to environmental variables. This study aims to analyse how life-history traits of alluvial ground beetles are controlled by environmental factors. I expected that the occurrence of species and the occurrence of specific traits are closely related to hydrological and disturbance parameters. Furthermore I expected most of the trait-variation to be explained by a combination of environmental variables, rather than by their isolated effects. Ground beetles were sampled in the year 2005 in floodplain grassland along the Elbe River in Germany. I used redundancy analysis to quantify the effects of hydrological, sediment, and disturbance related parameters on both species occurrence and species traits. I applied variation partitioning to analyse which environmental compartments explain most of the trait variation. Species occurrence and trait variation were both mainly controlled by hydrological and flood disturbance parameters. I could clearly identify reproductive traits and body size as key traits for floodplain ground beetles to cope with the environmental variability. Furthermore, combinations of hydrological, habitat disturbance, habitat type, and species diversity parameters, rather than their isolated effects, explained large parts of ground beetle trait variation. Thus, a main conclusion of this study is that ground beetle occurrence is mainly determined by complex, multi-scale interactions between environmental variability and their life-history traits.
life-history traits, environmental variability, species sorting, trait shifts, floodplain, ecosystem processes
Observing the occurrence of species and evaluating the
response of biodiversity to changing environmental conditions is a major
task of ecologists. With increasing ecological knowledge, however,
the scientific focus shifted from purely observational to rather
explanatory and predictive approaches. Recent attempts try to understand
the observed occurrence patterns by focusing on the relationships
between environmental variability and the life-history traits of
organisms (
Previously, such analyses were mainly applied to plants,
but an increasing number of studies directly related environmental
variables also to ground beetle life-history traits.
Analysing trait-environment relationships is especially
suitable in naturally dynamic landscapes, because this allows for
observing biological patterns without elaborately manipulate
environmental conditions (
Despite the general knowledge of ground beetle survival
strategies in floodplains, it is yet not clear how environmental
variability controls the distribution of particular traits within
species assemblages.
The study was conducted at the UNESCO Biosphere
Reserve “Elbe River Landscape” in Central Germany at the Elbe River.
With a length of about 1, 100 km and a catchment area of about 150, 000
km2 the Elbe River is the third largest stream in Germany and ranks
among the largest streams in Europe. The mean annual discharge of the
Elbe River ranges from 336m3/s upstream to 730m3/s downstream. The water
level is mainly dominated by snow-melt in spring and erratic
precipitation over the year, inducing high discharge in winter and
spring, and low discharge in summer. In general, flood regime and
floodplain habitats of the Elbe River in Central Germany can be
considered close to the natural state (
The survey was carried out in the year 2005 on 36
plots located in seasonally flooded grasslands. The study site is
located near the village of Steckby, close to Dessau town in the state
of Saxony-Anhalt. The plots were located following a stratified,
randomised design. For this, the study site was subdivided into three
habitat types regarding vegetation and soil morphology: floodchannels,
humid grasslands and mesophilous grasslands. The sampling plots were
then randomly located within each of the three habitats (see
Information on the life-history traits of ground beetles were queried from a self-compiled database. The included trait data came from standard references on Central European ground beetles, mostly determination keys and ground beetle compendia. Altogether 18 traits with 60 trait categories, ranging from biological and morphological to ecological characteristics, were included in the database. For this study I used 8 traits and 25 trait categories to describe the effects of environmental variables on the variation of the traits. See Appendix II for an overview of the traits included in the database and the ones used in this study including the references used to compile the database. To obtain a rectangle traits-by-site matrix that can be analysed by multivariate statistics, the number of individuals possessing a particular trait category (e.g. spring breeders) was allocated to each plot, similarly to an ordinary species-by-site matrix (i.e. species were replaced by trait categories). If individuals shared more than one trait category, e.g. dimorphic species, they received an entry for each category.
Environmental variablesIn the years 1998 and 1999, dipwell and crest gauges
were installed on each sampling plot to measure maximum groundwater
depth (in m), mean groundwater depth (in m), duration of inundation
(in weeks), and inundation height (in m).
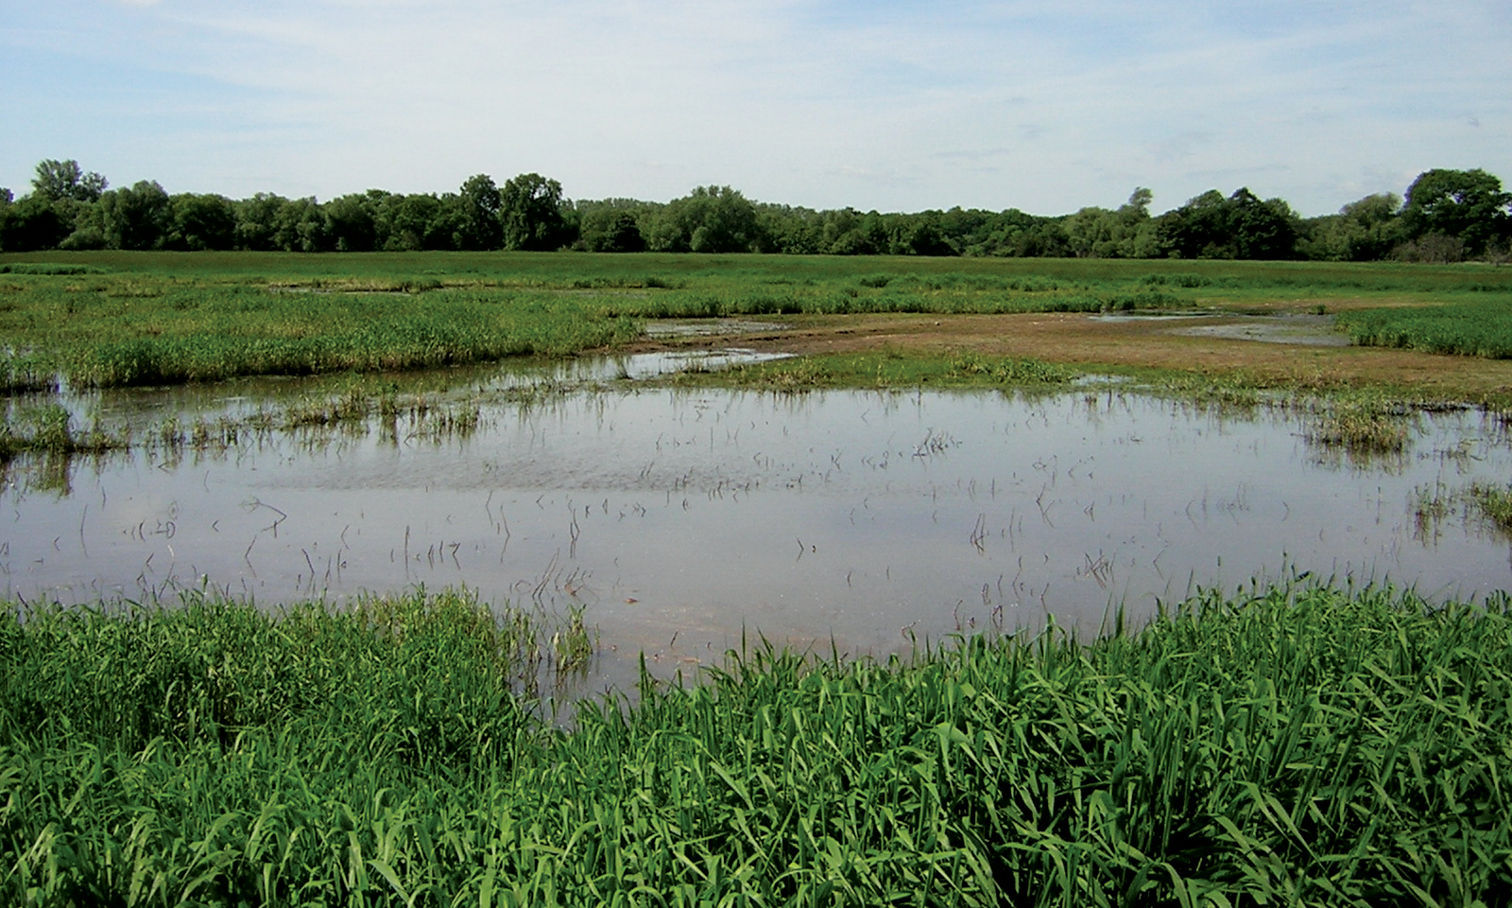
Grassland habitats displaying different hydrological conditions in the study site Steckby. Copyright Mathias Scholz (UFZ, Leipzig).
Ecological studies are often biased by spatial
autocorrelation, i.e. closely located samples are not independent
because they can share attributes of their neighbouring samples (
Principal Component Analysis (PCA) was conducted i) to identify the most important environmental variables and ii) to exclude highly correlated variables prior to further analyses. Since the environmental variables were measured on different scale units (see Table 1), I standardised them to a zero mean and unit variance to equally weight the variables. Data for substrate, management intensity, and habitat type were categorical. Therefore, these variables were transformed into dummy coded binary data before included into the analysis.
I aimed to assess the influence of environmental
variables on both species assemblages and on particular species traits. A
preliminary Detrended Correspondence Analysis revealed very short
gradient lengths of the species and the trait datasets, suggesting low
turnover rates of species and traits among the axis-gradient and thus a
linear response. Therefore, I performed Redundancy Analysis (RDA) on
the species (which is referred to as “species-RDA” in the following) and
the traits dataset (“trait-RDA”), being much better suited for linear
response patterns than unimodal models like Canonical Correspondence
Analysis (
To determine the degree to which the occurrence of
species and the occurrence of particular species traits are correlated,
I performed a Procrustes rotation analysis on the species and the trait
dataset. Procrustes rotation aims to find maximal congruency, i.e.
similarity of data points, between two ordination models by rotating,
expanding and rescaling an ordination model towards a target ordination (
Variation partitioning was then used to separate the
effects of different environmental compartments (predictor variables) on
the variation of ground beetle life-history traits (response variable).
Variation partitioning is based on RDA and tries to identify how
successful a set of different predictor variables is at explaining the
response variable (
Relative abundances of the individuals were
log-transformed to reduce the skew in the data. All statistical analyses
were performed with the packages vegan (version 1.15–4;
Life-history traits of ground beetles used in this study.
| Trait | Trait categories | comments |
|---|---|---|
| Body size | 1 – diminutive | < 3.0 mm |
| 2 – very small | 3.1 – 6.0 mm | |
| 3 – small | 6.1 – 10.0 mm | |
| 4 – medium | 10.1 – 19 mm | |
| Wing morphology | 1 – macropterous | |
| 2 – brachypterous | ||
| Season of reproduction | 1 – spring | From February to JuneFrom July to Oktober |
| 2 - autumn | ||
| Hatching season | 1 – spring | |
| 2 – atumnn | ||
| Overwintering type | 1 – as imago | |
| 2 – as larvae | ||
| Daily activity | 1 – diurnal | |
| 2 – nocturnal | ||
| Body pubescence | 1 – head | |
| 2 – pronotum | ||
| 3 – elytra | ||
| 4 – hairless | ||
| Food strategy | 1 – opportunistic carnivores | |
| 2 – specialized carnivores | ||
| 3 – phytophagous | ||
| 4 – polyphagous |
Overall, 26, 557 individuals from 107 species were sampled. Agonum emarginatum (Gyllenhal 1827; 27.7%), and Poecilus versicolor (Sturm 1824; 12.4%) made out 40 % of the overall individual density. 38 species were recorded with less than 5 individuals, including some stenotopic alluvial species like Agonum dolens (Sahlberg 1827), Bembidion argenteolum (Ahrens 1812) and Omophron limbatum (Fabricius 1776). See Appendix I for a full species list. I found only minimal spatial autocorrelation of Simpson's diversity, as seen by the relatively low Moran’s I value (M), which was only slightly greater than zero (M=0.178, p=0.015) (Table 3). Spatial dependency of both species richness (M=0.292, p=0.001) and species abundances (M=0.394, p<0.001) was little higher, nevertheless indicating a minor role of spatial autocorrelation in this study.
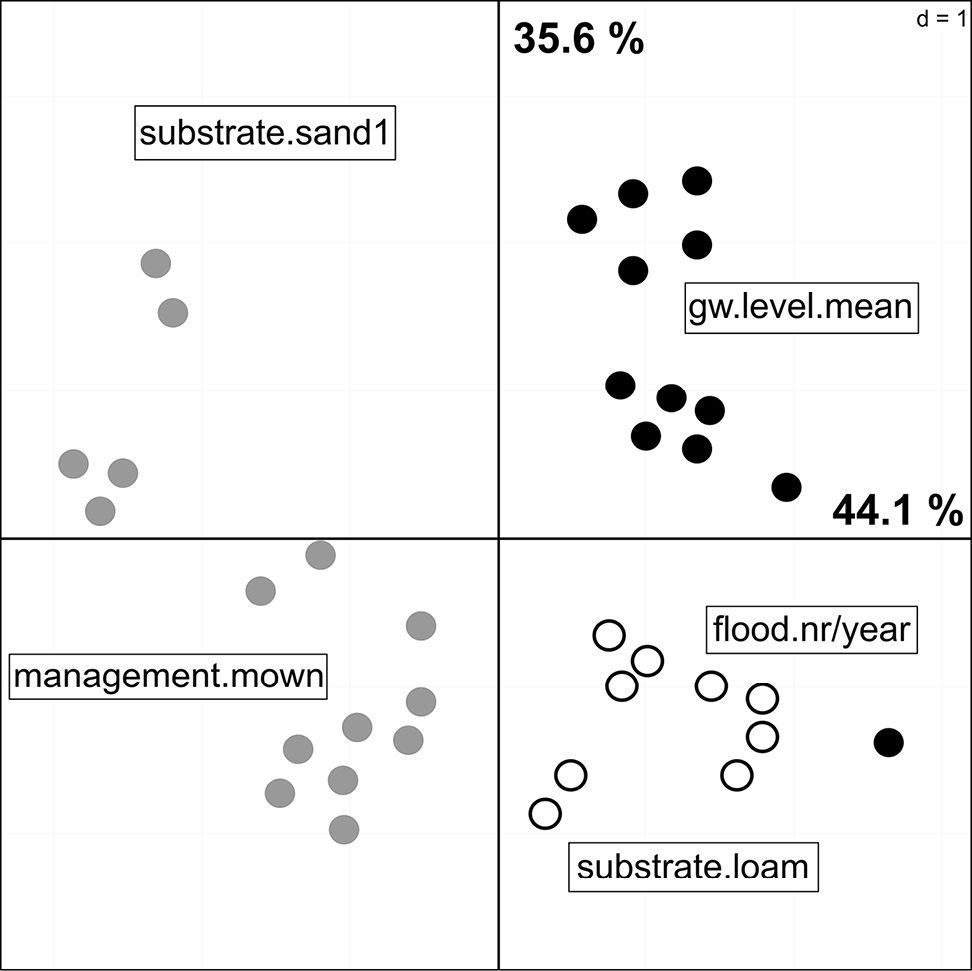
PCA of the reduced environmental dataset. Points represent the sampling plots and the colours the different habitat types: Black = floodchannels, grey = mesophilous grassland, white = humid grassland.
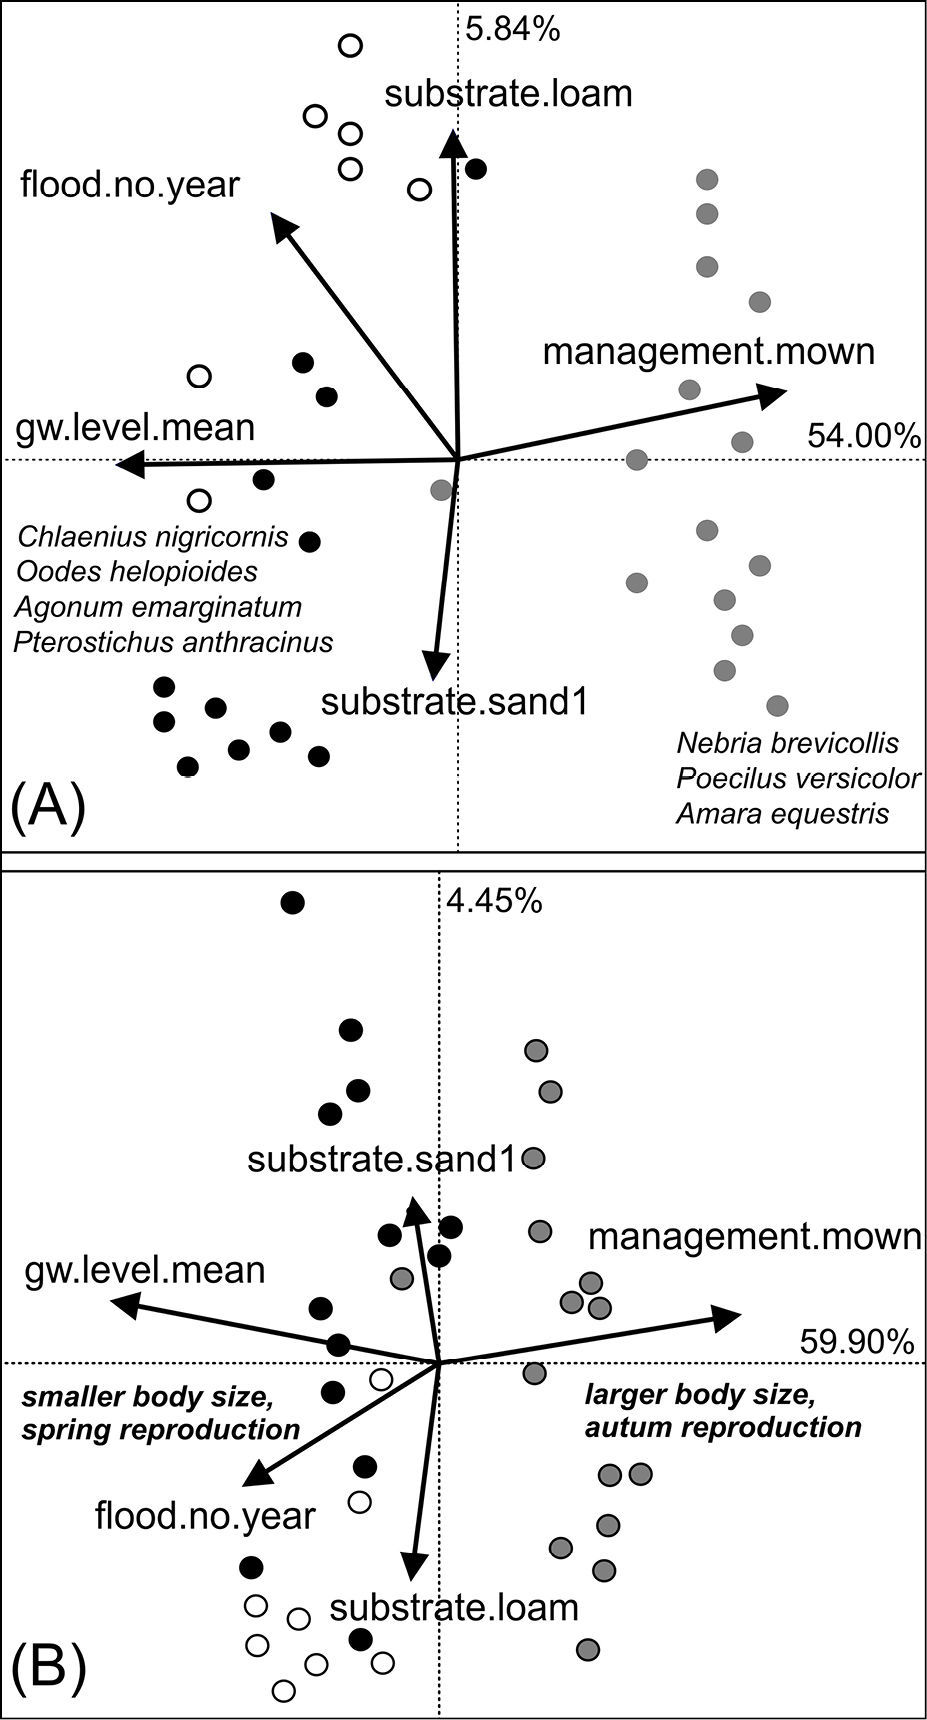
Relationship between environmental variables and species occurrence A and occurrence of species traits B by means of Redundancy Analysis. Points represent the sampling plots. Species scores omitted due to clarity. The colours indicate the habitat type of the sampling plots: black=floodchannels, grey=mesophilous grassland, white=humid grassland. Traits and species that accounted most for the explained variance along the first RDA axis are plotted in italics.
Environmental variables used in the study
| Variable | Description | Data scale | Compartment |
|---|---|---|---|
| Flood.height.max | Maximum flood height | Continous (cm) | Disturbance |
| Flood.nr/year | Number of floods per year | Continous (no.) | Disturbance |
| Flood.duration | Flood duration | Continous (weeks) | Disturbance |
| Gw.level.max | Maximum ground water depth | Continous (cm) | Hydrology |
| Gw.level.mean | Mean groundwater depth | Continous (cm) | Hydrology |
| Gw.level.varcoef | Variation coefficient of groundwater depth | Continous (no dimension) | Hydrology |
| Substrate.loam | Loamy substrate | Binary (0=no, 1=yes) | - |
| Substrate.sand1 | Sandy substrate (<90% sand amount) | Binary (0=no, 1=yes) | - |
| Substrate.sand2 | Sand (>90% sand amount) | Binary (0=no, 1=yes) | - |
| Substrate.silt | Silty substrate | Binary (0=no, 1=yes) | - |
| Management.mown | Plot mown | Binary (0=no, 1=yes) | Disturbance |
| Management.unused | No management | Binary (0=no, 1=yes) | Disturbance |
| Habitat.floodchannel | Habitat type "floodchannel" | Binary (0=no, 1=yes) | Habitat |
| Habitat.meadow.medium | Habitat type "mesophilous grassland" | Binary (0=no, 1=yes) | Habitat |
| Habitat.meadow.humid | Habitat type "humid grassland" | Binary (0=no, 1=yes) | Habitat |
To reduce the complexity of the subsequent models by excluding highly correlated data, I conducted a PCA on the full environmental dataset. The full PCA model explained 68.4 % (F1: 49.4, F2: 19.3) of the total variance in the environmental data, but due to collinearity I excluded 10 environmental variables from this model (abbreviations see Table 2): gw.level.max, flood.height.max, flood.duration, gw.level.varcoef, substrate.silt, substrate.sand2, management.unused, habitat.floodchannel, habitat.meadow.medium, habitat.meadow.humid. The reduced model consisted of 5 variables and explained 79.7 % of the variation of the remaining environmental data (F1: 44.1%, F2: 35.6%). The sampling plots were ordinated along gradients of hydrological, habitat disturbance, and soil parameters (Fig. 2). Plots on the first PCA axis were mainly influenced by habitat management as well as flood and groundwater related variables, whereas soil type was the most important factor on the second axis. There are three groups of plots with similar environmental conditions, which clearly refer to the habitat types defined prior to the analyses. Habitats located in floodchannels were strongly influenced by the mean groundwater depth, whereas humid grassland habitats were more affected by the numbers of floods. The driest plots have also the highest amount of sand and are mown once or twice a year, compared to the unused floodchannels.
To evaluate how environmental variables affected the composition of species and traits I performed a Redundancy Analysis (RDA) with the reduced environmental dataset on the species and the trait dataset. The first two axes of the species-RDA explained 58.54% of the variance in the species dataset (F1: 54.00%, F2: 5.84%, Fig. 3A). It is obvious that mainly management and hydrological variables, such as the mean groundwater depth, are the main drivers affecting species occurrence. Mainly hygrophilous alluvial species, such as Agonum or Bembidion species, but also Oodes helopioides (Fabricius 1792) and Pterostichus anthracinus (Illiger 1798) are related with these environmental conditions. Therefore, plots possessing a high proportion of alluvial species were ordinated on the left side of the diagram. In contrast, the most ubiquitous species, like Pterostichus melanarius (Illiger 1798), Poecilus versicolor (Sturm 1824) and Nebria brevicollis (Fabricius 1792), as well as xerophilous species like Amara equestris (Duftschmid 1812) were rather correlated with increasing human management and higher groundwater levels and thus ordinated to the right side of the diagram. Because of the low explanatory power of the second RDA axis, soil type has only little impact on species occurrence patterns.
The first two axes of the trait-RDA explained 64.35% of the total trait variance in the dataset (F1: 59.90%, F2: 4.45%, Fig. 3B). The results indicate that especially reproductive traits and body size are strongly affected by the disturbance regime and by the hydrology of the habitats. On the left side of the ordination diagram, plots are located with a high amount of individuals reproducing in spring and hatching in summer. Most of them are additionally small sized species. On the contrary, summer/autumn breeding species and larger species are plotted more on the right side of the diagram.
Procrustes rotation analysis showed a significant correlation between species ordination and trait ordination, relatively independent from the presence of environmental constraints in the ordination (Table 4). This shows that sampling plots with a unique species composition also possess organisms with specific life-history traits. The PCA models (ordination of species and traits is not constrained by environmental variables) showed a higher congruency between each other, whereas the rotation of the RDA models tended to be less precise and showed a large part of unexplained variance, evident from the RSS values four times higher than those from the PCA model rotation.
The environmental compartments hydrology, disturbance, habitat type, and species diversity explained 72% of the overall variation of the ground beetles life-history traits (Fig. 4). However, partitioning the effects of the predictor variables on ground beetle trait variation revealed only little explanatory power of each environmental compartment separately. Hydrology alone explained the largest part and diversity and disturbance explained the smallest part of the overall variation. The unique contribution of all compartments to the overall trait variation was 22%, whereas the common contribution (i.e. the combination of all compartments) was about 50%. In other words, the different environmental compartments explained to large degrees similar parts of the trait variation, indicating a certain amount of explanatory redundancy in the predictor variables.
DiscussionThis study tackles the problem of identifying mechanistic linkages between environmental variability, biotic characteristics of organisms and the occurrence of species in dynamic landscapes. Here I show that both species occurrence and the variation of ground beetle life-history traits are controlled by similar environmental variables. Reproductive traits and body size were found to be key traits of floodplain ground beetles enabling them to cope with management intensity and groundwater depth. Furthermore, combinations of hydrological, habitat disturbance, habitat type, and species diversity parameters, rather than their isolated effects, explained large parts of ground beetle trait variation. A main conclusion of this study is therefore that ground beetle occurrence in floodplain grasslands is mainly determined by complex interactions between environmental variability and specific life-history traits.
Environmental effects on species traitsManagement intensity, groundwater depth, and to a
lesser degree soil substrate were the most important environmental
variables driving the occurrence of species and the variation of ground
beetle traits. Previous work on ground beetles in floodplains
highlighted the importance of environmental variables for species
occurrence in these dynamic habitats. For riverbanks, being considered
as the most disturbed habitats in floodplains,
However, species occurrence patterns are often
distance related, i.e. the values of variables (species, individuals)
sampled at nearby locations are not independent from each other and lead
to spatial autocorrelation (
The results indicate that species assemblages of
certain habitat types share unique combinations of traits, which
clearly confirms the habitat templet theory. The importance of
hydrological and disturbance parameters for wetland ground beetle traits
is well documented in the literature.
Partitioning the effects of environmental variables
clearly showed that a combination of all four compartments hydrology,
habitat disturbance, habitat type, and species diversity explained the
largest part of the overall trait variation. However, this does not
automatically mean that each compartment separately is unimportant for
ground beetles. In fact, each environmental compartment explained
unique parts of the ground beetle trait variation, although to a
comparable little amount. For example, flood disturbance is closely
connected to hydrological parameters, i.e. frequently flooded plots are
often the ones with the lowest groundwater depth. However,
hydrological factors might not necessarily have similar impacts on the
trait variation than habitat disturbance parameters. Habitat disturbance
primarily affect morphological characteristics of the species, like
wing morphology or body size (
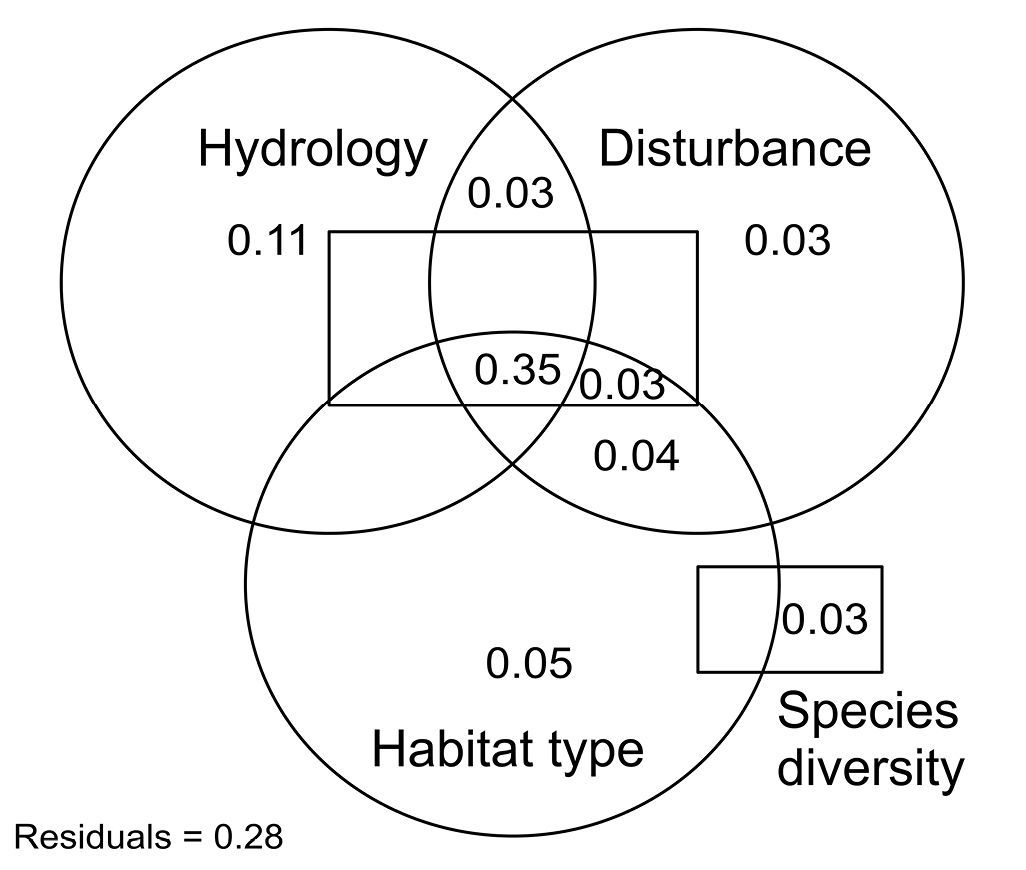
Partitioning the effects of four environmental compartments hydrology, disturbance, habitat type, and species diversity on the variation of ground beetle life-history traits. See Table 2 for a description of the variables included in each compartment. Values < 0.03 are not shown.
Moran’s I values
| Metric | Moran’s I | p |
|---|---|---|
| Species richness | 0.292 | 0.001 |
| Species abundances | 0.394 | <0.001 |
| Simpson's diversity | 0.178 | 0.015 |
Procrustes rotation analysis of species and the trait dataset
| Unconstrained(PCA) | Constrained by environmental dataset (RDA) | |
|---|---|---|
| Correlation coefficient | 0.69 | 0.61 |
| Residual Sum of squares | 20.37 | 82.73 |
| Root mean squared error | 0.12 | 0.13 |
| p-value | <0.001 | <0.001 |
This study confirms current knowledge about (pre-)adaptations of alluvial ground beetles to floodplain dynamics. As is evident from previous work, traits related to dispersal and reproduction are the most affected ones by flooding and are shown to change strongly with increasing inundation. This trait variation is best explained by a combination of different abiotic variables, indicating that ground beetle life-history traits are affected by multiple environmental stressors. Consequently, future ecological work and floodplain conservation measures should both focus on different facets to maintain the high trait diversity of alluvial ground beetles and the ecological functions they have in ecosystems.
Based on this work I can conclude that life-history traits can be used to predict the occurrence of organisms with certain biological characteristics to altering floodplain dynamics and to better understand ecological patterns (i.e. species occurrences). Therefore, combining traditional taxonomic approaches with current trait-based approaches is a great chance to reveal ecosystem processes and identify “rules” describing how organisms interact with their dynamic environments. Due to the high variety of different traits and strategies to cope with habitat dynamics, I appeal to intensify the application of trait-analyses also for ground beetles to increase our knowledge on processes affecting carabid-environment relationships.
Arno Schanowski (ILN Bühl, Germany) determined the ground beetle catches. I gratefully thank the numerous people who helped with the fieldwork, especially Ines Rensch and her apprentices (UFZ). Additionally, I thank the administration of the Elbe River Landscape Biosphere Reserve and the many landowners who allowed us access to their properties. This project was funded by grants from the Federal Ministry of Education and Research (RIVA-project; No. 0339579) and the Federal Institute of Hydrology (HABEX-project; No. RA/V1658).
List of sampled individuals (doi: 10.3897/ZooKeys.100.1427.app1). File format: Microsoft Excel Spreadsheet (xls).
Copyright notice: This dataset is made available under the Open Database License (http://opendatacommons.org/licenses/odbl/1.0/). The Open Database License (ODbL) is a license agreement intended to allow users to freely share, modify, and use this Dataset while maintaining this same freedom for others, provided that the original source and author(s) are credited.
Overview of the traits included in the database and the ones used in this study (doi: 10.3897/ZooKeys.100.1427.app2). File format: Microsoft Word Document (doc).
Copyright notice: This dataset is made available under the Open Database License (http://opendatacommons.org/licenses/odbl/1.0/). The Open Database License (ODbL) is a license agreement intended to allow users to freely share, modify, and use this Dataset while maintaining this same freedom for others, provided that the original source and author(s) are credited.