Belowground carabid beetle diversity in the
western Palaearctic – effects of history and climate on range-restricted
taxa (Coleoptera, Carabidae)
Introduction
Studies on the spatial patterning of biodiversity and its
potential determinants have gained much attention over the last
decades, especially in light of global change and its assumed effects
on the distribution and survival of many species (Kerr et al. 2007).
In this regard, the diversity of belowground habitats has been studied
only poorly, even though it comprises many rarely recorded and highly
adapted species (Culver et al. 2006). These habitats are characterized by much lower temporal variability of the physical environment than aboveground habitats (Wilkens et al. 2000; Assmann et al. 2010).
Still, dependencies on environmental factors that have been identified
as potential drivers of the distribution of diversity of many
aboveground organism groups are being assumed also for subterranean
diversity (Culver et al. 2006; Zagmajster et al. 2008).
Especially productivity of the aboveground habitats, which again is
determined by an interplay of energy input and water availability (Hawkins et al. 2003),
has repeatedly been suggested as a possible factor influencing
diversity in these subterranean habitats, which are often considered
(and this particularly applies to caves) to be to a large part dependent
on allochtonous input of resources (Gers 1998; Culver et al. 2006).
Such a dependency on environmental factors could have far-reaching
consequences for the strongly dispersal-limited Belowground taxa
regarding future shifts in environmental conditions due to climate
change (Sharratt et al. 2000).
However, reduced dispersal abilities due to their strong
habitat specialization also suggest that especially processes and
environmental conditions over historical times have played important
roles in the survival and present distribution of these species. Regions
with high numbers of subterranean species have probably been subject to
lower variability in environmental conditions over long time periods
and a higher persistence of ecosystems than other western Palaearctic
regions (Casazza et al. 2008; Assmann et al. 2010).
About 50% of the terrestrial fauna in subterranean habitats are beetles (Zagmajster et al. 2008).
With more than 1, 000 troglobiont and endogeic species described so
far, carabid beetles make up a large part of this subterranean fauna in
the western Palaearctic, which harbours one of the hotspots of highest
diversity of terrestrial troglobites in the northern hemisphere (Casale et al. 1998; Culver and Sket 2000; Culver et al. 2006; Assmann et al. 2010).
Carabids are thus also well suited to provide important insights into
aspects of faunal diversity of subterranean habitats. Moreover, results
from the study of the highly diverse subterranean carabid fauna also
have implications for the understanding of general patterns in the
distribution of biodiversity over large geographic extents. Schuldt and Assmann (2009)
found differences in the potential impact of current climate and
historical processes on overall diversity and that of widespread and
endemic species of carabid beetles in the western Palaearctic, probably
due to differences in the dispersal abilities of these taxa. Comparison
of these patterns to those of the strongly range-restricted carabids
living in belowground habitats can help to extend our understanding of
the distribution of diversity and the possible mechanisms behind such
range-size dependent diversity patterns.
The aim of our study was to analyse spatial patterns in
the species richness of belowground carabids and their potential
environmental determinants on a large scale across Europe and North
Africa. Distinguishing between the carabid fauna of deeper soil
horizons, beetles of the so-called superficial underground compartment
(“milieu souterrain superficiel”, MSS; Juberthie 1979)
as a macroporal system in rocky material, and obligate cave-dwellers
is not possible for all regions of the western Palaearctic, as species
known as specialized cave dwellers have also been recorded in the MSS
(e.g., Aphaenopidius kamnikensis Drovenik 1987, a carabid until recently known to occur only in caves; Drovenik et al. 2007).
Thus, in our analysis we combine all species from these systems with
an obligate subterranean way of living and use the term “belowground
fauna” for these taxa from hereon. Species with the ability to fly and
also occurring in aboveground habitats (e.g., species of Limnastis) were not treated as part of the belowground fauna.
Analysing country-level species and environmental data,
we hypothesize weak links between belowground diversity and current
climatic conditions and a strong signal of history contained in
broad-scale distribution patterns of belowground carabids. This would
support and help to explain the previous findings concerning range size
dependent differences between total, widespread and endemic richness of
carabids in the response to large-scale environmental conditions (Schuldt and Assmann 2009).
Methods
Species and environmental data
Species numbers of carabid beetles were extracted from Löbl and Smetana (2003)
for 39 countries of the western Palaearctic. The distribution of
diversity for most invertebrates is not well documented at smaller
scales over such large geographic extents, which hinders analysis on a
more detailed scale or assigning reliable data to equal-area grids (Baselga 2008; Hortal 2008).
In contrast, country-level data for carabid beetles in the western
Palaearctic is quite comprehensive and allows accurate analysis of
macroecological patterns for such a highly diverse insect taxon (Schuldt and Assmann 2009; Schuldt et al. 2009).
In our analyses, we excluded Iceland due to its strong insularity as
well as Andorra, Liechtenstein and Luxembourg because of their small
country size. All species with a strict subterranean or cave-dwelling
lifecycle, as documented in the literature and indicated by reduced and
missing eyes, were classified as belowground species (see Table S1
in Supplementary Material for a list of the genera included). While
total species richness is well documented for most western Palaearctic
countries (Schuldt and Assmann 2009),
new species are still being recorded from subterranean habitats in the
most species-rich southern European countries. However, this does not
affect the overall spatial pattern of species richness, neither for
total nor for belowground carabid richness. We used patterns of total
species richness of all carabids and the richness of widespread and
endemic carabids (all extracted from Löbl and Smetana 2003)
for comparison with distribution patterns of belowground beetles.
Widespread (range sizes >6 x 10⁵ km²) and endemic carabids (range
sizes <6 x 10⁵ km²) were classified following the definition of Lumaret and Lobo (1996).
As we were also interested in the relationship with species richness of
vascular plants, we compiled data for this taxon from Walter and Gillett (1998), Groombridge and Jenkins (2002) and CBD National Reports (www.cbd.in/countries).
For our analyses we used a set of environmental variables related to recently intensively discussed hypotheses (Willig et al. 2003) on the influence of climatic and topographic factors on the spatial distribution of species richness (see Table 1 for a complete list of variables used). Climate data were obtained as country-level averages of high-resolution data from Mitchell (2002)
and comprised mean annual temperature, mean temperature of the coldest
and the warmest month, temperature seasonality (difference between
warmest and coldest month), mean annual precipitation, mean
precipitation from March to November, seasonality in precipitation
(difference between wettest and driest month) and the number of days
with frost. Additionally, mean annual potential and actual
evapotranspiration (PET and AET) were calculated using Thornthwaite’s
method (Thornthwaite and Mather 1963; 1964; Black 2007). AET is often considered a surrogate measure for productivity (Hawkins et al. 2003).
Finally, range in elevation (i.e. the difference between the highest
and lowest elevation within each sampling unit) was compiled from CIA (2008) as a measure of both habitat heterogeneity as well as prevailing signals of evolutionary and historical processes (Schuldt and Assmann 2009).
From the same source, we extracted midpoint latitude and longitude of
the countries to quantify the spatial dimension of richness
distributions.
Statistical analyses
Environmental correlates of species richness of
belowground carabids were first analysed in regressions with single
environmental variables. Second- or third-order polynomials were added
to the centred predictor variables in case of significant non-linear
relationships. Species richness and country area were log10-transformed
to normalize distributions.
We then used regression modelling to assess the
separate and combined impact of three different sets of predictor
variables (spatial, topographic and climatic) on the richness pattern
of belowground carabids. Spatial, topographic and climatic factors
might explain similar proportions of the variability in the observed
richness patterns. Our approach allows us to handle the non-independence
of predictor variables, which might show the same autocorrelated
pattern but relate to different conceptual frameworks in the explanation
of diversity patterns, and thus to identify the isolated influence of
different sets of explanatory variables (Baselga 2008; Hortal et al. 2008).
For each set, we computed stepwise regression models with backward
elimination, excluding variables that caused low tolerance (<0.1)
due to high multicollinearity (r >0.9) with other variables in the
predictor sets (Quinn and Keough 2002).
Variation partitioning was used to assess the independent (i.e.,
purely spatial, topographic and climatic) and shared (spatially
structured and co-varying) effects of the three predictor sets on
Belowground carabid richness in a combined model (Legendre and Legendre 1998; Hortal et al. 2008). We included area as a co-variable into the analyses to account for differences in country size.
Spatial autocorrelation can inflate statistical errors in analyses of geographic diversity patterns (Diniz-Filho et al. 2003).
To account for this, we recalculated significance of regressions using
spatially corrected degrees of freedom by correlating observed and
predicted values of regressions (Qian et al. 2007) according to the modified t-test by Dutilleul (1993).
Additionally, we checked the adequacy of our non-spatial regression on
climate and topography to explain the spatial structure in the
belowground carabid data by generating a correlogram with Moran’s I
coefficients, which show the reduction in spatial autocorrelation after
fitting the regression model (Diniz-Filho et al. 2003).
Moran’s I values of zero indicate absence of spatial autocorrelation,
whereas larger or smaller coefficients (usually ranging between +1 and
-1) show the degree of positive or negative autocorrelation between
neighbouring sampling units. Non-significant values of Moran’s I
coefficients after fitting the explanatory variables indicate that the
variables selected well account for the spatial pattern in the richness
data (Diniz-Filho et al. 2003).
All statistical analyses were performed with SPSS 15.0 for Windows (SPSS, Chicago) and SAM 2.0 (Rangel et al. 2006).
Table 1.
Results (coefficients of determination, F-values, degrees of freedom and spatially corrected probabilities) of a regressions of belowground carabid species richness against single environmental variables and b regression modelling of species richness of belowground carabid beetles in the western Palaearctic.
|
Model (function)
|
R²adj
|
F
|
DF
|
p
|
|---|
| a) single regressions | |
|---|
|
Latitude (decimal degrees) |
lat-lat²+lat³
|
0.51 |
12.6 |
3, 35 |
0.012 |
| Longitude (decimal degrees) |
n.s.
|
|
|
|
|
| Area (km²) (log10) |
n.s.
|
|
|
|
|
| Elevation range (m) |
elev (+)
|
0.52 |
38.7 |
1, 37 |
<0.001 |
| Mean annual temperature (°C) |
mean_temp-mean_temp²
|
0.26 |
6.4 |
2, 36 |
0.042 |
| Mean temperature coldest month (°C) |
n.s.
|
|
|
|
|
| Mean temperature warmest month (°C) |
mean_warm-mean_warm²
|
0.24 |
5.8 |
2, 36 |
0.052 |
| Temperature seasonality (°C) |
n.s.
|
|
|
|
|
| Mean annual precipitation (mm) |
n.s.
|
|
|
|
|
| Mean precipitation March-November (mm) |
n.s.
|
|
|
|
|
| Seasonality precipitation (mm) |
n.s.
|
|
|
|
|
| Potential evapotranspiration (mm/yr) |
PET-PET²
|
0.38 |
11.1 |
2, 36 |
0.020 |
| Actual evapotranspiration (mm/yr) |
n.s.
|
|
|
|
|
| Frost frequency (days) |
frost (-)
|
0.14 |
5.0 |
1, 37 |
0.048 |
| b) regression modelling | |
|---|
|
Spatial (S) |
lat-lat²+lat³
|
0.51 |
12.6 |
3, 35 |
0.012 |
| Topographic (T) |
elev
|
0.52 |
38.7 |
1, 37 |
<0.001 |
| Climatic (C) |
PET-PET²
|
0.38 |
11.1 |
2, 36 |
0.020 |
| Combined (T+C) |
elev; PET-PET²
|
0.69 |
26.5 |
3, 35 |
<0.001 |
| Total (S+T+C) |
lat-lat²+lat³; elev; PET-PET²
|
0.68 |
13.5 |
6, 32 |
<0.001 |
Appendix 1, Figure S1 and Table S1.pdf – Spatial correlogram and list of Belowground genera.
Results
The distribution of species richness of carabids adapted
to belowground habitats showed a clear and significant latitudinal
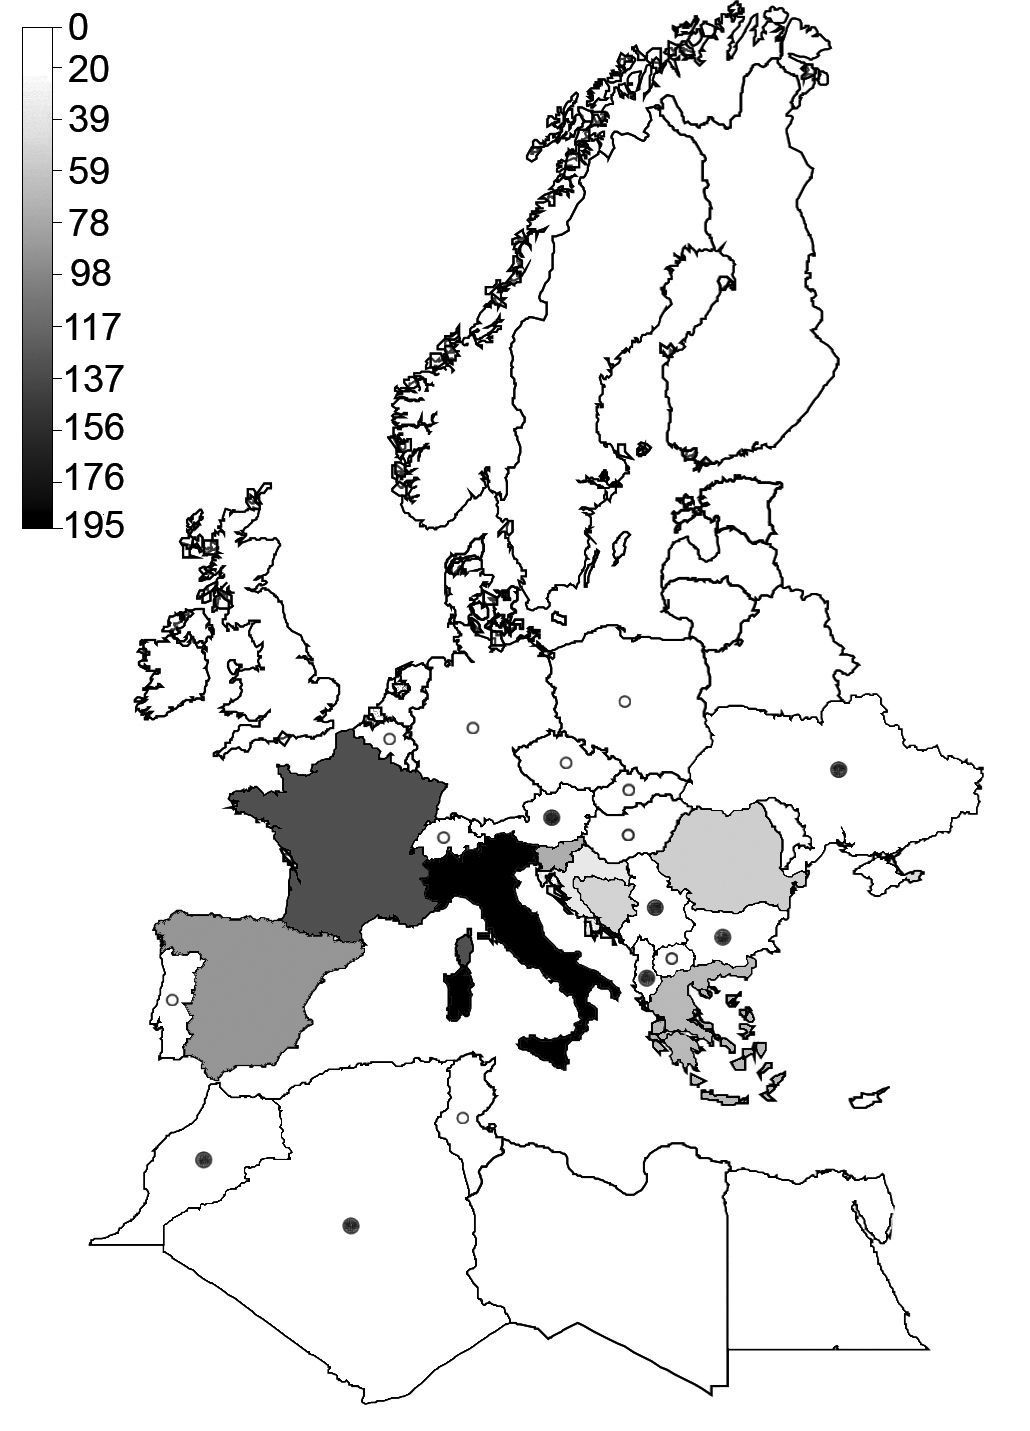
gradient across the western Palaearctic (Table 1). Richness was highest in southern European regions (Fig. 1).
This especially applies to Italy, which featured highest species
numbers. Larger countries such as France and Spain had lower numbers and
even for the Balkan Peninsula, species numbers were lower even when an
area of comparable size and latitudinal extent was considered (i.e.,
Albania, Bosnia-Herzegovina, Greece, Macedonia and Serbia-Montenegro,
which as a whole is slightly larger than Italy but harbours only 146
species as compared to 195 species for Italy). Even with Romania,
Bulgaria and Croatia added to this latter region, which increases the
area to more than twice the size of Italy, this region harbours only 36
more species than Italy.
Species numbers decreased towards northern Europe and North Africa (Fig. 2a) and most countries completely lacked belowground carabids, especially in the northern part of Europe (Fig. 1).
In contrast to latitude, subterranean carabids did not show a
significant relationship with longitude. Species numbers were also not
significantly related to the size of the countries analysed (Table 1a).
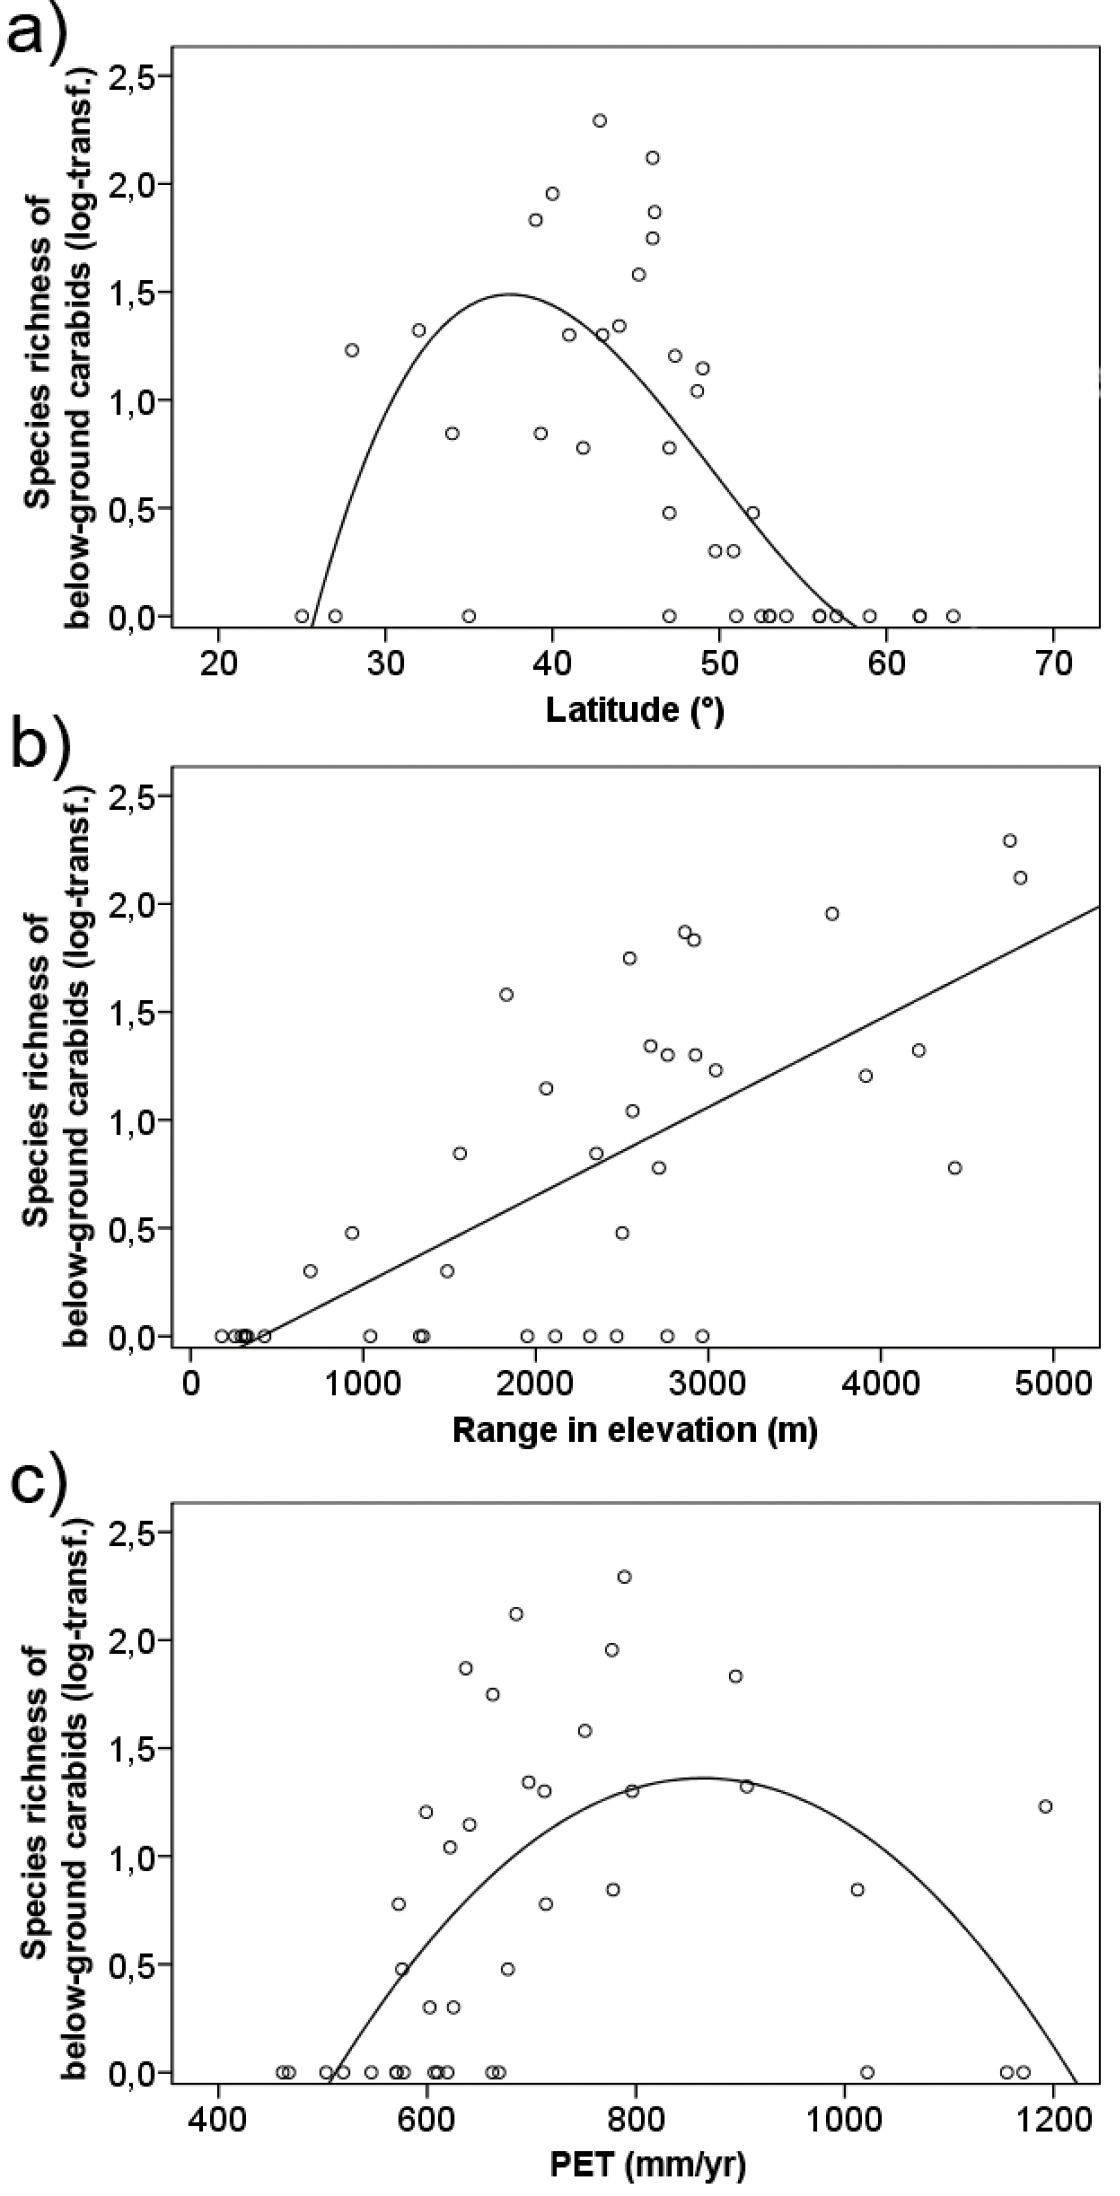
Several environmental variables were correlated with species richness
of belowground carabids. Richness showed a linear increase with and was
most strongly (R²=0.52; p<0.001) related to range in elevation (Table 1a, Fig. 2b).
Variables related to ambient energy input (PET, mean annual and mean
temperature of the warmest month) showed a hump-shaped relationship with
species richness (R² between 0.24 and 0.38; p≤0.052), which increased
up to a certain level with increasing available energy and decreased
again at highest levels of energy input (Table 1, Fig. 2c).
Frost frequency was negatively related to species richness, whereas
precipitation measures and AET were not significantly related to
belowground carabid diversity (Table 1).
Regression modelling identified a polynomial term of
latitude, the linear measure of elevation range and a quadratic term of
PET as the best predictors of spatial, topographic and climatic models
for species richness of belowground carabids (Table 1b).
A combined model of elevation range and PET explained 69% of the
variability in the carabid data. It removed all significant spatial
autocorrelation from the carabid data. Moran’s I coefficients in a
spatial correlogram over ten distance classes were all close to zero and
non-significant after fitting the model (see Appendix 1,
Figure S1: Spatial correlogram). This shows that these variables
quite well account for the spatial structure in the distribution of
subterranean carabid diversity and that modelling results are not
affected by spatial autocorrelation (Diniz-Filho et al. 2003).
The total model, adding a spatial component to these variables, did
not increase the goodness of fit and explained 68% of the data
variability (Table 1b).
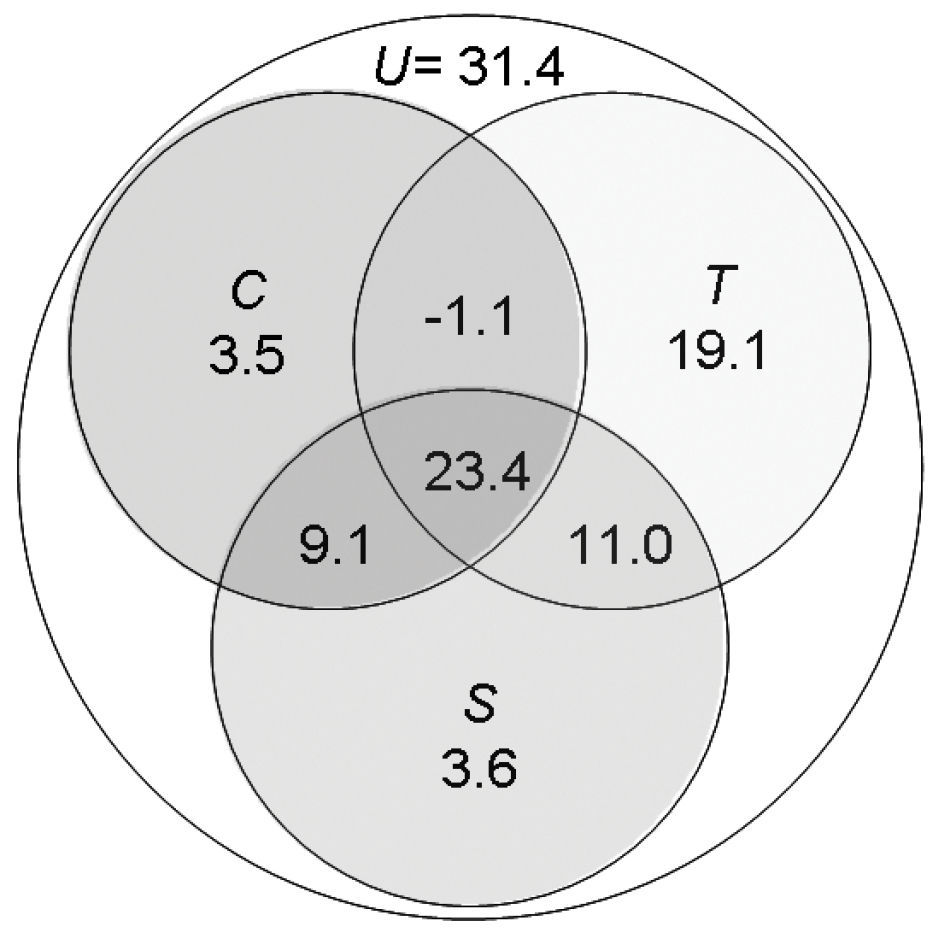
Variation partitioning showed that range in elevation had by far the
strongest independent effect on species richness of belowground
carabids, accounting for 19% of the explained variance. Together with
the spatially structured effect of elevation range, this factor
explained 30.1% of the carabid data variability (Fig. 3).
In comparison, independent spatial and climatic as well as spatially
structured climatic effects were weak. The shared variation for all
three components together, i.e. spatially structured climatic and
topographic effects, was 23.4% (Fig. 3).
Richness of Belowground carabids was strongly correlated
with total species richness of carabid beetles (Pearson’ r=0.76;
p<0.001, corrected for spatial autocorrelation), less strongly with
richness of widespread species (r=0.63; p=0.001) and most strongly with
richness of endemic carabids (r=0.87; p<0.001). It was also highly
correlated with species richness of vascular plants (r=0.86; p<0.001)
across the western Palaearctic.
Figure 1.
Distribution of species richness of belowground carabid beetles across the western Palaearctic, based on Löbl and Smetana (2003).
Shadings and symbols indicate the number of species recorded for each
country. Countries with 11–20 subterranean species are marked by a
filled circle, countries with 1–10 species by an open circle. Countries
for which no subterranean species have been recorded are white and
without a symbol.
Figure 2.
Relationship between species richness of belowground carabid beetles (log10-transformed) and a latitude (R²adj.=0.51; p=0.012), b range in elevation (i.e., topograohic variability; R²adj.=0.52; p<0.001) and c annual potential evapotranspiration (R²adj.=0.38; p=0.020) in the western Palaearctic.
Figure 3.
Partitioning of variation from regression modelling
for species richness of belowground carabids. Values give the % of the
total variation independent and shared effects of spatial (S), topographic (T) and climate (C) models account for in the explanation of richness patterns. U is the unexplained variation.
Discussion
The spatial analysis of belowground carabids clearly
identifies southern Europe, and especially Italy, as the region with
highest species richness in the western Palaearctic. Generally, this
region has been classified as one of the hotspots of overall terrestrial
troglobiont diversity based on the comparison of local species numbers
from single caves (Vigna Taglianti 1982; Culver and Sket 2000) and from the small-scale study of selected regions across Europe (Culver et al. 2006).
Our study extends this knowledge to the regional scale for one of the
most species-rich terrestrial belowground taxa using a spatially and
temporally comprehensive dataset. So far, the diversity of separate
subterranean groups has scarcely been studied in detail (Zagmajster et al. 2008).
Moreover, in contrast to most previous studies focusing on obligate
cave-dwellers, our study comprises a broader range of subterranean
species, including those living in the superficial underground
compartment (MSS; Juberthie 1979), and thus provides a more general picture of belowground diversity patterns.
Species richness of carabid beetles adapted to
belowground habitats significantly and most strongly co-varied with
range in elevation. To a certain extent, this might reflect effects of
habitat heterogeneity and availability (Kerr and Packer 1997; Rahbek and Graves 2001),
as mountainous regions are likely to feature extensive cave and karst
systems. However, large karst areas also occur in regions which harbour
only few or no belowground carabids at all (e.g., Belgium, England,
Switzerland; see also Culver et al. 2006).
Rather, our findings indicate a strong effect of historical processes
on the present distribution patterns of belowground beetles. Regions
with high altitudinal ranges can promote diversification processes
through isolation and segregation along altitudinal gradients in
environmental conditions (Jetz et al. 2004; Rahbek et al. 2007; see also Casale 2009). Moreover, topographically highly variable regions allow species to effectively compensate climatic shifts (Hewitt 1999)
and not surprisingly, the highest belowground diversity of carabids
was found in mountainous regions where probably the southern refugia of
many taxa during the last ice age were located (Hewitt 1999; Casazza et al. 2008; Drees et al. 2010).
The latitudinal pattern with a steep decrease in richness towards
northern Europe, combined with relatively low effects of climate
variables, yields further information regarding historical impacts. Due
to their very specific habitat requirements and morphological
adaptations, carabid beetles of belowground environments are strongly
limited in their dispersal (Lamoreux 2004; Assmann et al. 2010).
The lack of belowground species in central and northern Europe,
despite suitable habitats, might be attributed to extinctions during
Pleistocene glaciations and the inability of range-restricted taxa to
re-colonize these regions (see also Schuldt and Assmann 2009).
For many range-restricted and even for widespread vascular plants,
effects of dispersal limitation on the current distribution across
Europe have been suggested (Svenning and Skov 2007; Svenning et al. 2008).
A strong correlation between richness patterns of belowground carabids
and vascular plants might indicate a similar historical signal
prevailing in the distribution patterns of both taxa (cf. Hewitt 1999).
Concerning the distribution of hotspots of overall troglobiont diversity in Europe, Culver et al. (2006)
found weak support for an influence of Pleistocene glaciations.
Similarly, belowground carabids are also missing south of the former
boundary of the Pleistocene ice sheet. However, the coarse-scale
distribution of belowground carabid beetle diversity seems to largely
conform to patterns postulated by Holdhaus (1954),
who hypothesized that the occurrence of terrestrial cave fauna in
Europe has been influenced by the spatial extent of permafrost soil,
stretching much farther south than the ice sheet. According to his
studies, the northern limit of these taxa runs along a line (the
“Holdhaus-line”) from the southern part of the Alps eastwards to the
Carpathians (Holdhaus 1954; Drees et al. 2010). Concordance between the distribution of several groups of blind carabids and the theory of Holdhaus has also been found by Drees et al. (2010).
Further re-examination on a more detailed scale will be needed to
accurately evaluate these findings in light of the numerous new records
of subterranean taxa from the last decades. While some species are
considered to have survived in isolated refuges north of the
Holdhaus-line (Holdhaus 1954), further deviations from the general pattern might be explained by postglacial range expansions (Drees et al. 2010). In contrast, an Anillus species recorded in park locations of Belgium (Desender 1986) and Germany (Malzacher 2000)
was probably introduced with soil from the root system of trees
imported from southern Europe. The survival of this species shows that
suitable habitats also exist now in northern regions of Europe and can
be seen as further evidence for strong effects of dispersal limitation
on re-colonization processes in the western Palaearctic (Drees et al. 2010).
As mentioned above, the influence of dispersal
limitation might also become evident from the fact that current climate
accounted for much smaller amounts of explained variation than elevation
range in both single regressions as well as in regression modelling.
Species with well-developed dispersal abilities are assumed to have
tracked post-Pleistocene climate changes to a certain degree, and high
co-variation between species richness of many taxa and climatic
variables support this view (reviewed by Hawkins et al. 2003).
Within the highly diverse carabid beetles, the same is true for the
richness of more mobile, widespread species, which is strongly related
to climatic variables and much less to elevation range (Schuldt and Assmann 2009).
In contrast, more range-restricted endemic species show the opposite
pattern, with a strong impact of topographic variability and low
influence of current climate pointing to prevailing effects of
historical processes on distribution patterns (Schuldt and Assmann 2009).
Our results for belowground beetles as part of the range-restricted
carabids strongly support these findings and thus provide further
insight into potential mechanisms underlying spatial distributions of
diversity. They show that the significance of historical processes in
explaining contemporary richness distributions might increase as
dispersal abilities of the species decrease. In this respect,
belowground carabids have a strong impact on overall patterns of
range-restricted (endemic) species. A larger influence of climate on
these overall patterns of endemics (Schuldt and Assmann 2009)
compared to belowground diversity, even though still secondary to
effects of elevation range, indicates that postglacial range expansions
are easier in above- than in the often spatially isolated belowground
habitats (Porter 2007).
At least at the coarse scale of our analysis, we did not find evidence for the assumptions of Culver et al. (2006)
that centres of highest belowground diversity might be located in
regions of long-term high aboveground productivity. Current and past
climate are correlated (Araújo et al. 2008) and AET as a measure of productivity (Hawkins et al. 2003)
was not related to richness patterns of belowground carabids in our
study. Rather, an influence of variables representing ambient energy
input (temperature, PET) and the potential effects related to
topographical variability suggest that in the western Palaearctic
highest richness of these taxa is determined by historical/evolutionary
processes and a general long-term stability of environmental conditions
(temperature) which supported survival and, especially regarding the
strong signal of history, promoted diversification processes in
belowground habitats (e.g., through isolation from other similar
habitat patches or other phenomena relevant for evolutionary processes; Casale and Vigna Taglianti 2005).