


(C) 2011 Andrea Matern. This is an open access article distributed under the terms of the Creative Commons Attribution License, which permits unrestricted use, distribution, and reproduction in any medium, provided the original author and source are credited.
For reference, use of the paginated PDF or printed version of this article is recommended.
Only very few cases have documented that an increase in connectivity after a period of fragmentation in ecological time has had an effect on the distribution, genetic structure and morphology of stenotopic species. In this study we present an example of clinal variability in a woodland ground beetle as a result of changes in the connectivity of a landscape during the last two centuries. The study area hosts both the nominate form Carabus violaceus s. str. and the subspecies Carabus violaceus purpurascens, which is ranked as a distinct species by some authors. We studied 12 Carabus violaceus populations from a 30 km transect of ancient and recent forests in north-western Germany. We analyzed three polymorphic enzyme loci, classified the elytron sculpture and measured the shape of the aedeagus tip of the specimens. Carabus violaceus showed secondary gradients both in allozyme markers and morphometric characters in our study area. A genetic differentiation of 16% between the populations is high but lies within the range of intraspecific variability in habitat specialists of the genus Carabus. Populations had no significant deficit of heterozygotes. We found many hybrid populations in terms of morphological properties. This study highlights the conservation value of ancient woodland and the consequences of landscape connectivity and defragmentation on the genetic setting of a ground beetle. Moreover, it shows that differences in the external shape of male genitalia do not prevent gene flow within the genus Carabus. Thus, the establishment of species status should not exclusively be based on this property.
fragmentation, afforestation, allozymes, morphometrics, Carabus violaceus purpurascens, hybridization, hybrid zone
The history of a landscape has a tremendous effect on
both the species composition of communities and assemblages on the one
hand and the genetic variability of species on the other. This is
especially true for woodlands, which have become highly fragmented
since the Middle Ages in large areas of north-western Europe including
Britain, southern Scandinavia, Belgium, the Netherlands and the
lowlands of northern Germany (
At the genetic level some studies have shown a strong
differentiation between remnants of stenotopic woodland species in
ancient woodlands that were at least in former times isolated from one
another (e.g.
In this study we present an example of clinal variability
as the result of an increase in the connectivity of a landscape during
the last two centuries. We selected a network of woodlands in
north-western Germany that stretches between the only two ancient
woodland remnants in the region, and studied the genetic variability
and differentiation of the woodland specialist Carabus violaceus
Linné 1758. Due to its flightlessness, this ground beetle has a low
power of dispersal. We used two sets of markers for the analysis,
morphometric characters and allozymes, in order to determine typical
features of the source populations and their geographic distribution
within the contact zone. The results are of increased significance, as
the study area hosts not only the nominate form but also Carabus violaceus purpurascens Fabricius, 1787, which is ranked as a distinct species by some authors (cf.
The study area is located northwest of Osnabrück in the morainic hill country between the convent of Börstel and Bramsche (Fig. 1). About 200 years ago the region had only two remnants of woodlands according to the geodesic survey of north-western Germany (
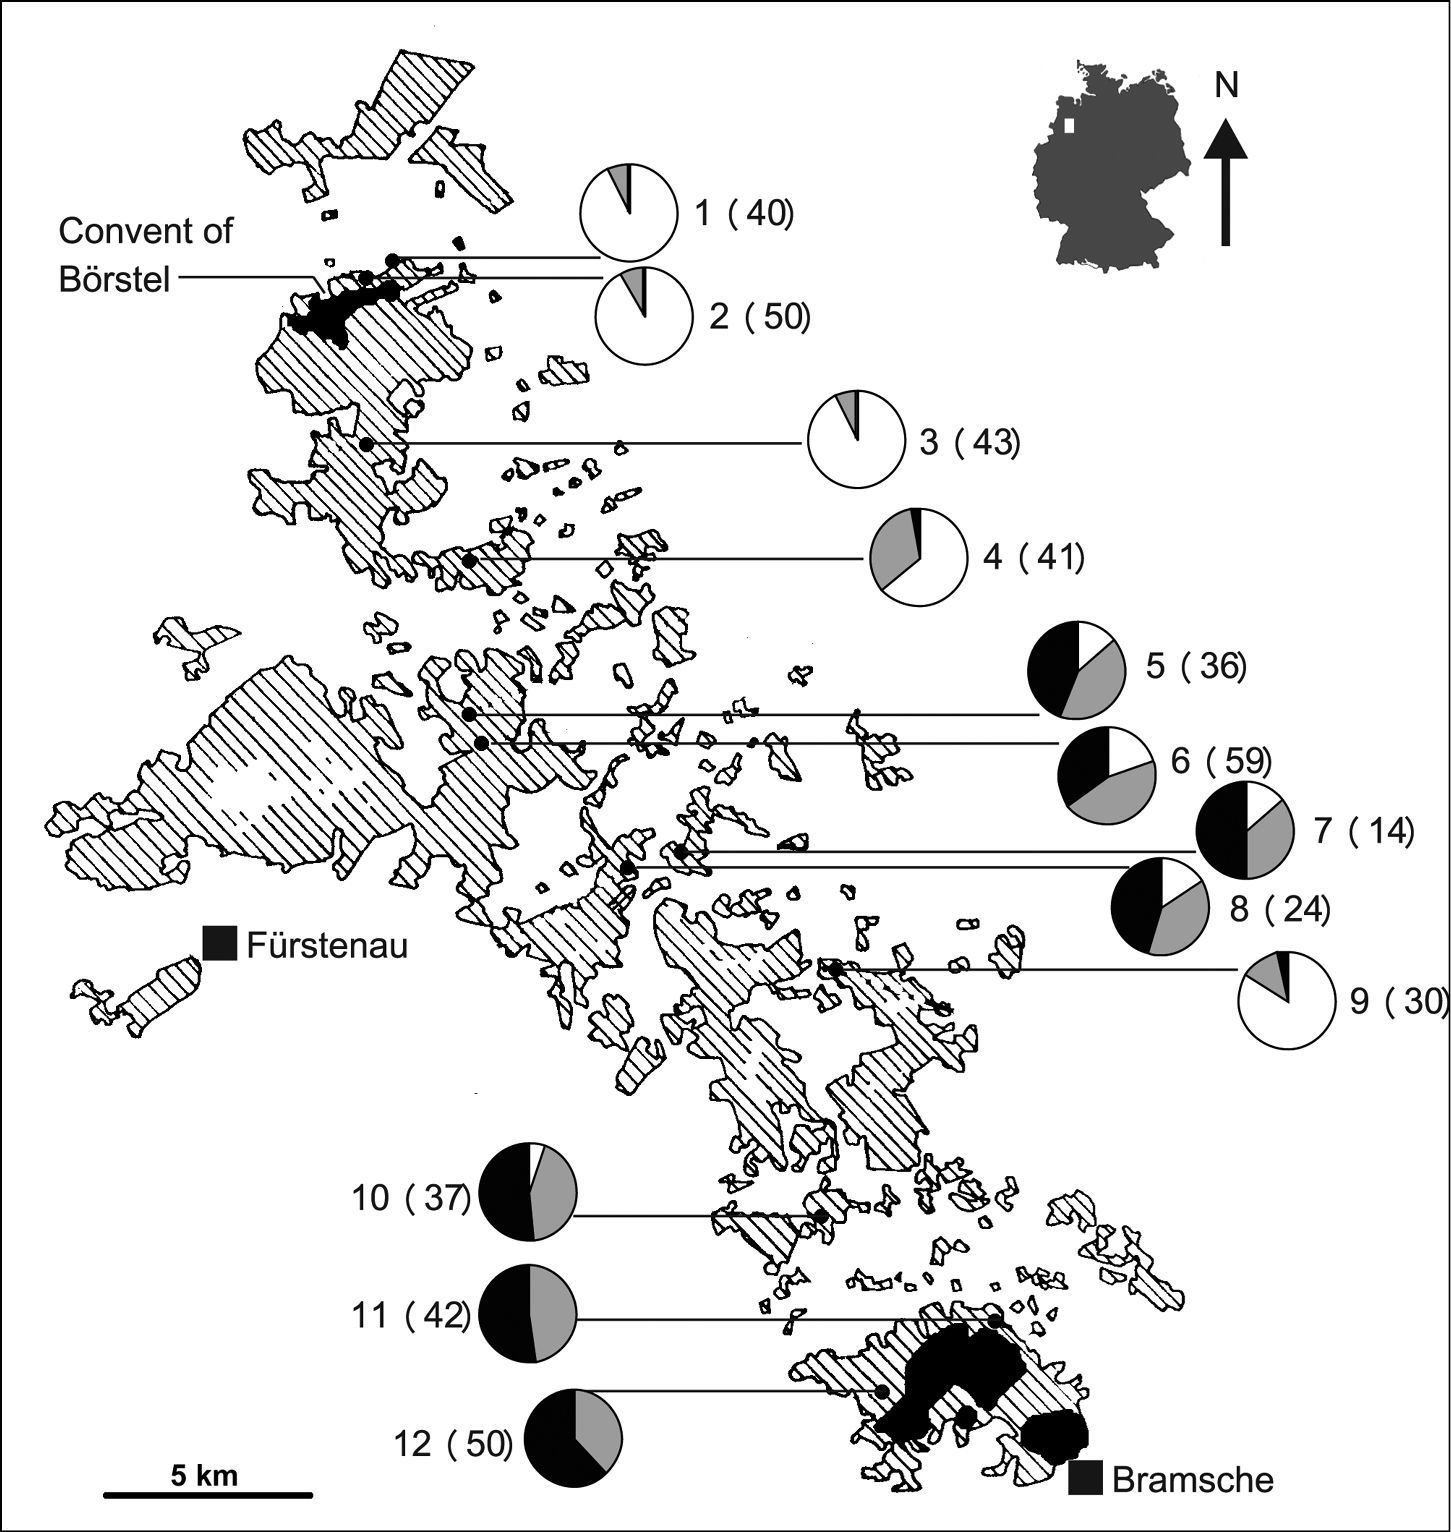
Carabus violaceus
populations studied and proportion of specimens with different elytron
sculptures (pie charts). White sections indicate the frequencies of
smooth elytra, black sections indicate the frequencies of more than
three striae per elytron, and grey sections indicate the frequencies of
intermediate phenotypes, i.e. class „1“. Numbers next to the pie
charts indicate population number followed by sample size in brackets.
The location of the study area is indicated as a white square on the map
of Germany. Woodlands in the study region northwest of the town of
Bramsche according to TK 50 3512 Bramsche (
Carabus violaceus
is a flightless woodland species which, in north-western Germany, is
more frequently recorded from ancient than from recent woodlands and
which is sometimes found in open habitats adjacent to woodlands (
Carabus violaceus
is an extensive, manifold Euro-Siberian species complex with numerous
forms that display slight morphological differences, for example with
regards to elytral sculpture, colour and body proportions, and some of
which are of doubtful status.
Carabus violaceus purpurascens and the nominate form of Carabus violaceus exhibit hybrid populations in north-western Germany (
The abdomina of Carabus violaceus
(without guts and pygidial glands) were homogenized in 600µl 0.15M
Tris-Citrate buffer (pH 7.8, 30% Sucrose, 1% Triton-X-100). After
centrifugation, the homogenates were applied to vertical polyacrylamide
slab gels and electrophoresis was run at 3°C. Both the mixture of the
polyacrylamide slab gels and the staining was performed according to
Allele frequencies, observed heterozygosity (HO) and mean gene diversity (HE) (
Data were investigated for the occurrence of clinal
variation by spatial autocorrelation analysis implemented in SGS ver.
1.0 d (Spatial Genetics Software,
After material had been taken for allozyme analysis, the animals were placed in Scheerpeltz solution (70% ethanol, 5–10% acetic acid, 15–20% aqua dest.). Male genitalia were prepared and mounted on cards. The remains of the exoskeletons were pinned to dry and deposited in the entomological collection of Thorsten Assmann, Bleckede (to be donated to the Zoological State Collection, Munich).
Two morphological properties that are relevant for taxonomic distinction between both forms of Carabus violaceus were analyzed. Since measurements of the aedeagus tips provide suitable characteristics to distinguish Carabus violaceus s. str. and Carabus violaceus purpurascens (
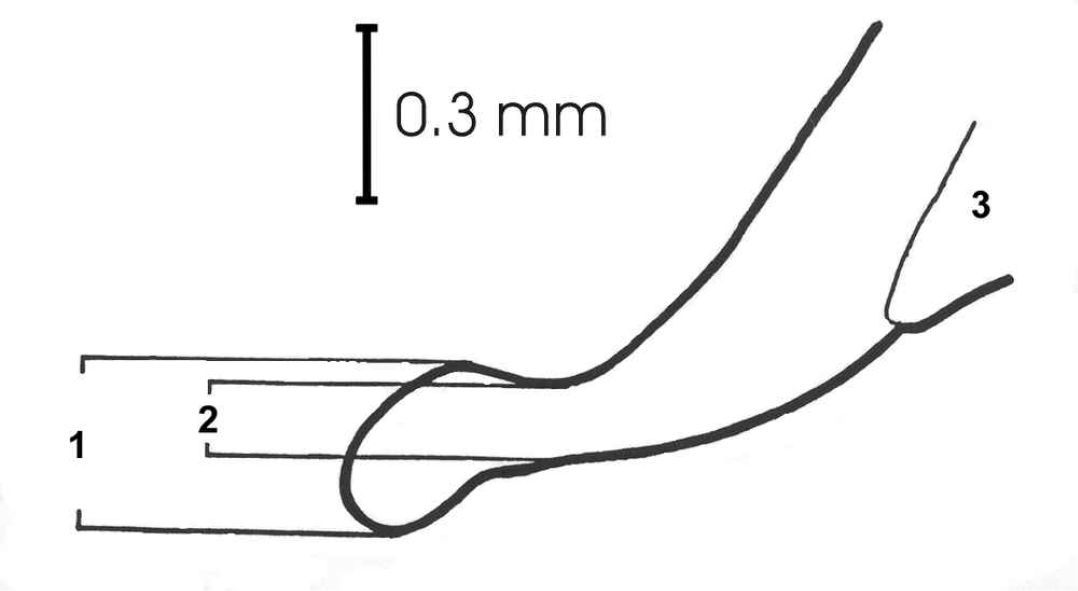
Aedeagus tip of Carabus violaceus. 1 Maximum aedeagus width (AedMax), 2 minimum aedeagus width (AedMin), and 3 preputial field.
As a second morphological character, we used elytron sculpture to classify individuals into the following categories: Class “0” for animals with typically smooth elytra as in the nominate form of Carabus violaceus; class “1” for individuals with three striae per elytron; and class “2” for individuals with more than three striae per elytron – as in typical specimens of Carabus violaceus purpurascens.
Results Allozyme analysisA total of 21 alleles were scored at three loci across the 12 populations studied. The number of alleles detected at each locus ranged from five (MPI) to nine (GPI). Allele frequencies, expected and observed heterozygosities and FIS values are shown in Table 1. No significant deviations from Hardy-Weinberg equilibrium were observed for any of the populations or loci after correcting for multiple tests (nominal level of p = 0.05). There seems to be a tendency of populations to display a positive FIS, i.e. a deficit of heterozygotes. However, after correction for multiple testing by Fstat (nominal level of p = 0.05, 720 randomizations), no significant deficit or excess of heterozygotes were found. No significant linkage disequilibrium was found, thus the studied loci can be interpreted as independent markers.
The overall FST value was 0.160 and ranged from 0.127 (GPI) to 0.201 (EST-X). Pairwise population differentiation in FST between the 78 pairs in our study ranged between 0.011 and 0.501, with a significant differentiation for 54 population pairs after standard Bonferroni corrections (Table 2).
Spatial genetic structure analysis revealed gradients in allele frequencies in the EST-X locus, in the MPI locus, and in the whole sample (Fig. 3, Table 3).
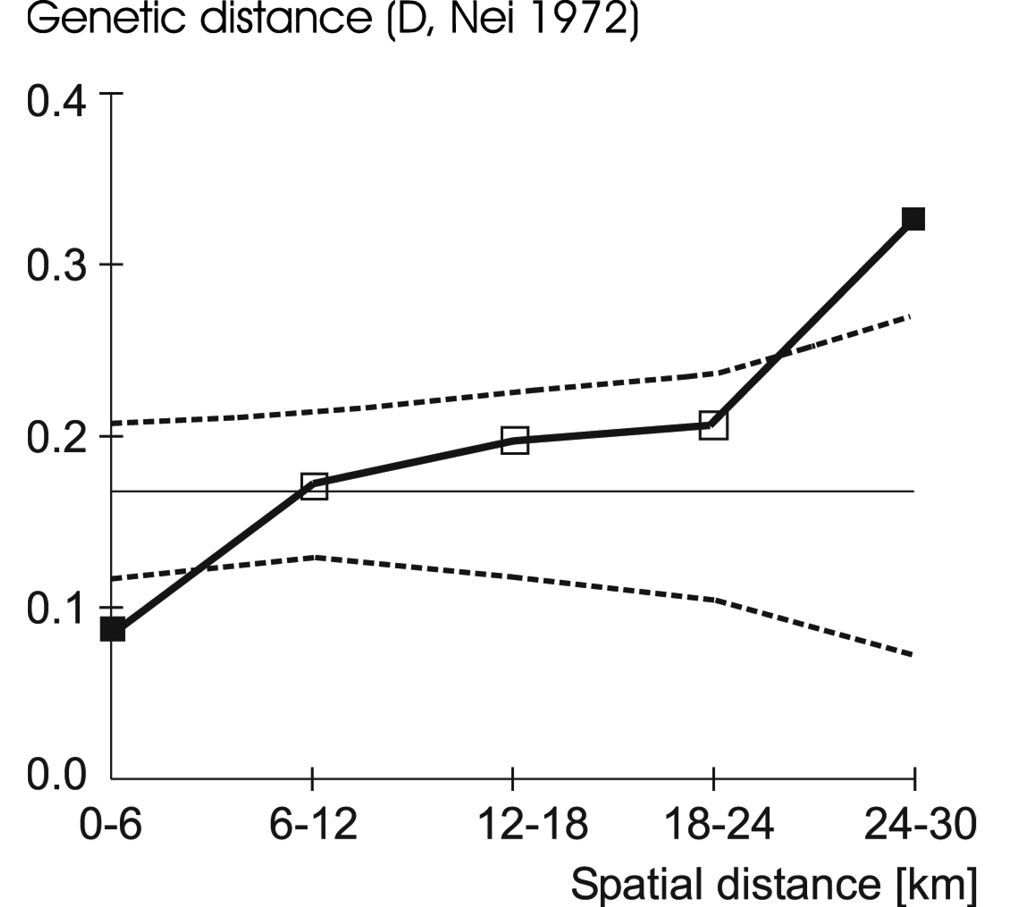
Correlogram showing the result of spatial autocorrelation analysis at three allozyme loci. Genetic distances D (
The vast majority of beetles in the northernmost populations 1 to 4 and population 9 showed the typical smooth elytra of the nominate form, while more than half of the beetles in each of the three southernmost populations (10 – 12) showed the elytron sculpture typical of Carabus violaceus purpurascens (Fig. 1). No specimens of Carabus violaceus purpurascens were found in the very north and no specimens of Carabus violaceus violaceus in the very south. The northernmost individual classified as Carabus violaceus pupurascens according to elytron sculpture is one specimen found in population 4, while the southernmost individual classified as Carabus violaceus violaceus is one specimen from population 10. All populations contained varying amounts of intermediate individuals of class “1” and, with the exception of population 9, changes in the proportions of different elytron classes are more or less gradual between the ancient woodlands.
Morphometric analysis of the aedeagus tipBoth the maximum width and the ratio of maximum width to minimum width show significant differences among population medians (AedMax: H(11, N = 220) = 71.157 p < 0.001; AedMax/AedMin: H(11, N = 219) = 22.737 p = 0.019). The pattern of AedMax is very similar to that of the elytron properties. The maximum width of the genital tip is generally highest in populations adjacent to the northern ancient woodland Börsteler Wald, which is characteristic of Carabus violaceus violaceus, and smallest in one of the populations close to the southern ancient woodland Gehn, which is characteristic of Carabus violaceus purpurascens. Several population comparisons between these two groups display significant differences (Fig. 4). However, the highest and lowest medians of AedMax are not found in the populations directly next to the ancient woodlands, but in populations 4 and 10, respectively, each of which had one specimen with elytron sculpture belonging to the respective other form. Again, we find intermediate values in the forests between the northernmost and southernmost ancient forests, but the overlap of ranges and medians with either populations to the north and to the south is quite high. While the median of AedMax in population 9 is strikingly similar to the medians in the northernmost populations, the median of AedMax/AedMin of population 9 is significantly different from otherwise very similar population 1 (p < 0.05) as AedMin is wider in this population. No other significant difference between populations was found concerning AedMax/AedMin.
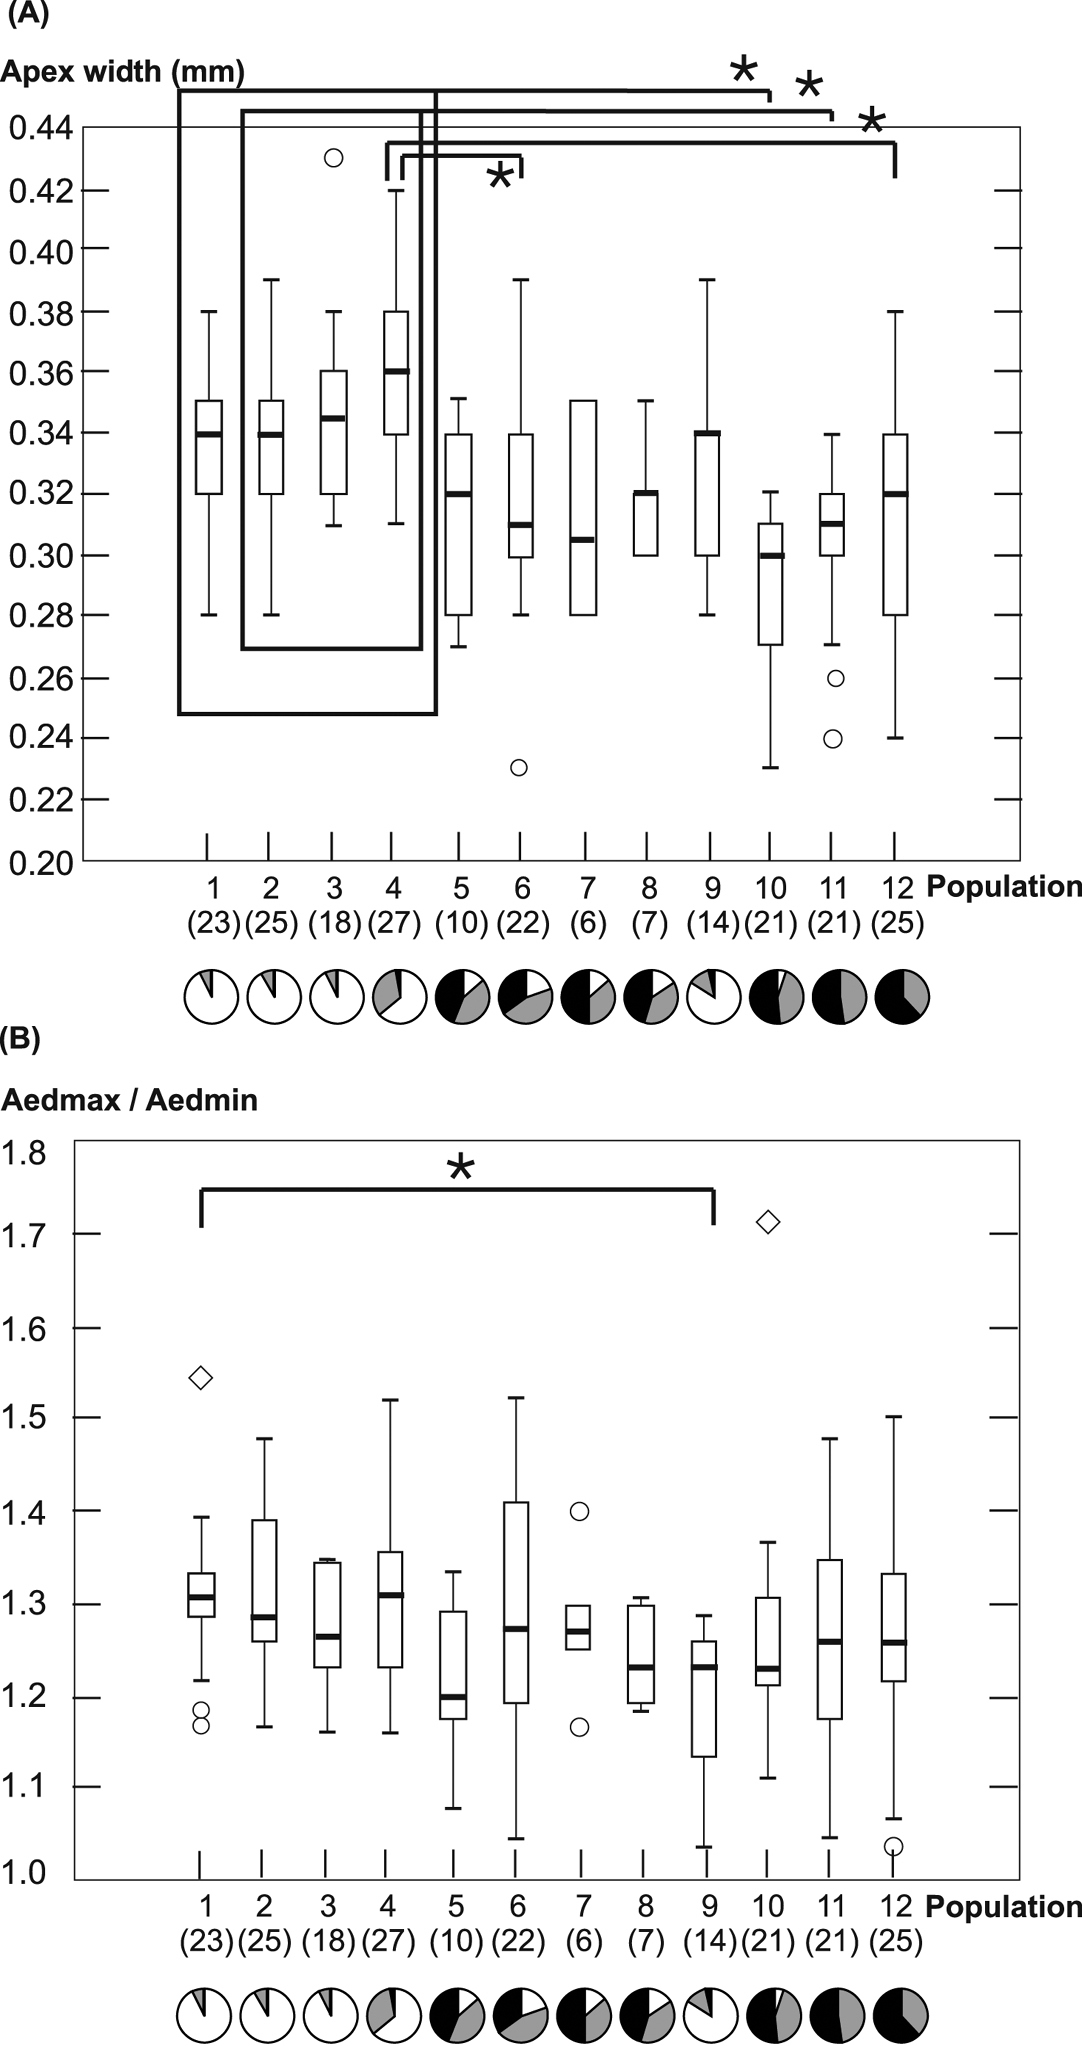
Maximum width of the aedeagus tip A and the quotient of maximum and minimum width of the aedeagus tip B are plotted for each population. Boxes display 25–75%- quartiles and bars indicate medians. Whiskers show the total range of values without outliers. Outliers are indicated as circles and extreme outliers as diamonds. Numbers of measured individuals per population are shown in brackets. Pie charts show frequencies of elytral sculpture classes “0” (white), “1” (grey), and “2” (black) in each population. Significant differences between populations are indicated by the lines marked with asterisks.
Carabus violaceus
shows clear gradients both in allozyme markers and morphometric
characters in our study area. Clinal variability can be caused by
adaptation to geographically changing environmental conditions and by
secondary contacts. In the first case, selection is the driving force
to create specific patterns of genetic differentiation (e.g.
The gradients found in Carabus violaceus
stretch across an area of recent woodlands, which developed during the
last two centuries. Only the outer woodlands are ancient and had the
potential to host the woodland restricted beetle during the Middle Ages
and early modern times. It is likely that Carabus violaceus
survived the period of woodland devastation in the ancient woodlands
Börsteler Wald and Gehn. Final confirmation that both these areas hosted
the source populations for the northern and southern set of characters
is still needed. The nearest other potential refuges (ancient woodlands)
that are inhabited by Carabus violaceus are located several kilometres south and southeast of Bramsche (e.g. Wiehengebirge,
Numerous studies have dealt with habitat
fragmentation at different levels from populations to whole communities.
In general, habitat fragmentation has led to genetic differentiation
and extinction processes at the population level and is discussed as one
of the driving forces for the loss of species worldwide (
Our study provides a case of colonization as a result
of increased connectivity by means of hedges and afforestation – even
though this may not have been the major aim of anthropogenic landscape
changes. This is an encouraging example for nature conservation, which
generally aims to purposefully reconnect fragmented landscapes. The
gradients detected for Carabus violaceus
cover a distance of approximately 30 kilometres, which is similar to
the geographic distances between the postulated source populations of Carabus auronitens in the Westphalian Lowlands, NW-Germany, as revealed by both allozymes and microsatellites (
Elytral sculpture, aedeagus tips and allozymes show that strongly differentiated populations of Carabus violaceus
survived forest destruction in ancient woodlands within (or close to)
the northern and southern edge of the study range. Our results suggest
that Carabus violaceus s. str. survived in the north, while Carabus violaceus purpurascens
survived in the south of the study area. These refuges correspond to
the overall geographic distribution of the two subspecies (
Elytral sculpture is especially well suited for an
unambiguous distinction between both forms, whereas the width of the
aedeagus shows significantly differentiated groups, but is a more or
less continuously or clinally varying property in the populations. We
found many hybrid populations with regards to both properties. Also
Identifying typical or exclusive alleles for either Carabus violaceus
form is difficult, as the studied loci generally show clinal variation
and as many alleles can be found in populations 1 to 4 as in
populations 10 to 12. However, it is likely that the northern refuge
population was monomorphic for MDH allele “3”, while the Est-X allele
“6” probably originated from a southern population (Table 1).
The overall FST value of 0.160 is considerable and shows a fairly
high genetic differentiation between the populations in comparison to
other organisms studied earlier in this respect, especially with
regards to the small geographic scale of the study area (
Diversity of allelic variation. N = gene number investigated per sample and per locus; HO = observed heterozygosity; HE = expected heterozygosity; FIS = inbreeding coefficient according to
| Alleles | Populations | |||||||||||
|---|---|---|---|---|---|---|---|---|---|---|---|---|
| 1 | 2 | 3 | 4 | 5 | 6 | 7 | 8 | 9 | 10 | 11 | 12 | |
| EST-X | ||||||||||||
| N | 70 | 64 | 68 | 46 | 54 | 92 | 22 | 38 | 58 | 48 | 52 | 6 |
| 1 | 0 | 0 | 0.015 | 0.022 | 0.259 | 0.413 | 0.091 | 0.211 | 0.052 | 0.042 | 0.173 | 0 |
| 2 | 0.714 | 0.875 | 0.824 | 0.783 | 0.574 | 0.337 | 0.182 | 0.342 | 0.707 | 0.146 | 0.154 | 0.333 |
| 3 | 0.229 | 0 | 0.015 | 0.043 | 0.074 | 0 | 0 | 0 | 0 | 0 | 0 | 0 |
| 4 | 0.057 | 0.125 | 0.147 | 0.087 | 0.056 | 0.207 | 0.682 | 0.395 | 0.103 | 0.354 | 0.308 | 0.5 |
| 5 | 0 | 0 | 0 | 0 | 0 | 0.011 | 0 | 0 | 0.086 | 0.25 | 0 | 0 |
| 6 | 0 | 0 | 0 | 0.065 | 0.037 | 0.033 | 0.045 | 0.053 | 0.052 | 0.208 | 0.327 | 0.167 |
| 7 | 0 | 0 | 0 | 0 | 0 | 0 | 0 | 0 | 0 | 0 | 0.038 | 0 |
| HO | 0.257 | 0.25 | 0.265 | 0.348 | 0.37 | 0.609 | 0.545 | 0.684 | 0.448 | 0.5 | 0.462 | 0.333 |
| HE | 0.441 | 0.222 | 0.304 | 0.382 | 0.604 | 0.679 | 0.515 | 0.698 | 0.485 | 0.762 | 0.758 | 0.733 |
| FIS | 0.420 | -0.127 | 0.132 | 0.090 | 0.392 | 0.105 | -0.062 | 0.021 | 0.077 | 0.348 | 0.396 | 0.600 |
| GPI | ||||||||||||
| N | 76 | 96 | 86 | 80 | 72 | 114 | 28 | 48 | 56 | 70 | 84 | 100 |
| 1 | 0 | 0 | 0 | 0 | 0 | 0.009 | 0 | 0 | 0 | 0 | 0.024 | 0 |
| 2 | 0 | 0 | 0.012 | 0 | 0.028 | 0.018 | 0 | 0.083 | 0 | 0.043 | 0.06 | 0.07 |
| 3 | 0 | 0 | 0 | 0 | 0 | 0 | 0 | 0 | 0 | 0.071 | 0 | 0 |
| 4 | 0.263 | 0.135 | 0.093 | 0.225 | 0.347 | 0.377 | 0.536 | 0.208 | 0.304 | 0.257 | 0.417 | 0.42 |
| 5 | 0 | 0 | 0.058 | 0.05 | 0.097 | 0.096 | 0 | 0.063 | 0.071 | 0 | 0.012 | 0.04 |
| 6 | 0 | 0 | 0 | 0 | 0 | 0 | 0 | 0 | 0 | 0 | 0 | 0.01 |
| 7 | 0.697 | 0.813 | 0.767 | 0.65 | 0.25 | 0.254 | 0.179 | 0.25 | 0.196 | 0.414 | 0.286 | 0.21 |
| 8 | 0.013 | 0.01 | 0.047 | 0.075 | 0.278 | 0.246 | 0.286 | 0.396 | 0.357 | 0.214 | 0.202 | 0.25 |
| 9 | 0.026 | 0.042 | 0.023 | 0 | 0 | 0 | 0 | 0 | 0.071 | 0 | 0 | 0 |
| HO | 0.421 | 0.375 | 0.372 | 0.375 | 0.611 | 0.649 | 0.5 | 0.667 | 0.607 | 0.714 | 0.786 | 0.78 |
| HE | 0.449 | 0.323 | 0.401 | 0.525 | 0.74 | 0.729 | 0.622 | 0.742 | 0.745 | 0.72 | 0.708 | 0.718 |
| FIS | 0.064 | -0.163 | 0.072 | 0.289 | 0.176 | 0.111 | 0.202 | 0.104 | 0.188 | 0.008 | -0.111 | -0.088 |
| MDH | ||||||||||||
| N | 76 | 84 | 84 | 80 | 64 | 108 | 28 | 44 | 56 | 68 | 70 | 66 |
| 1 | 0 | 0 | 0 | 0 | 0.016 | 0 | 0 | 0 | 0.161 | 0.088 | 0 | 0.045 |
| 2 | 0 | 0 | 0 | 0 | 0.047 | 0.019 | 0.036 | 0.182 | 0.054 | 0 | 0.029 | 0.03 |
| 3 | 1 | 1 | 1 | 0.988 | 0.906 | 0.981 | 0.964 | 0.818 | 0.75 | 0.868 | 0.714 | 0.682 |
| 4 | 0 | 0 | 0 | 0 | 0 | 0 | 0 | 0 | 0.018 | 0.044 | 0.257 | 0.242 |
| 5 | 0 | 0 | 0 | 0.013 | 0.031 | 0 | 0 | 0 | 0.018 | 0 | 0 | 0 |
| HO | 0 | 0 | 0 | 0.025 | 0.188 | 0.037 | 0.071 | 0.364 | 0.429 | 0.206 | 0.371 | 0.576 |
| HE | 0 | 0 | 0 | 0.025 | 0.178 | 0.037 | 0.071 | 0.304 | 0.416 | 0.241 | 0.429 | 0.481 |
| FIS | NA | NA | NA | 0.000 | -0.054 | -0.010 | 0.000 | -0.200 | -0.032 | 0.148 | 0.136 | -0.202 |
| All loci | ||||||||||||
| Mean HO | 0.226 | 0.208 | 0.212 | 0.249 | 0.39 | 0.432 | 0.372 | 0.572 | 0.495 | 0.473 | 0.54 | 0.563 |
| HO SD | 0.212 | 0.191 | 0.192 | 0.195 | 0.212 | 0.342 | 0.262 | 0.18 | 0.098 | 0.255 | 0.218 | 0.224 |
| Mean HE | 0.297 | 0.182 | 0.235 | 0.311 | 0.507 | 0.482 | 0.403 | 0.582 | 0.549 | 0.574 | 0.632 | 0.644 |
| HE SD | 0.257 | 0.165 | 0.209 | 0.258 | 0.293 | 0.386 | 0.292 | 0.241 | 0.174 | 0.289 | 0.177 | 0.142 |
| FIS | 0.241 | -0.148 | 0.098 | 0.200 | 0.235 | 0.105 | 0.078 | 0.018 | 0.100 | 0.178 | 0.148 | 0.168 |
Significant genetic differentiation (FST) between population pairs after standard Bonferroni correction. * indicates a nominal level of p < 0.05; n.s., not significant.
| Pop2 | Pop3 | Pop4 | Pop5 | Pop6 | Pop7 | Pop8 | Pop9 | Pop10 | Pop11 | Pop12 | |
|---|---|---|---|---|---|---|---|---|---|---|---|
| Pop1 | n.s. | * | n.s. | * | * | * | * | * | * | * | * |
| Pop2 | n.s. | * | * | * | * | * | * | * | * | * | |
| Pop3 | n.s. | * | * | * | * | * | * | * | * | ||
| Pop4 | * | * | * | * | * | * | * | * | |||
| Pop5 | n.s. | * | n.s. | * | * | * | * | ||||
| Pop6 | n.s. | n.s. | * | * | * | * | |||||
| Pop7 | n.s. | * | * | * | n.s. | ||||||
| Pop8 | * | * | * | * | |||||||
| Pop9 | * | * | * | ||||||||
| Pop10 | * | n.s. | |||||||||
| Pop11 | n.s. |
Spatial autocorrelation analysis of genetic variation at three allozyme loci (multi- and single-locus analysis) in the Carabus violaceus populations studied. D values indicate the mean genetic distance observed of samples within each distance class. –, D significantly lower; +, D significantly greater than the mean genetic distance over all distance classes. ***p < 0.001; **p < 0.01; *p < 0.05; n.s., not significant.
| Locus | Distance class [km] | ||||
|---|---|---|---|---|---|
| 0–6 | 6–12 | 12–18 | 18–24 | 24–30 | |
| Pairs of data | 16 | 20 | 14 | 11 | 7 |
| all loci | 0.086 (- ***) | 0.171 (n.s.) | 0.196 (n.s.) | 0.206 (n.s.) | 0.326 (+ **) |
| EST-X | 0.236 (- *) | 0.411 (n.s.) | 0.536 (n.s.) | 0.657 (n.s.) | 0.982 (+ **) |
| GPI | 0.094 (- **) | 0.307 (n.s.) | 0.346 (n.s.) | 0.285 (n.s.) | 0.384 (n.s.) |
| MPI | 0.014 (- *) | 0.015 (n.s.) | 0.030 (n.s.) | 0.033 (n.s.) | 0.062 (+ **) |
The shape of the aedeagus tip is not only used for
taxonomic distinction between different carabids, but also for a
justification of species rank (
The existence of a hybrid zone without strong
selection pressure (since we found no deviations from Hardy-Weinberg
equilibrium after correcting for multiple tests) despite strong
differences in the shape of the aedeagus of both forms has consequences
for taxonomy within the genus Carabus:
differences in the male genitalia (especially those of the external
shape of the aedeagus tip) do not prevent excessive gene flow and should
thus not be used as a character to establish species’ status of forms
(cf.
The strong differentiation of the endophallus in some species of the subgenus Ohomopterus
demonstrates that (1) copulatory pieces can reduce cross-breeding and
(2) the fitness costs of interspecific matings are high in the given
species (e.g.
Numerous questions that are important for a better understanding of the investigated hybrid zone are still unanswered, e.g. if the contribution to gene flow into the hybrid zone is the same for both sexes or if the diffusion rate of markers differs. These and others can only be studied when further molecular, both mitochondrial and nuclear markers are analysed. mtDNA analysis, which is presently being conducted at our institute, may enable us to further estimate evolutionary divergence time between the two investigated subspecies with the help of phylogenetic analysis. The results of the present study reveal that Carabus violaceus has the potential to be an important model species in the fields of conservation genetics and evolutionary biology at the interface to systematics.
We thank Ingo Sponheuer for sampling some populations and laboratory work. Helpful comments on the manuscript provided by two anonymous reviewers are gratefully acknowledged.
Gel and staining recipes and electrophoresis conditions used in this study. (doi: 10.3897/zookeys.100.1546.app) File format: Adobe Acrobat (pdf).
Explanation note: The additional file contains gel, staining recipes and protocols for GPI, MPI and EST-X.
Copyright notice: This dataset is made available under the Open Database License (http://opendatacommons.org/licenses/odbl/1.0/). The Open Database License (ODbL) is a license agreement intended to allow users to freely share, modify, and use this Dataset while maintaining this same freedom for others, provided that the original source and author(s) are credited.