


(C) 2011 Jörg Spelda. This is an open access article distributed under the terms of the Creative Commons Attribution License 3.0 (CC-BY), which permits unrestricted use, distribution, and reproduction in any medium, provided the original author and source are credited.
For reference, use of the paginated PDF or printed version of this article is recommended.
We give a first account of our ongoing barcoding activities on Bavarian myriapods in the framework of the Barcoding Fauna Bavarica project and IBOL, the International Barcode of Life. Having analyzed 126 taxa (including 122 species) belonging to all major German chilopod and diplopod lineages, often using four or more specimens each, at the moment our species stock includes 82% of the diplopods and 65% of the chilopods found in Bavaria, southern Germany. The partial COI sequences allow correct identification of more than 95% of the current set of Bavarian species. Moreover, most of the myriapod orders and families appear as distinct clades in neighbour-joining trees, although the phylogenetic relationships between them are not always depicted correctly. We give examples of (1) high interspecific sequence variability among closely related species; (2) low interspecific variability in some chordeumatidan genera, indicating that recent speciations cannot be resolved with certainty using COI DNA barcodes; (3) high intraspecific variation in some genera, suggesting the existence of cryptic lineages; and (4) the possible polyphyly of some taxa, i.e. the chordeumatidan genus Ochogona. This shows that, in addition to species identification, our data may be useful in various ways in the context of species delimitations, taxonomic revisions and analyses of ongoing speciation processes.
Chilopoda, Diplopoda, COI barcoding, Bavaria, Germany
Molecular species identification based on sequence diversities in the Folmer segment of mitochondrial COI DNA has been under intense study for some years (
Among the Chilopoda and Diplopoda, the 146 species known from Bavaria cover 73% of the fauna of Germany. Hence, the first aim of our study is to establish a barcode reference library for Bavarian Myriapoda that will be expanded step by step (the dataset treated in this paper can be accessed in Barcode of Life Data Systems (BOLD;
In the present paper we give an overview of our ongoing barcoding activities, which so far cover 73% of all Bavarian Chilopoda and Diplopoda. In addition to conventional analysis of the actual dataset based on our BOLD data, we give examples of how our barcodes will contribute to taxonomic revisions and to analyses of past and ongoing speciation processes.
Material and methods SamplingTo cover the variability within species, numerous samples from locations inside and outside Bavaria have been included. Besides the centipedes and millipedes known to occur in Bavaria, species that might be found there in the future have also been included, as well as close relatives of the known Bavarian species (Fig. 1). Since the study arose from the ‘Barcoding Fauna Bavarica’ project, sampling was restricted to a few individuals per species. We have tried to include material from all four major Bavarian faunal regions as defined in
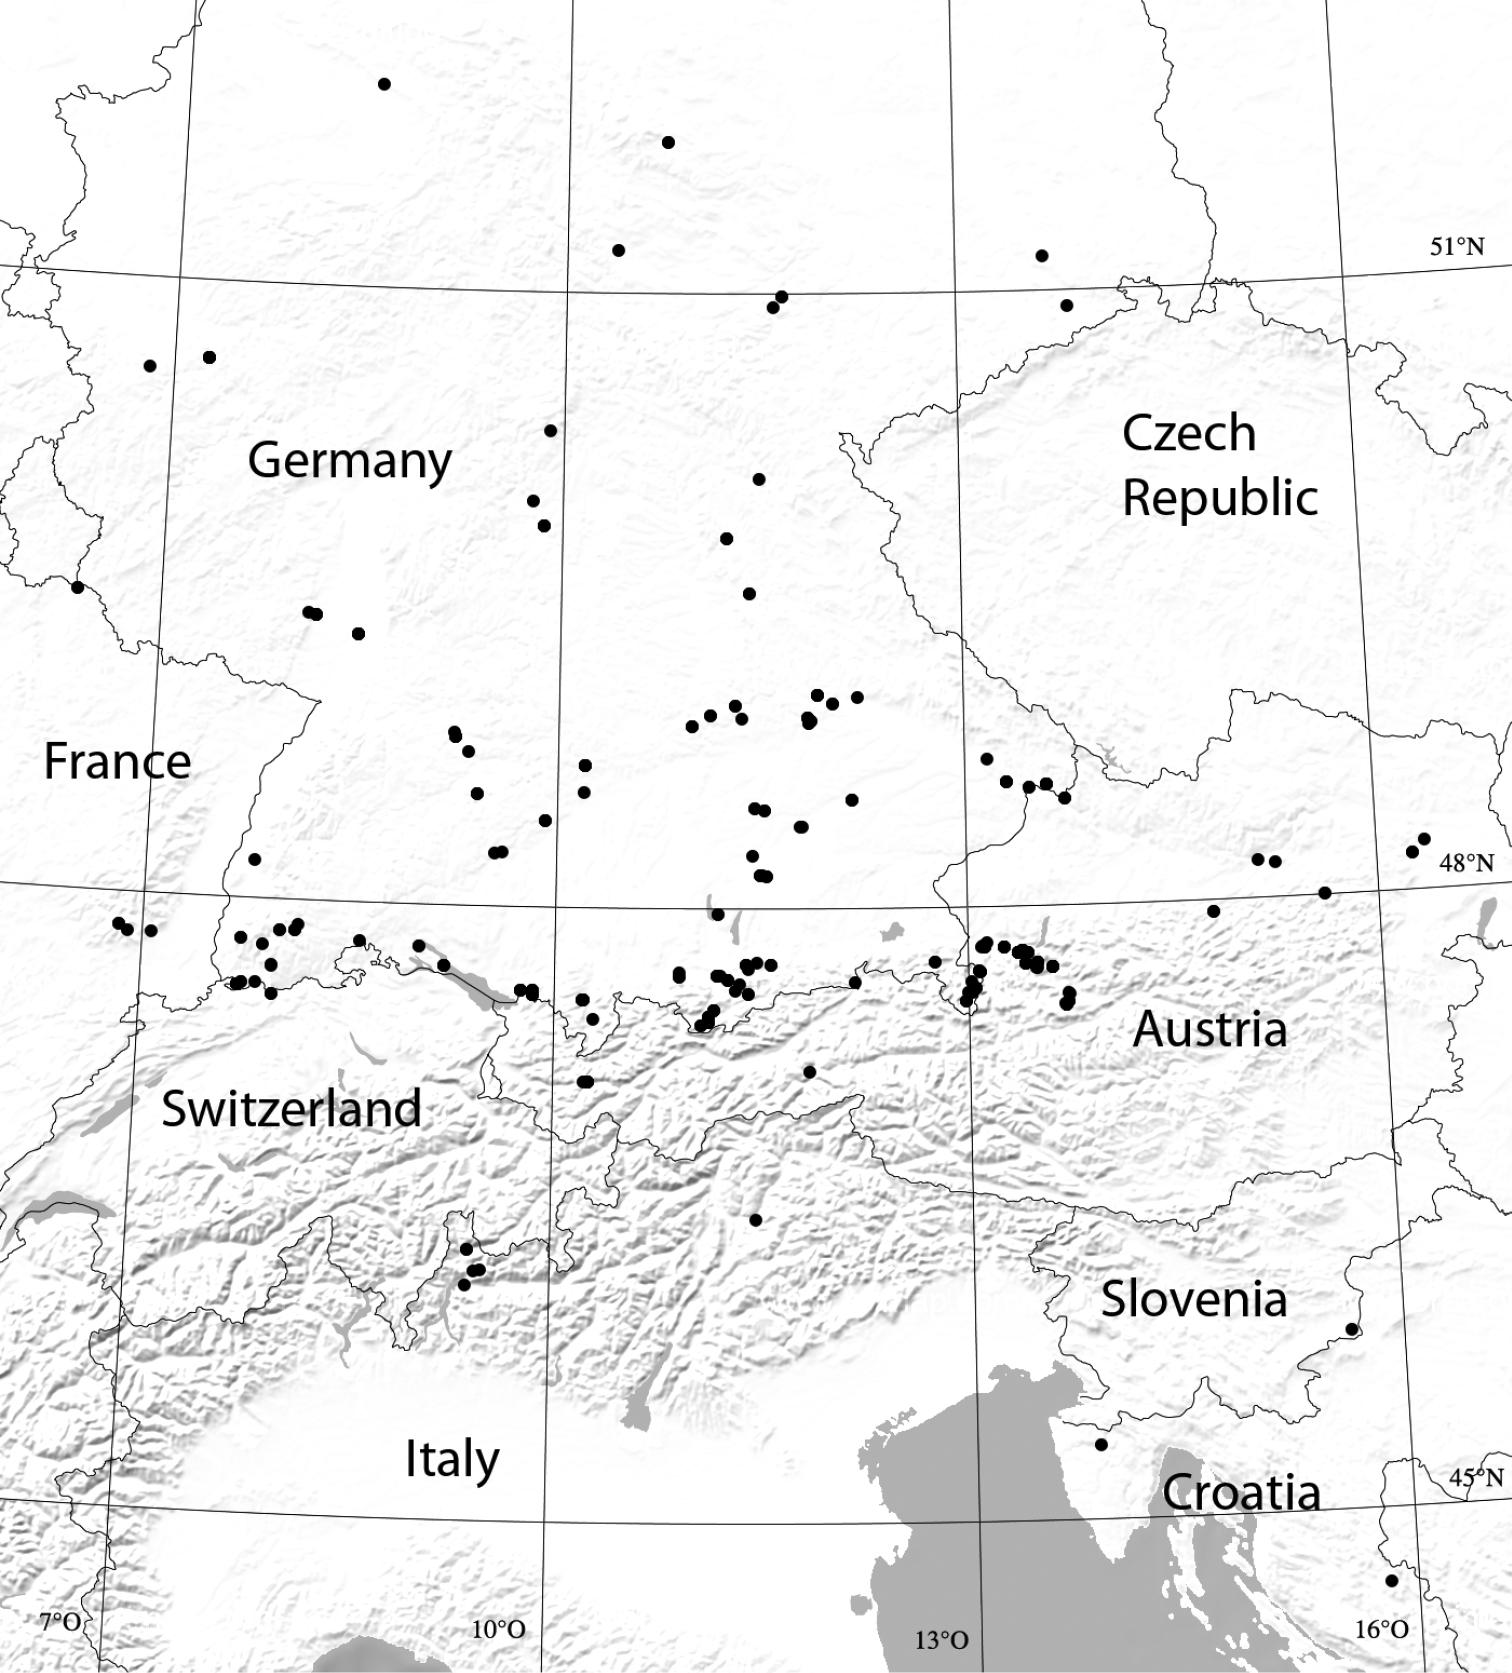
Map of sampled areas (dots). For checks of intraspecific variability of COI sequences, localities in Bavaria, but also elsewhere within the species’ areas of distribution, have been sampled and analyzed (sampling data from November 2008 to November 2010; a few specimens from northern Spain omitted).
Sequencing was carried out at the CCDB, using the standard protocols of IBOL (http://www.dnabarcoding.ca/pa/ge/research/protocols). For reasons of performance, so far only the C_LepFolF and C_LepFolR primers have been used for PCR and sequencing. Barcoded voucher specimens are stored at ZSM, and DNA extracts from the specimens at the CCDB and the ZSM’s DNA bank facility (http://www.zsm.mwn.de/dnabank/). Specimen data, images and DNA sequences will be available on BOLD. BOLD numbers are given for each specimen in the depicted NJ trees (Figs. 8–11). These allow the tracking of our sequences in BOLD and GenBank, respectively.
Sequencing failed for about 30% of the species. Sometimes whole genera (Trachysphaera, Ommatoiulus, Megaphyllum, Mycogona), and sometimes species-level taxa (Glomeris undulata s.l., Leptoiulus simplex-group) were reluctant to barcoding. In these cases we either obtained no barcodes, or less than a quarter of the specimens were successfully barcoded. Hence, barcoding success of single samples was somewhat unpredictable. It seems that minor differences in tissue composition and protocol determine whether or not a sample runs; e.g., in one particular plate all Megaphyllum and Ommatoiulus were amplified successfully, whereas they had failed before.
Data analysisResulting data for the myriapods treated here are taken from the respective tools included in BOLD, and calculated using the Kimura 2 Parameter (K2P) model. Sequences were imported into PAUP* (
At the moment our myriapod barcode library includes 320 specimens, 122 species, 56 genera and 24 families of Myriapoda (Fig. 2). All sequences were longer than 500 bp and thus fulfill the requirements for barcoding. The following analysis is based on this dataset (MYFBA), composed of a total of 126 taxa (122 species, three additional subspecies and one subspecies hybrid).

Some Bavarian myriapods for which barcodes are now available. A. Glomeris pustulata Latreille, 1804. B. Polydesmus helveticus Verhoeff, 1894. C. Cylindroiulus boleti (C. L. Koch, 1847). D. Unciger foetidus (C. L. Koch, 1838). E. Haasea flavescens (Latzel, 1884). F. Atractosoma meridionale Fanzago, 1876. G. Cryptops parisi Brölemann, 1920. H. Henia vesuviana (Newport, 1845). Photos: J. Spelda.
The mean sequence compositions in our sequences are G = 16.32%, C = 21.75%, A = 30.04% and T = 31.87% in Chilopoda, and G = 17.64%, C = 17.67%, A = 26.21% and T = 38.29% in Diplopoda. This shows a pronounced bias towards A and T, which is characteristic of arthropods.
In Chilopoda (Fig. 3) the lowest interspecific distance (K2P distance to nearest neighbour) was found between the species Lithobius borealis and Lithobius valesiacus (11.99%), and the maximum between Pachymerium ferrugineum and Strigamia crassipes (25.26%). The mean value of the interspecific distance for Chilopoda was 18.30%. Interspecific distances in Diplopoda (Fig. 4) ranged between 0 % in the subspecies of Craspedosoma rawlinsii (including the taxa alemannicum, alsaticum, transsilvanicum and the hybrid germanicum (= alemannicum X rawlinsii)) and 33.18 % between the neighbour pair Polyzonium germanicum and Geoglomeris subterranea which belong to different orders. The mean value of the interspecific distance for Diplopoda was 14.17%.
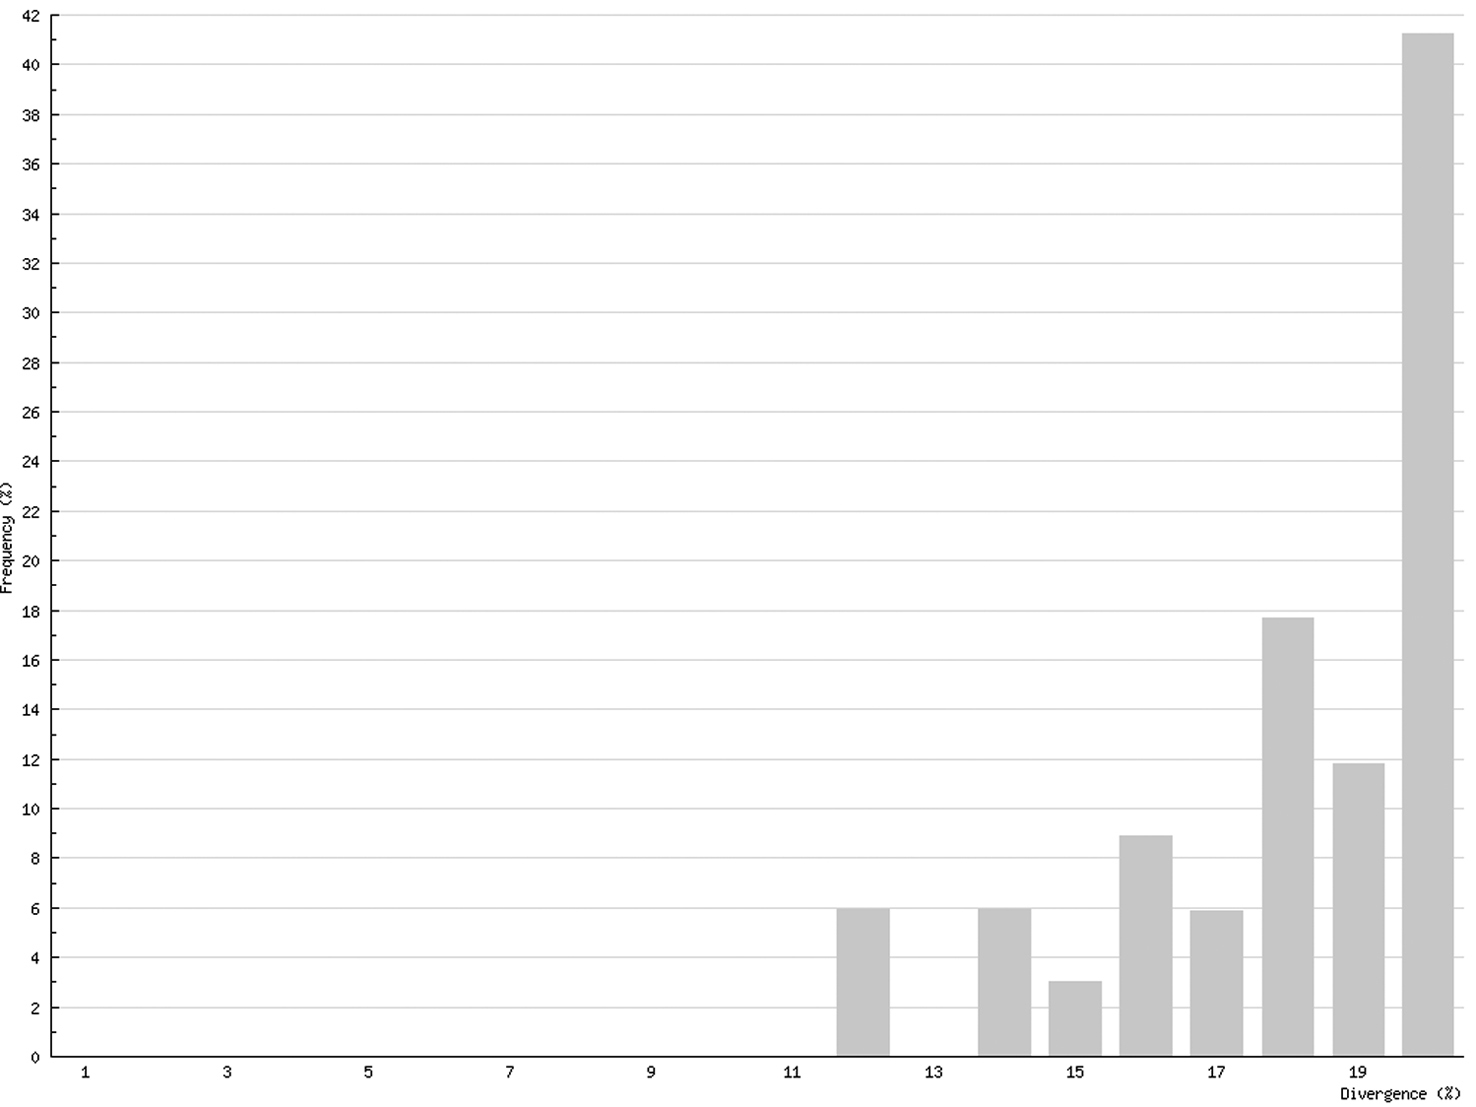
Interspecific COI variability (K2P): distance to nearest neighbour; Chilopoda
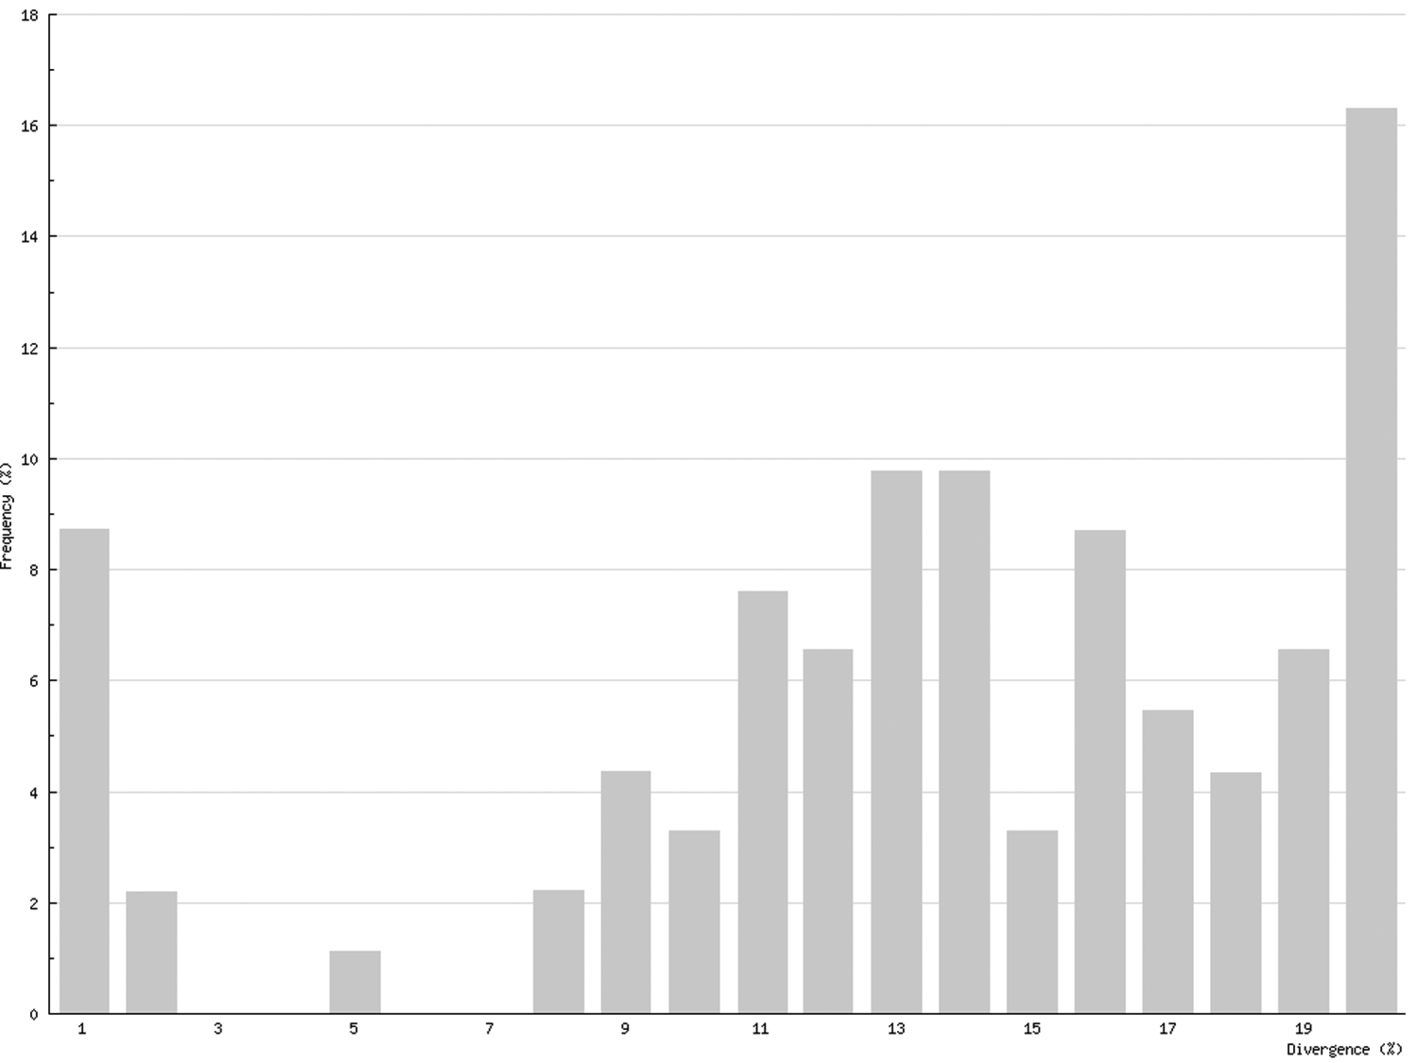
Interspecific COI variability (K2P): distance to nearest neighbour; Diplopoda
Intraspecific distances in Chilopoda (K2P maximum pairwise distance) ranged between 0%, for five species, and 21.55% for Lithobius microps, with a mean value for all studied chilopod species of 6.73% (Fig. 5). In Diplopoda, 0% was found for 19 species, and the maximum was 6.61 in Glomeridella bitaeniata, with a mean value of 0.82% for all studied diplopods (Fig. 6).
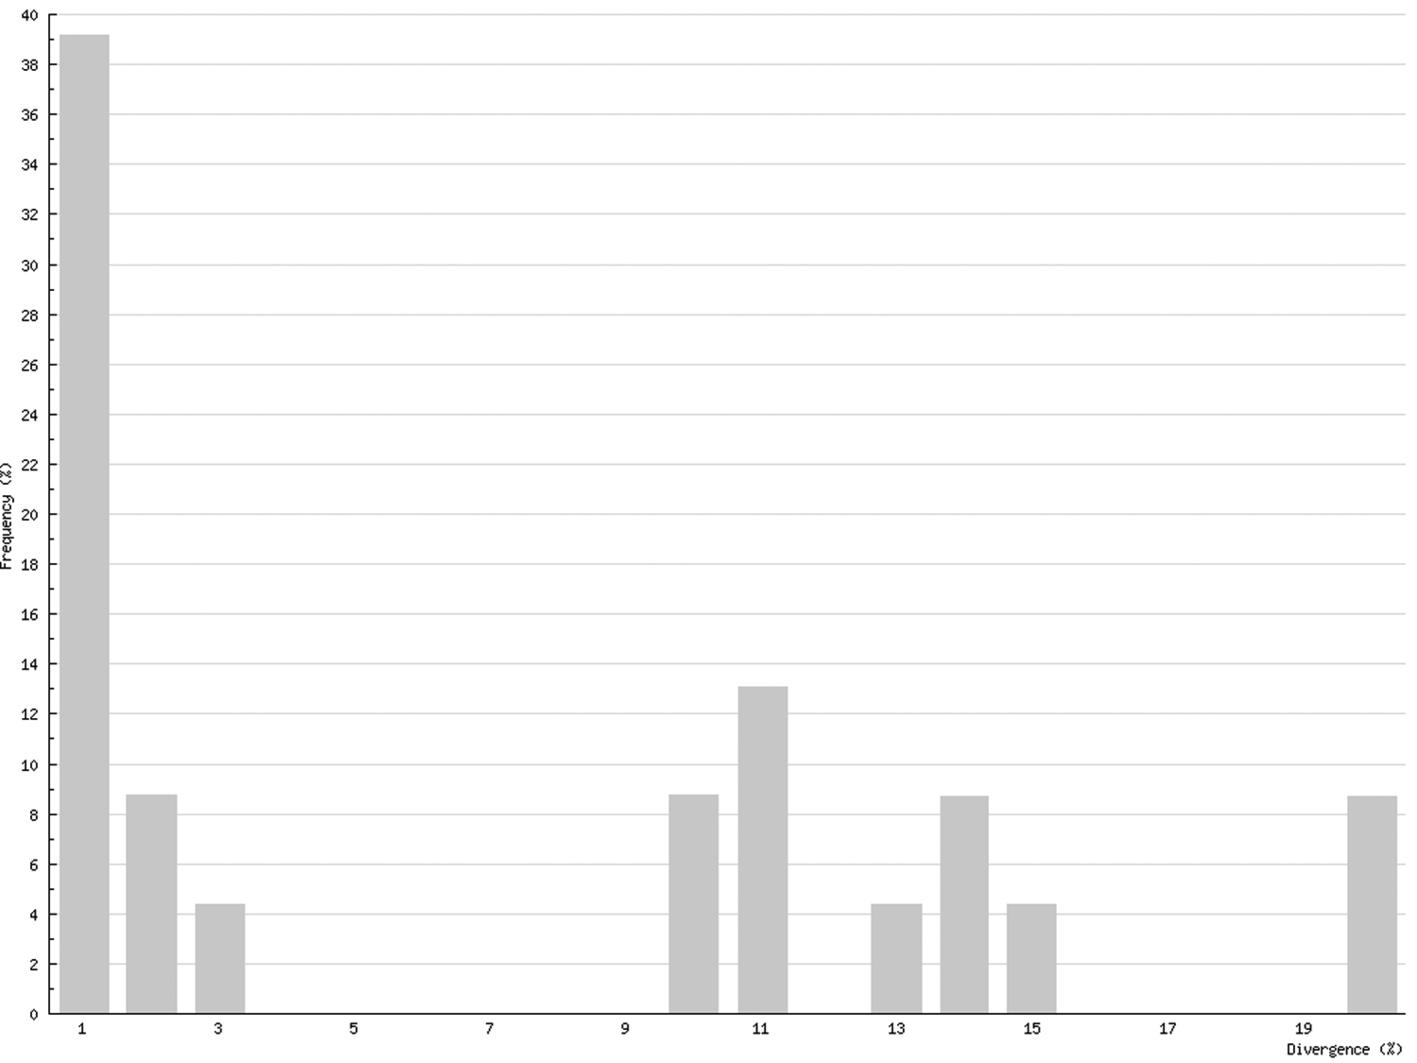
Intraspecific COI variability (K2P): maximum pairwise distances; Chilopoda
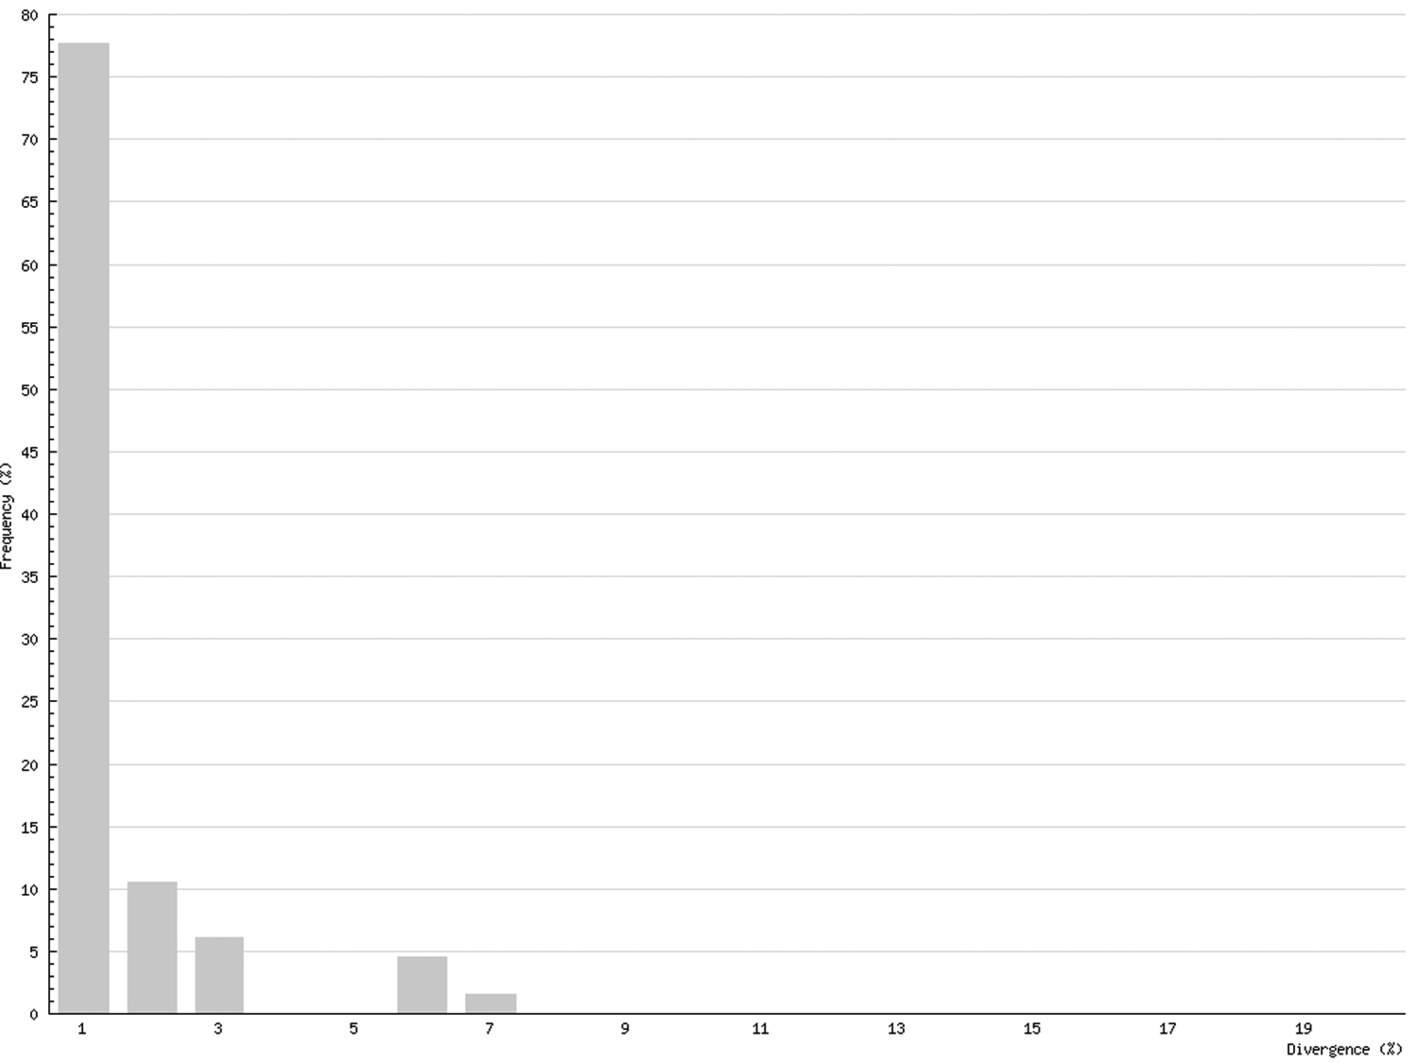
Intraspecific COI variability (K2P): maximum pairwise distances; Diplopoda
Analysis of our data resulted in the Neighbour-joining (NJ) trees shown in Figs 7–11. Especially in Diplopoda-Helminthomorpha, where species delimitation is comparatively easy due to the diversity of their species-specific secondary copulatory apparatus (gonopods), the results of classical (morphological) taxonomy correspond perfectly with the COI lineages in most cases of our dataset. In the following, we give examples to show how fruitful the combination of barcoding and classical taxonomy can be in myriapod research.
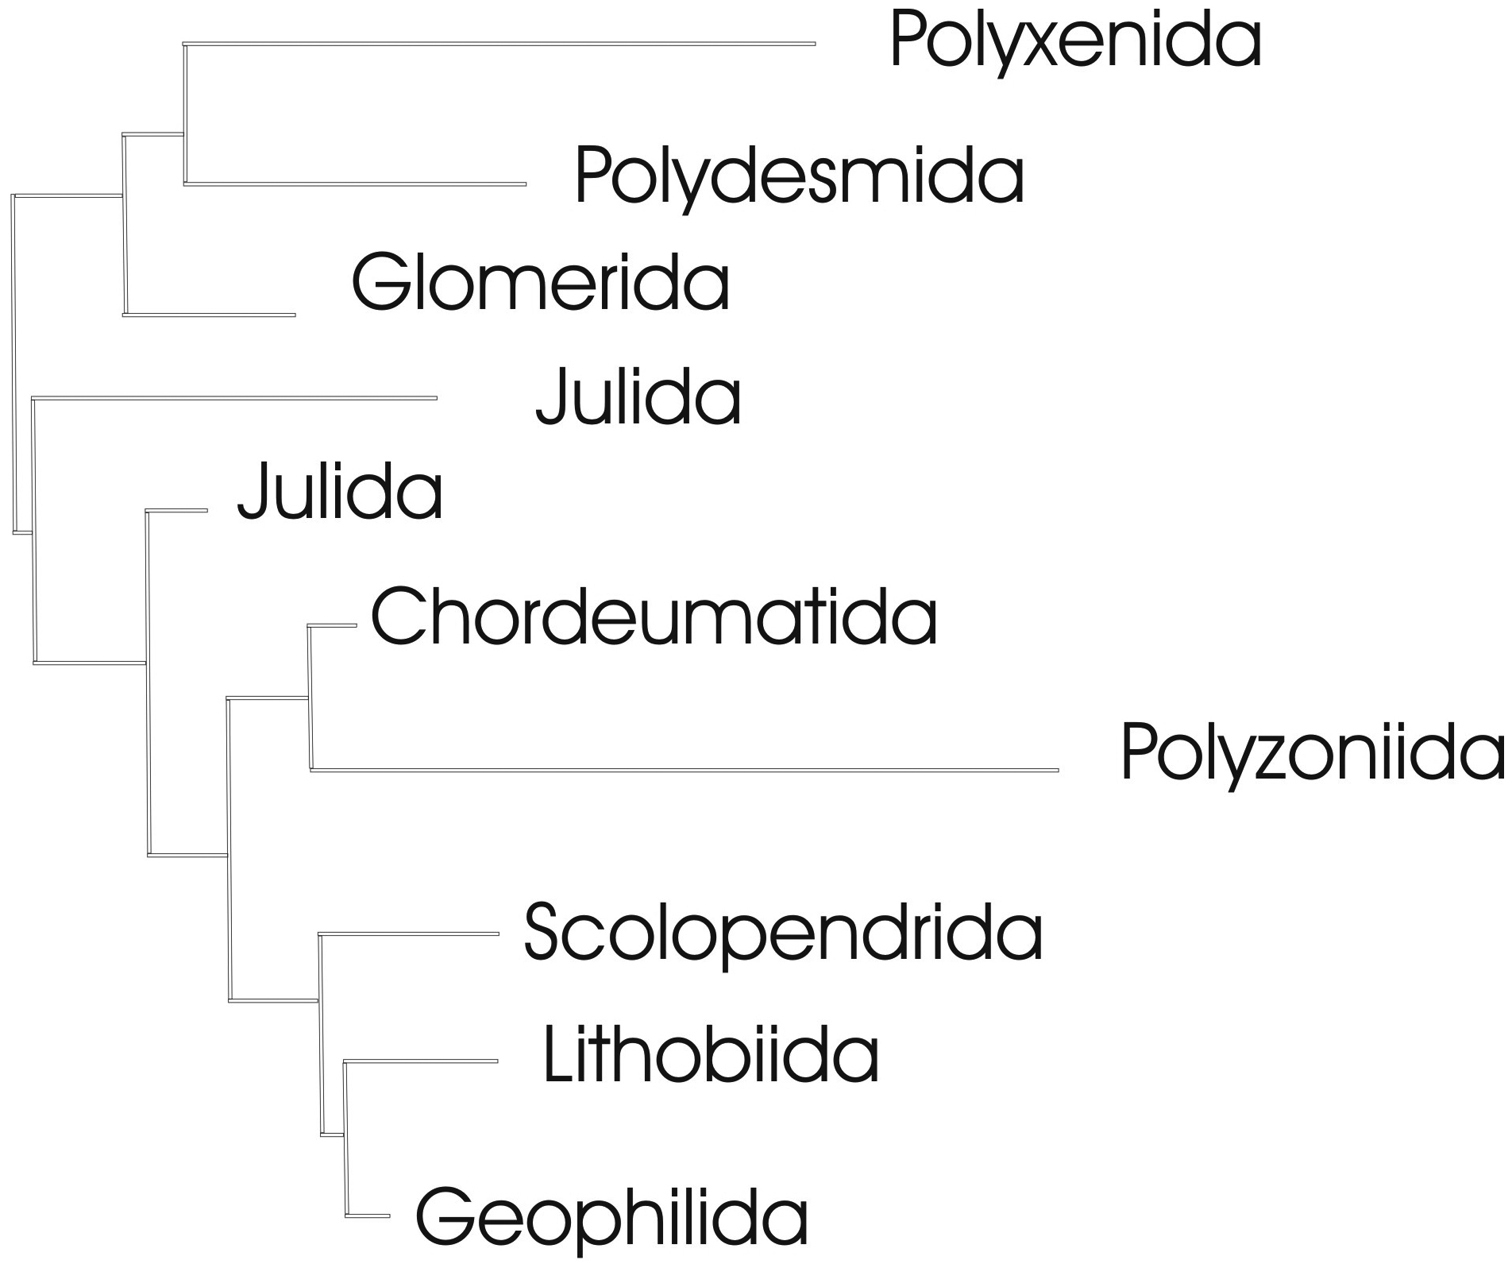
Complete neighbour-joining tree of COI sequence divergences (K2P model) of studied myriapod orders; barcoded terminal taxa and clades above their basal nodes omitted. This tree serves for orientation in the detailed trees given in Figs 8–11.
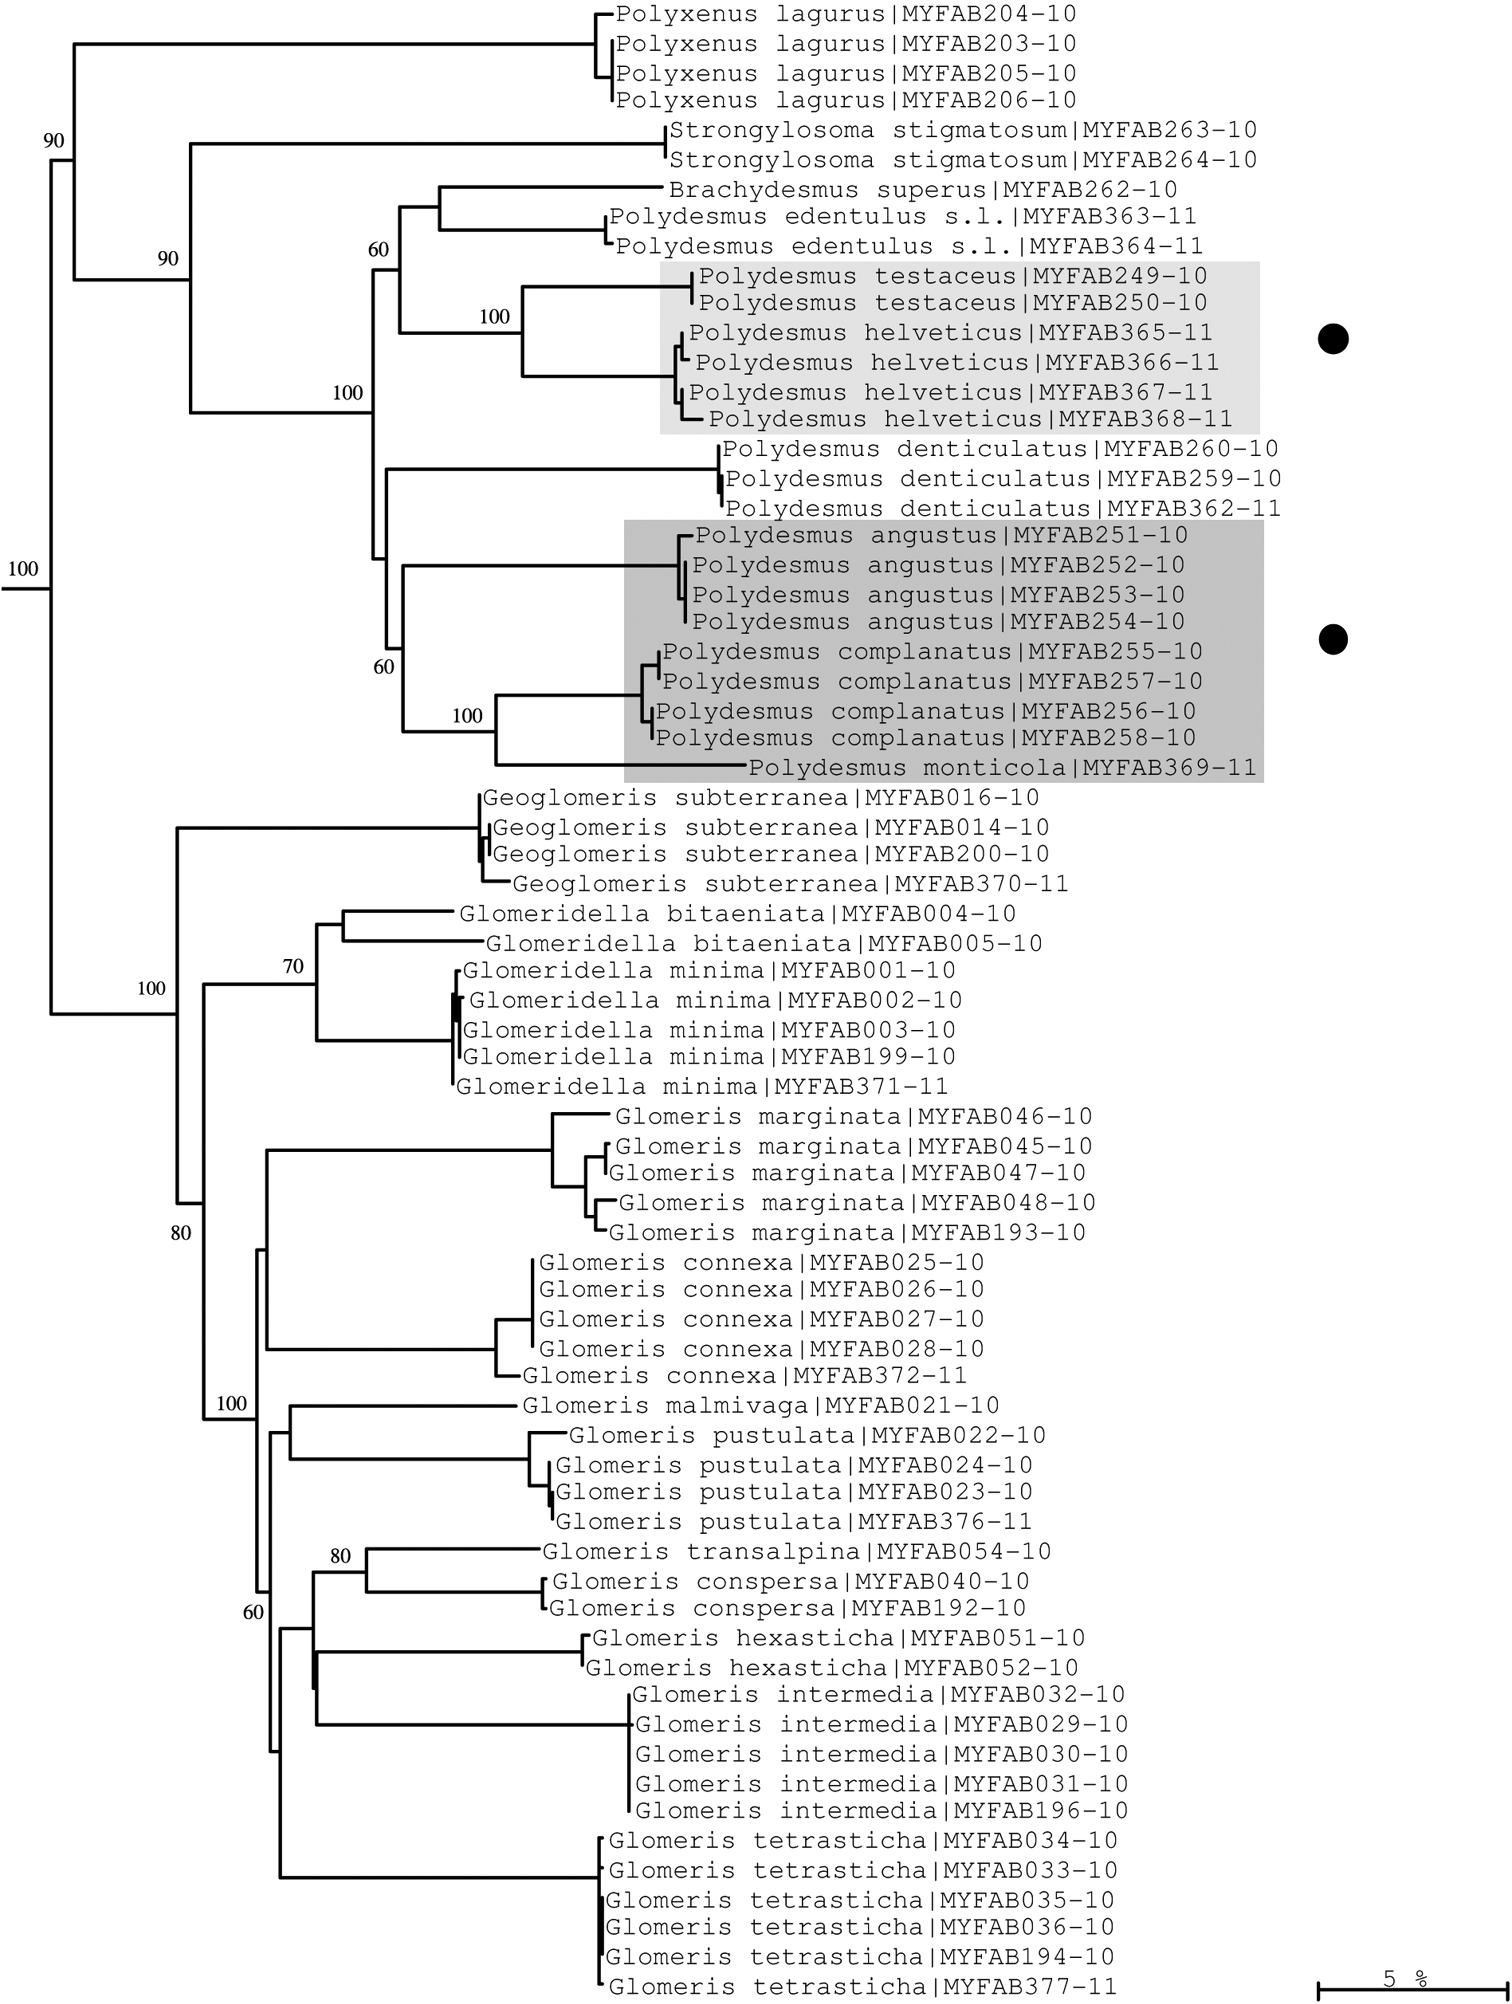
Neighbour-joining tree of COI sequence divergences (K2P model) of studied Polyxenida, Polydesmida and Glomerida. Solid circles: examples of excellent resolution of very close species of the genus Polydesmus. Numbers above and below branches show bootstrap values of NJ analysis, branch length indicates sequence divergence in %.
Though the mitochondrial COI gene is generally not seen as adequate for resolving relationships at taxonomic levels higher than species or genus, all barcoded myriapod orders (Polyxenida, Polydesmida, Glomerida, Chordeumatida, Polyzoniida, Scolopendrida, Lithobiida and Geophilida) form single COI clades, except for the Julida, which form two clades (Figs 7, 9). The latter is not too puzzling, however, as according to
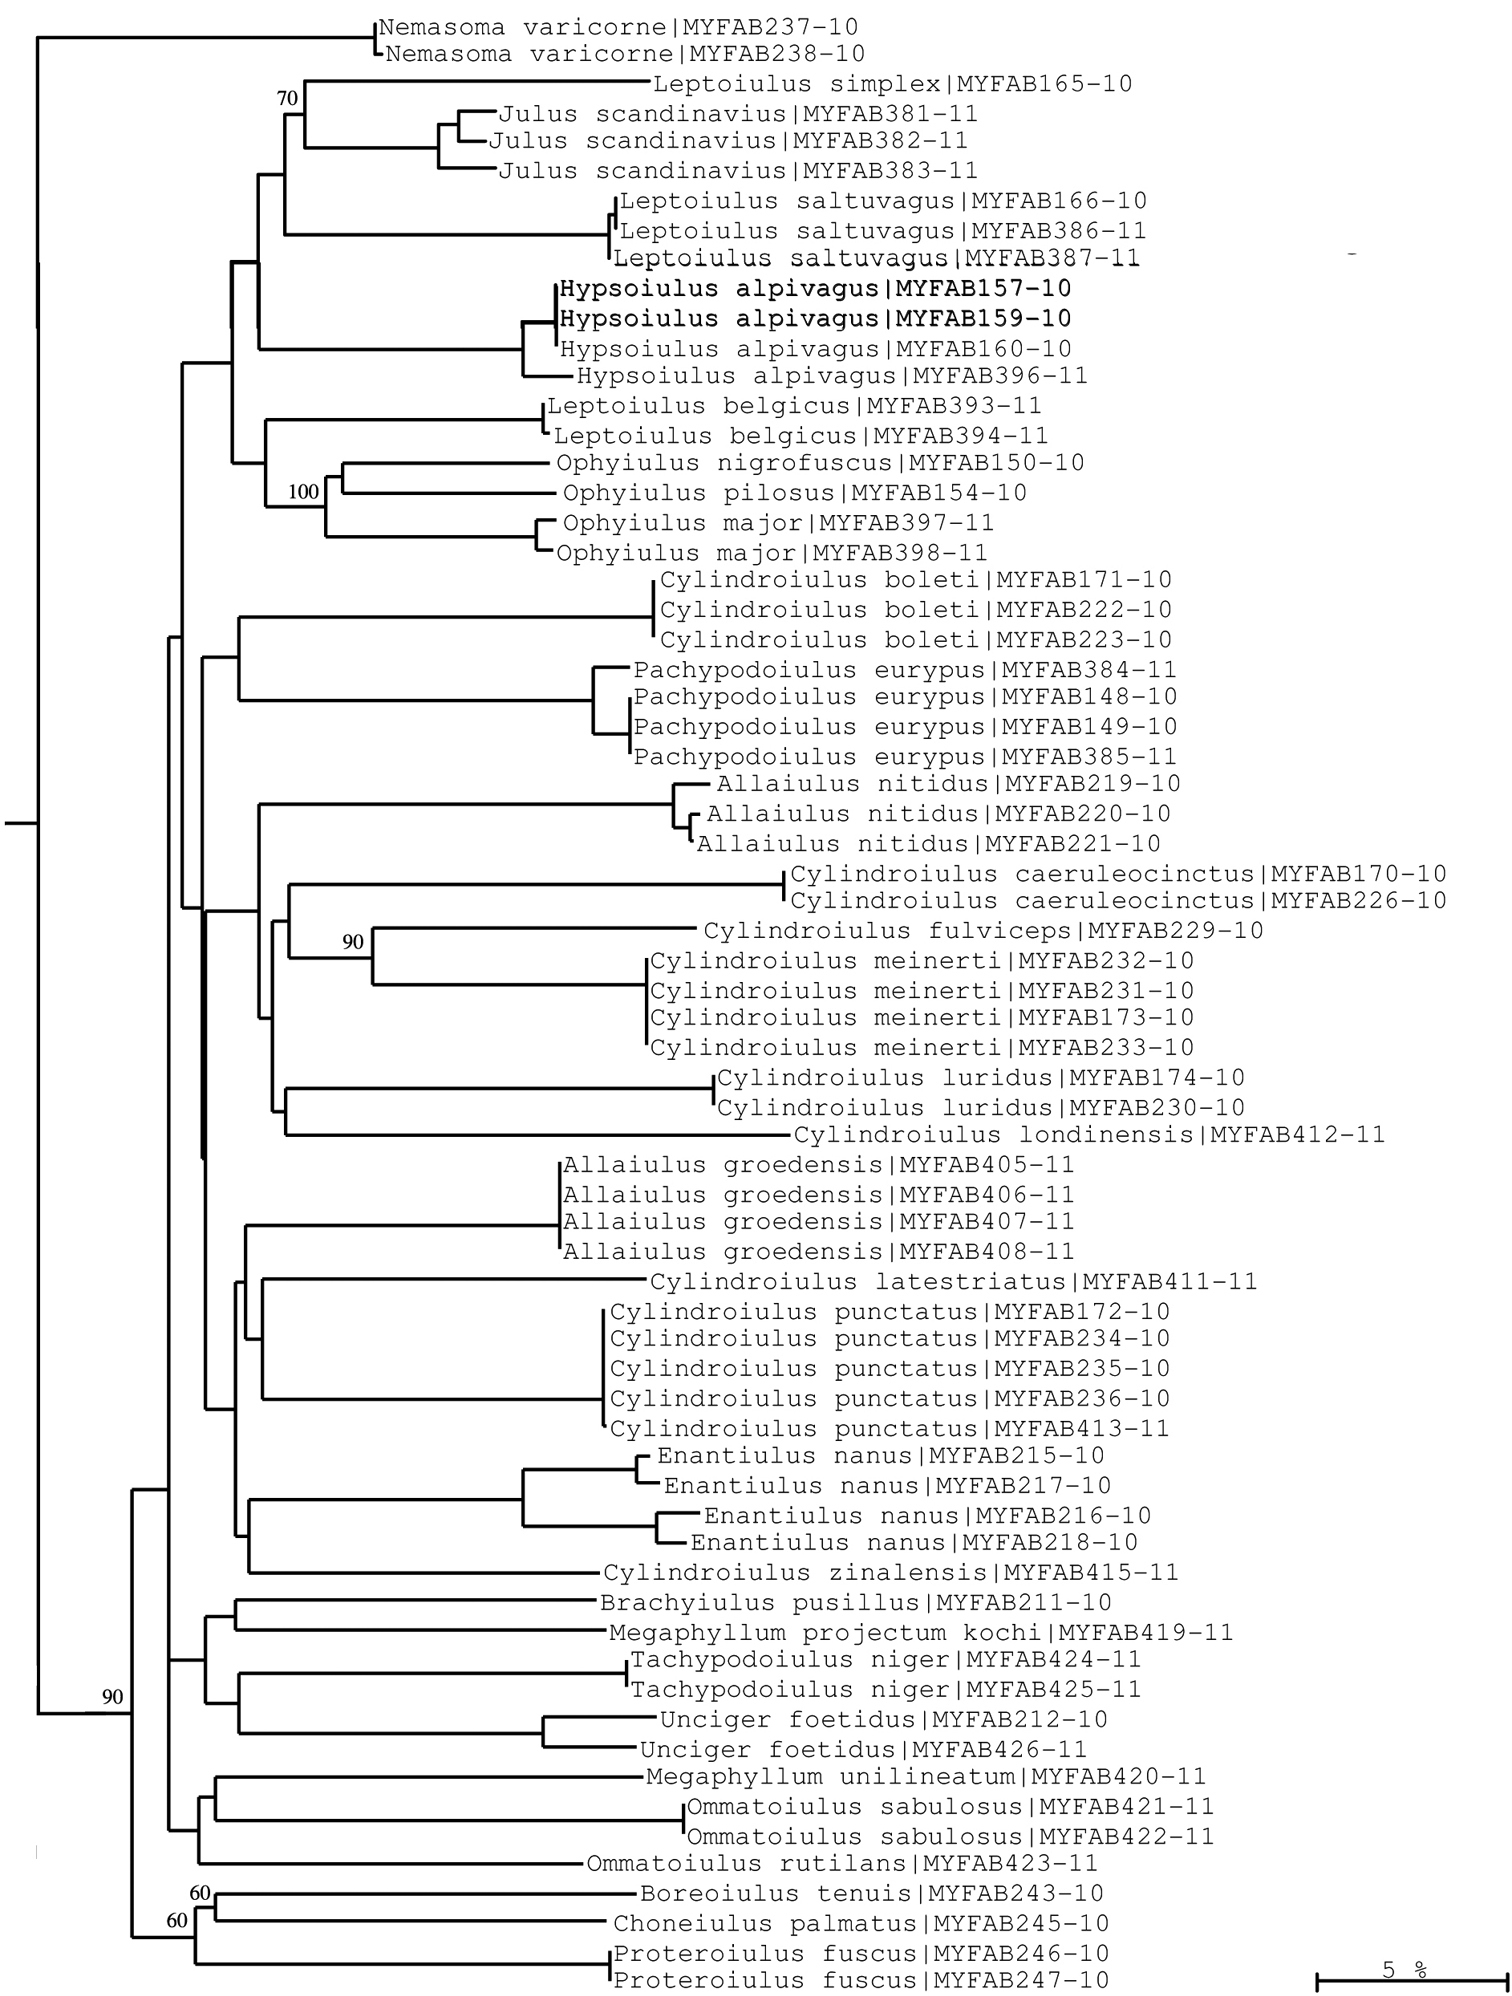
Neighbour-joining tree of COI sequence divergences (K2P model) of studied Julida. Note well-supported COI groups for each species allowing for sequence-based species identification. Numbers above and below branches show bootstrap values of NJ analysis, branch length indicates sequence divergence in %.
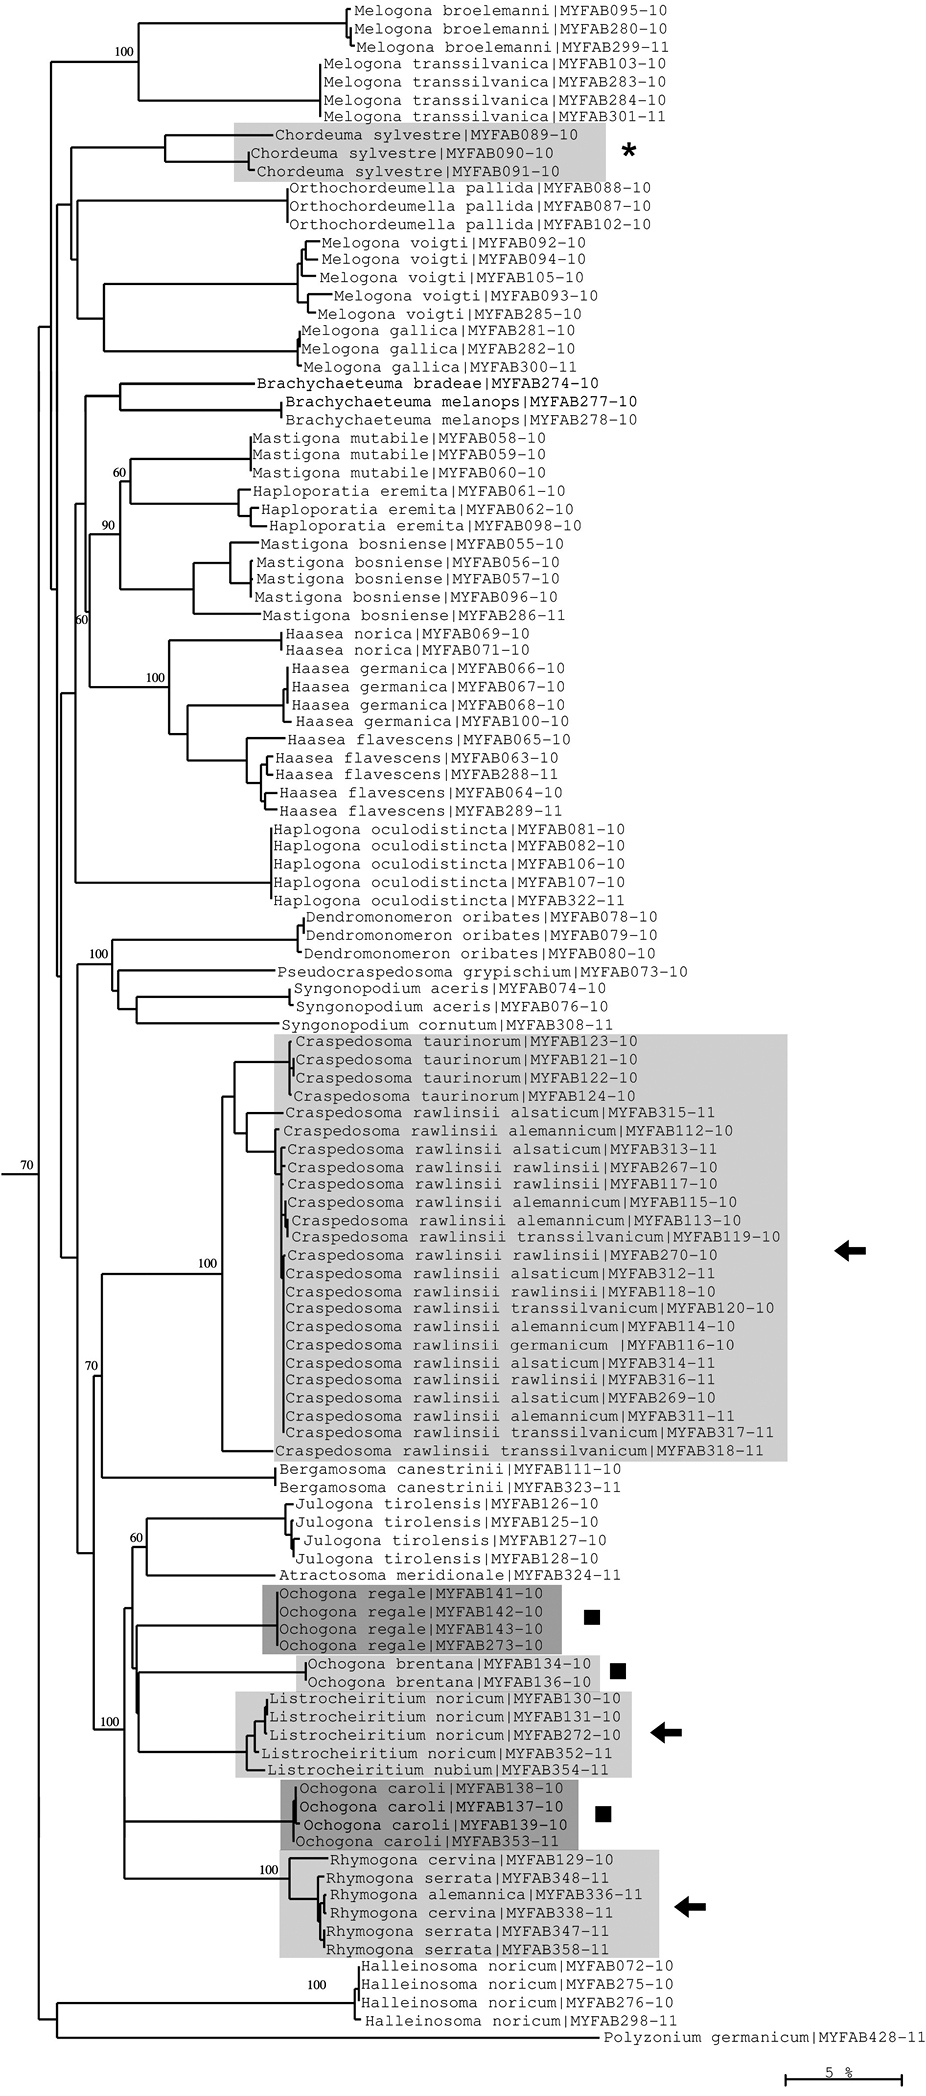
Neighbour-joining tree of COI sequence divergences (K2P model) of studied Chordeumatida. Asterisk: deep barcoding divergence in Chordeuma silvestre; solid squares: polyphyly of genus Ochogona; arrows: low sequence divergences in the genera Craspedosoma, Listrocheiritium and Rhymogona. Numbers above and below branches show bootstrap values of NJ analysis, branch length indicates sequence divergence in %.
Most of the studied species appear as distinct COI clades. Barcoded species can overlap for two reasons. First, speciation may have been very recent, e.g. during Pleistocene glacial episodes, as is the case for the diplopod genera Craspedosoma, Rhymogona and Listrocheiritium (
At the species and genus levels, we found examples of both well and weakly supported species. For example, Polydesmus testaceus and Polydesmus helveticus (both often regarded as belonging to a separate genus Propolydesmus; see
Conversely, very low interspecific variation is found, e.g., in the chordeumatidan genera Craspedosoma, Listrocheiritium and Rhymogona (Fig. 10). In particular it was not possible to resolve the very closely allied species/subspecies complex within the Craspedosoma rawlinsii –group, a result that may reflect ongoing introgression and hybridization. The members of this group even exhibit nearest neighbour distance values of zero, indicating that the COI barcoding method is not suitable for separating its subtaxa.
Moreover, examples of high intraspecific variation can be found in several Lithobius species (Lithobius forficatus, Lithobius mutabilis, Lithobius tricuspis) (Fig. 11), and in Chordeuma sylvestre (Fig. 10). These deep barcoding divergences could represent more than just high variation and might indicate that cryptic species, previously undetected using the classical morphological approach, are present among our samples. However, the revalidation of the species Lithobius glacialis by
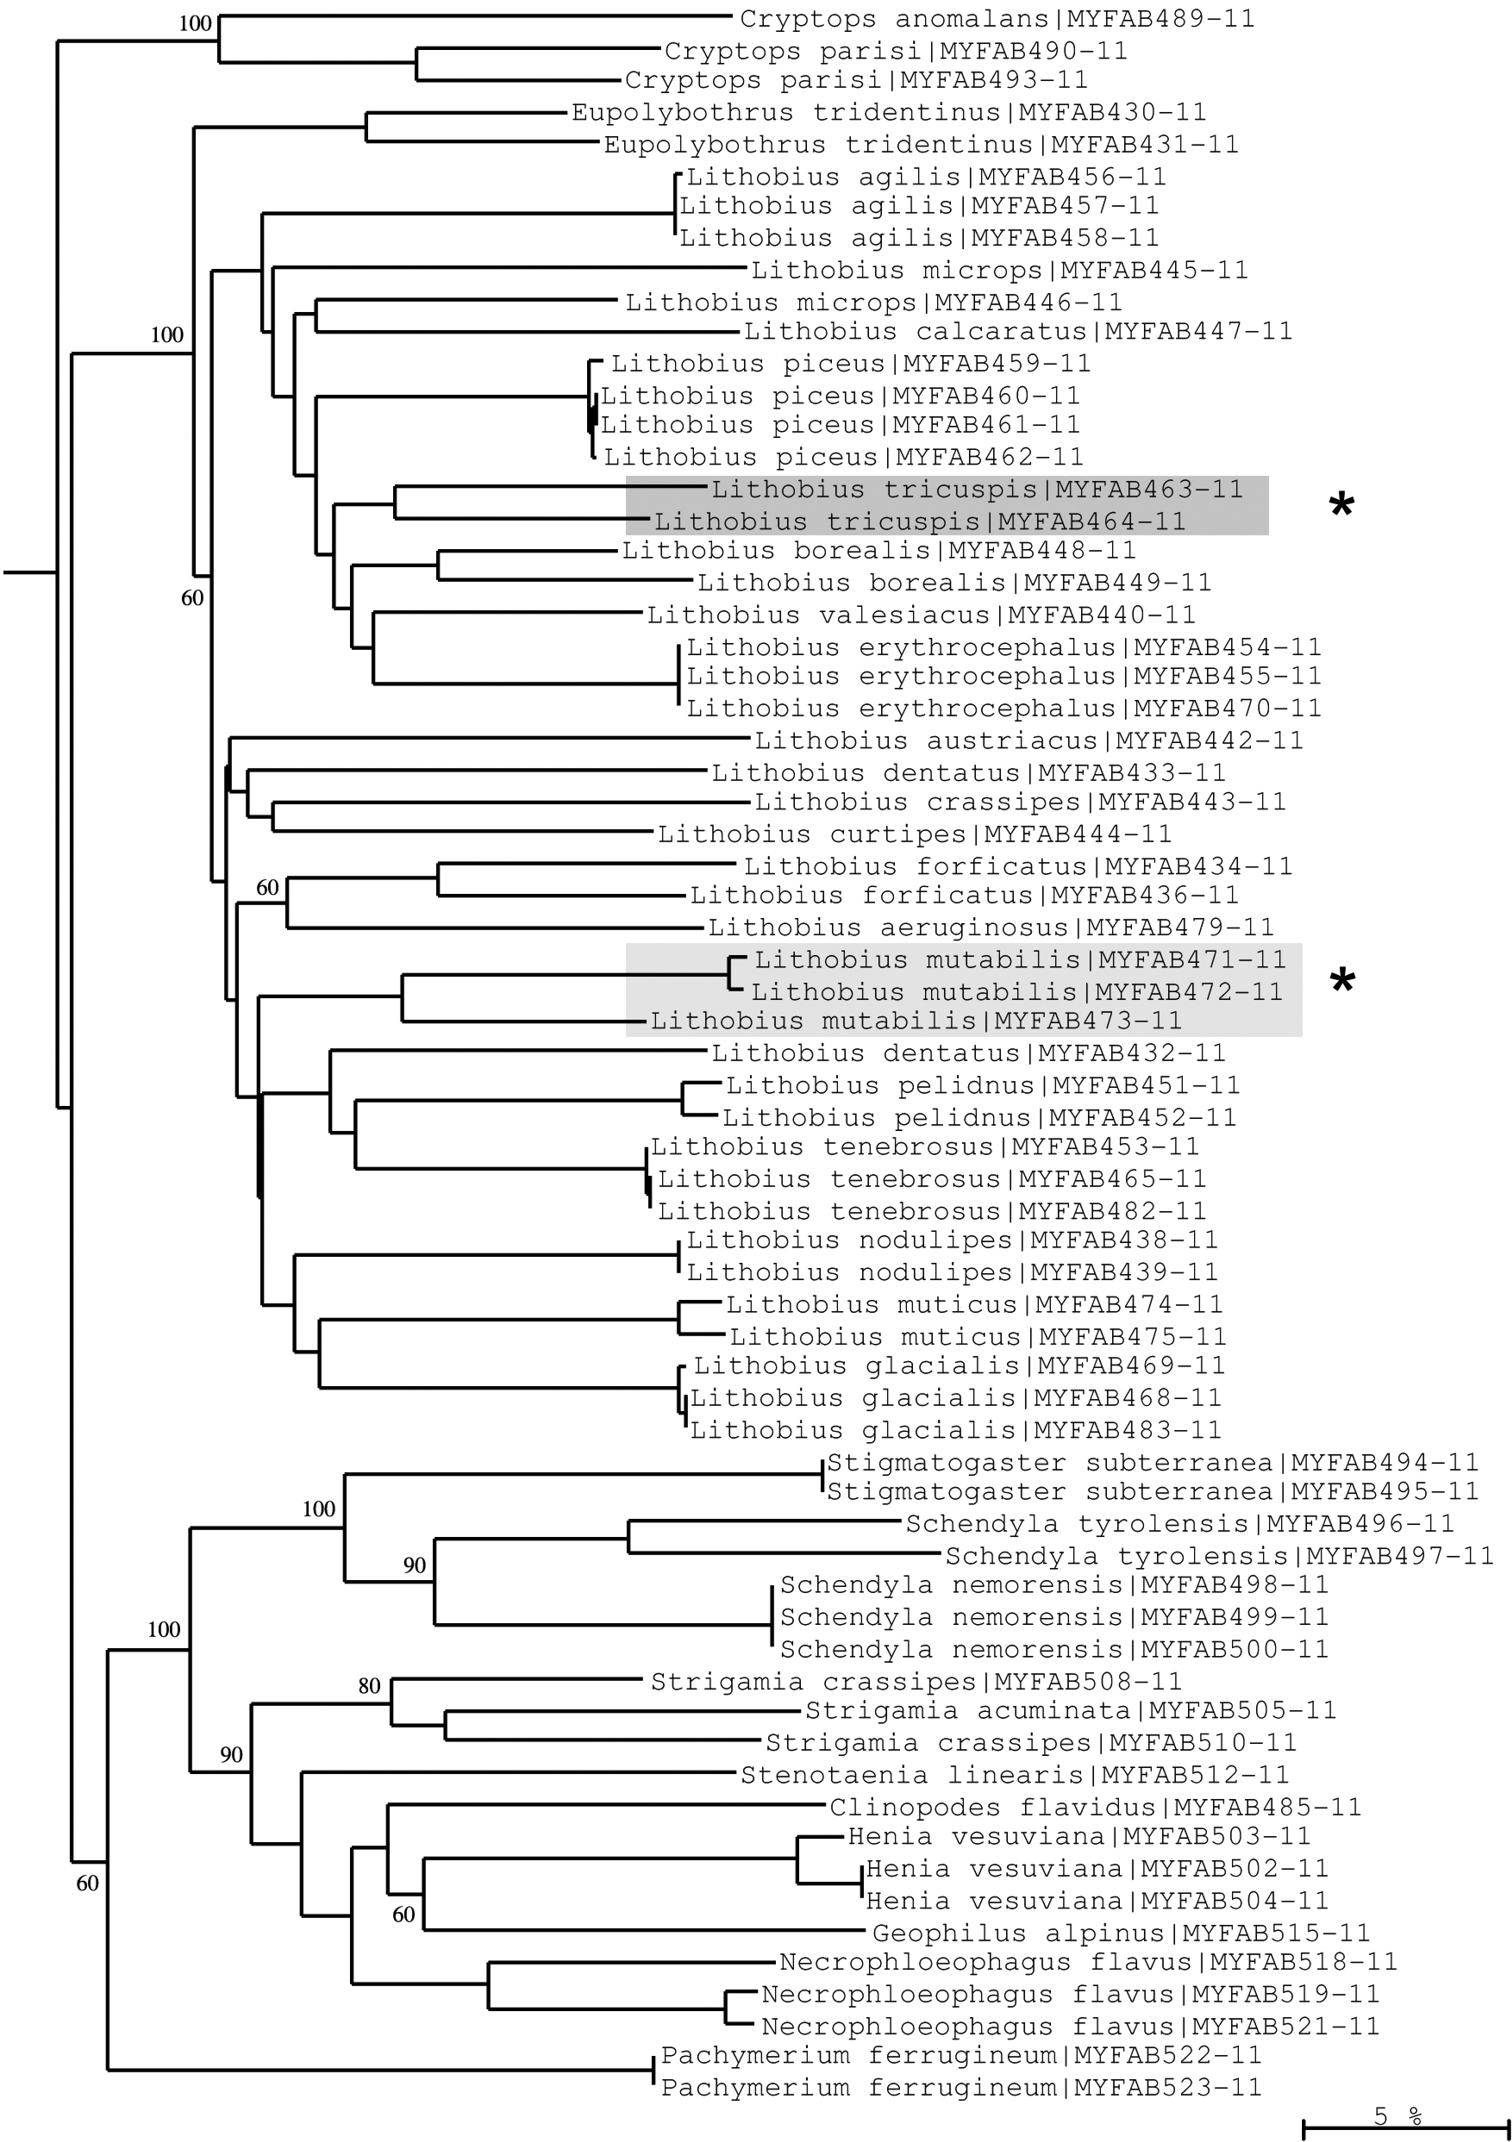
Neighbour-joining tree of COI sequence divergences (K2P model) of studied Chilopoda. Asterisks: Deep divergences within Lithobius tricuspis and Lithobius mutabilis suggesting cryptic speciation. Numbers above and below branches show bootstrap values of neighbour-joining analysis, branch length indicates sequence divergence in %.
Despite the success of COI barcoding in so many species of centipedes and millipedes it has to be admitted that there are still technical problems with this method that make the success of the barcoding process for any single sample unpredictable. For reasons of cost efficiency the CCDB presently uses only one set of standard primers that are probably not optimal for all groups of centipedes and millipedes. For example, we have failed so far to get any sequences in the genera Trachysphaera and Mycogona, and have obtained only single chance results in the Glomeris undulata and the Leptoiulus simplex species groups. The genera Ommatoiulus, Unciger and Tachypodoiulus also seemed to be difficult, as we have obtained only a few barcodes for each of these taxa. To get optimal results special primers would have to be designed. But it is not only the primer design but also the protocol that influences the results. This might explain why some species yielded a barcode in one analytical plate but not in another. Contamination by chemicals (defense secretions in millipedes) might be another cause of unpredictable failures.
Although COI barcoding has provided an excellent tool for the identification of all life stages in several species, there are some problems with this gene locus as it is of mitochondrial origin. This means that it only shows maternal inheritance; therefore different maternal lines might mock cryptic species. This mainly affects the Chilopoda, which show a much higher genetic variability than the Diplopoda. While the histogram of intraspecific distances of the Diplopoda (Fig. 6) resembles that found in insects (e.g., Lepidoptera – Geometridae:
Recent speciations of glacial or postglacial origin with ongoing hybridization and introgression are impossible to resolve using barcodes, as apparently shown by the genera Craspedosoma, Rhymogona and Listrocheiritium. In such cases other genes, especially of nuclear origin, should be used for evolutionary analysis in addition to COI.
Our results show that DNA barcoding can be a highly effective tool for the identification of Chilopoda and Diplopoda, provided that the right primers are designed and the right protocol is used. Before it can be better used, a reference barcode library is needed, the genetic variation must be known, and a close partnership between researchers with taxonomic expertise and those with a background in molecular analysis should be established for the interpretation of the results.
The Barcoding Fauna Bavarica project is financially supported by the Bavarian Ministry of Science, Research and Art (Bayerisches Staatsministerium für Wissenschaft, Forschung und Kunst), Munich, Germany. But our work would still have been difficult without the generous consent to use their facilities from the Canadian Centre for Barcoding at the Department of Zoology, University of Guelph, Ontario, Canada, financed by Genome Canada through the Ontario Genomics Institute. We thus have to thank first and foremost the project leaders, Gerhard Haszprunar (Munich) and Paul D. N. Hebert (Guelph), for their support.
For lots of discussion, processing and coordination, our thanks go to Axel Hausmann, Lars Hendrich, Michael Balke, Stephan Schmidt, Michael Miller (all Munich), Greg Singer (Guelph), and David Porco (Rouen). Julian Augusteyns, Nathalie Bäumler, Stefan Friedrich (all Munich), Jürgen Gruber (Vienna), Karin Voigtländer (Görlitz), and Thomas Wesener (Bonn) are thanked for their help with providing specimens for our study. Special thanks go to Martin Spies (Munich) and Robert Mesibov (Launceston) for polishing the English.