|
||
|
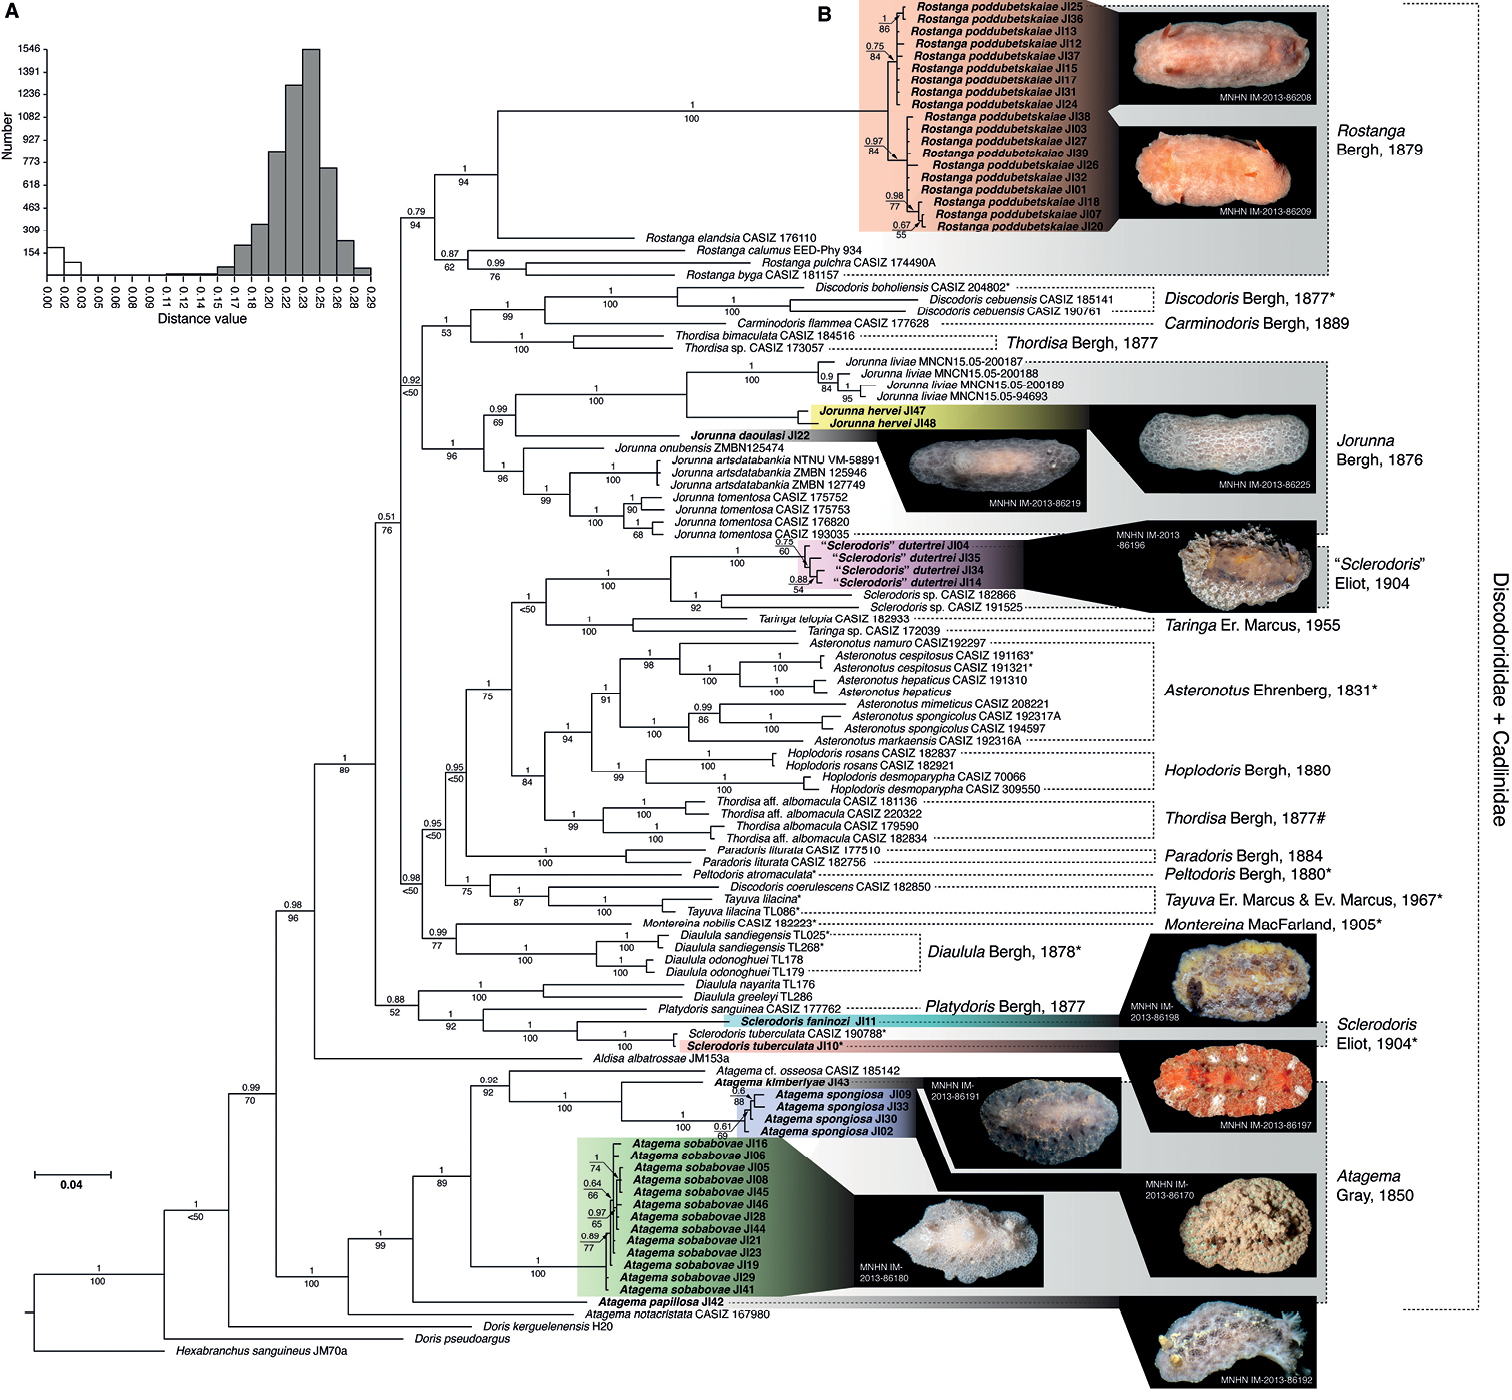
Graphic representation of the molecular analyses results A histogram represents the distance plot for the ABGD analysis using the COI gene showing pairwise p-distances (Kimura 2 model) among candidate species B Bayesian consensus tree of the concatenated 16S, COI and H3 gene fragments. Posterior probabilities from the Bayesian analysis are listed above each branch; bootstrap values from maximum likelihood analysis are listed below each branch. |