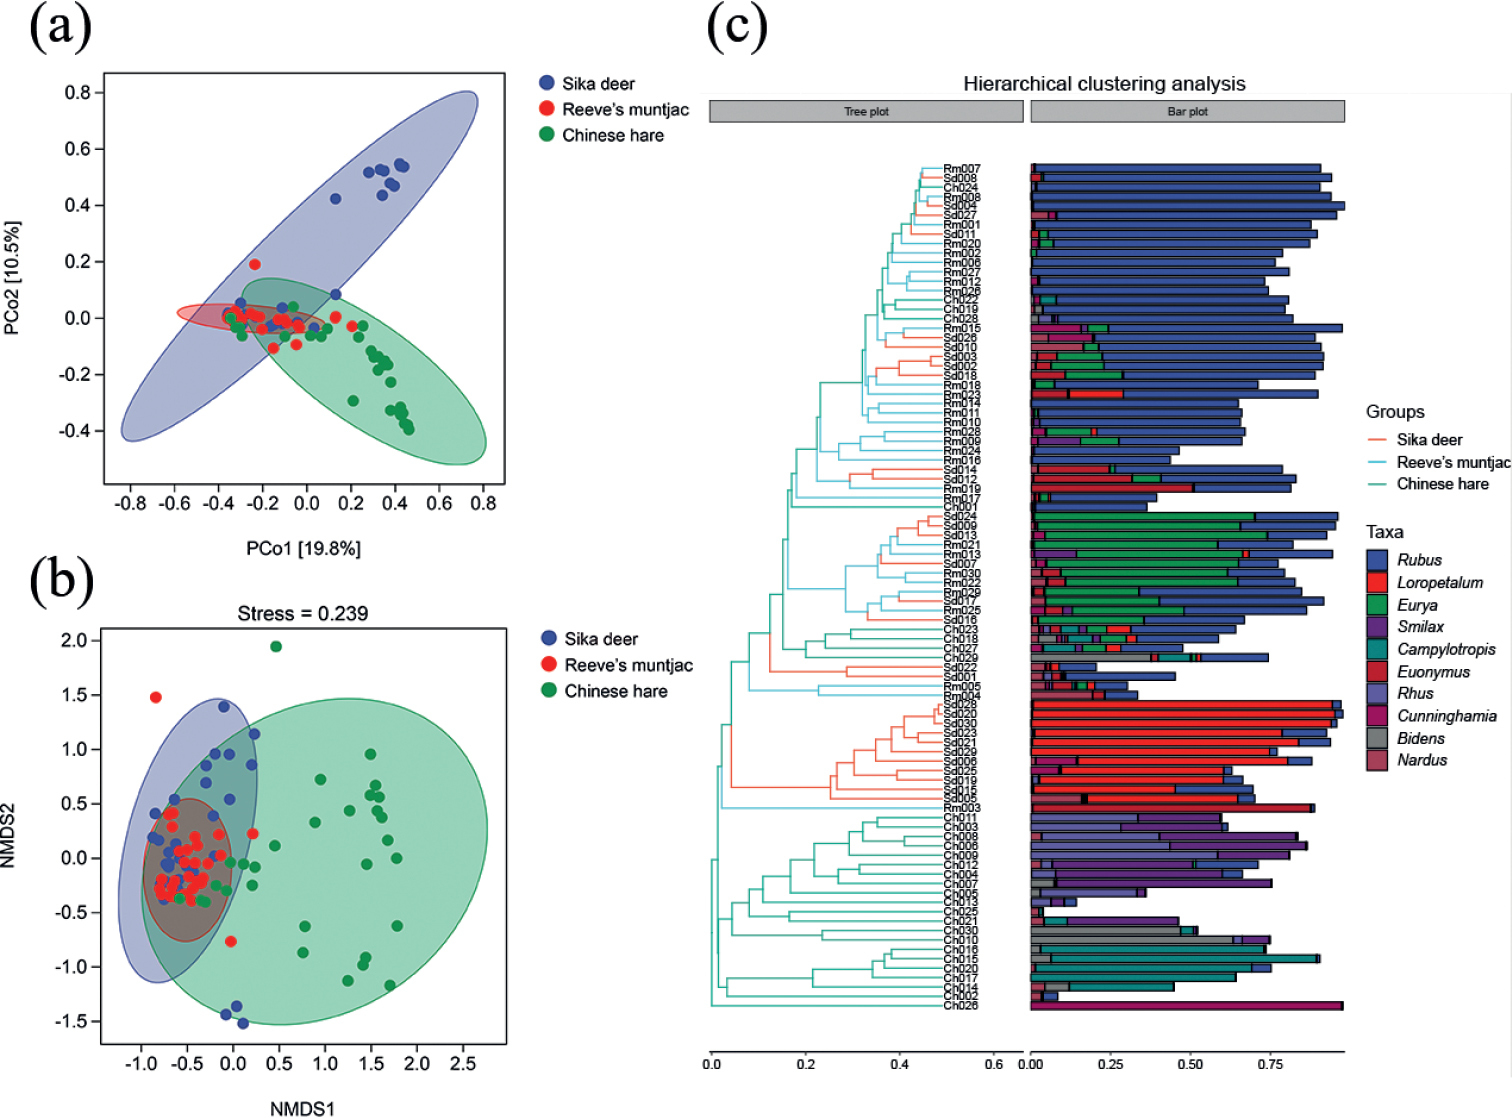
a PCoA analysis chart, in which each point represents a sample b NMDS analysis chart. Diagram analysis with 95% confidence ellipse c hierarchical clustering diagram. Analysis of the hierarchical clustering tree diagram and the stacked bar diagram of the top 10 genera in abundance (Ch: Chinese hare; Sd: Sika deer; Rm: Reeve’s muntjac).


  Part of: Wang D, Hu X, Li M, Liu J, Tang M, Liu W, Zhan J, Xu Y, Zhang W (2023) Diet composition and interspecific niche of Taohongling Sika deer (Cervus nippon kopschi) and its sympatric Reeve’s muntjac (Muntiacus reevesi) and Chinese hare (Lepus sinensis) in winter (Animalia, Mammalia). ZooKeys 1149: 17-36. https://doi.org/10.3897/zookeys.1149.96936