|
||
|
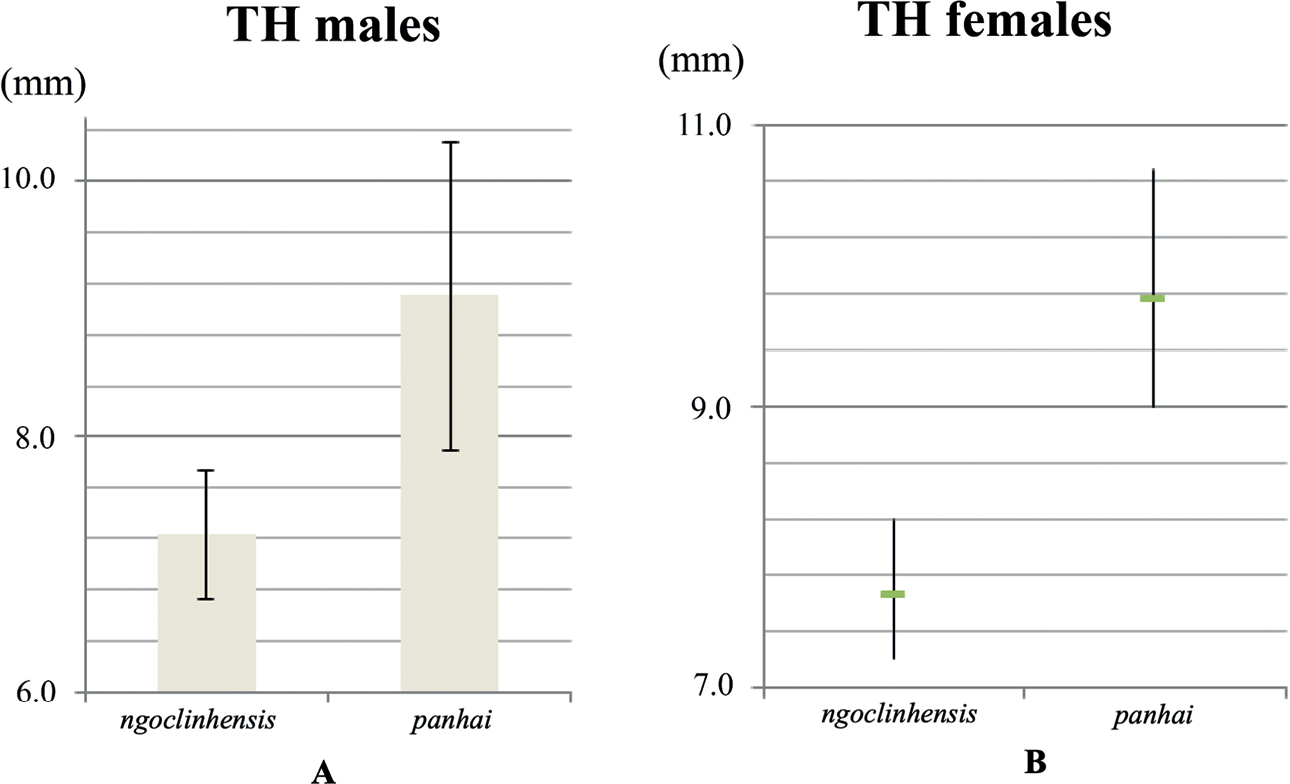
Comparison of average tail heights (mm) between Tylototriton ngoclinhensis sp. nov and T. panhai. The left side shows data for males (A) of Tylototriton ngoclinhensis sp. nov. (n = 3; own data) and T. panhai (n = 15; taken from Phimmachak et al. 2015), showing 2 standard deviation (2SD) bars, which represent 95% of the population. The right side shows data for females (B) of Tylototriton ngoclinhensis sp. nov. (n = 3; own data) and T. panhai (n = 3) including two data points from Phimmachak et al. (2015), and one from Nishikawa et al. (2013a); averages marked by green horizontal lines, and ranges as vertical lines. |