|
||
|
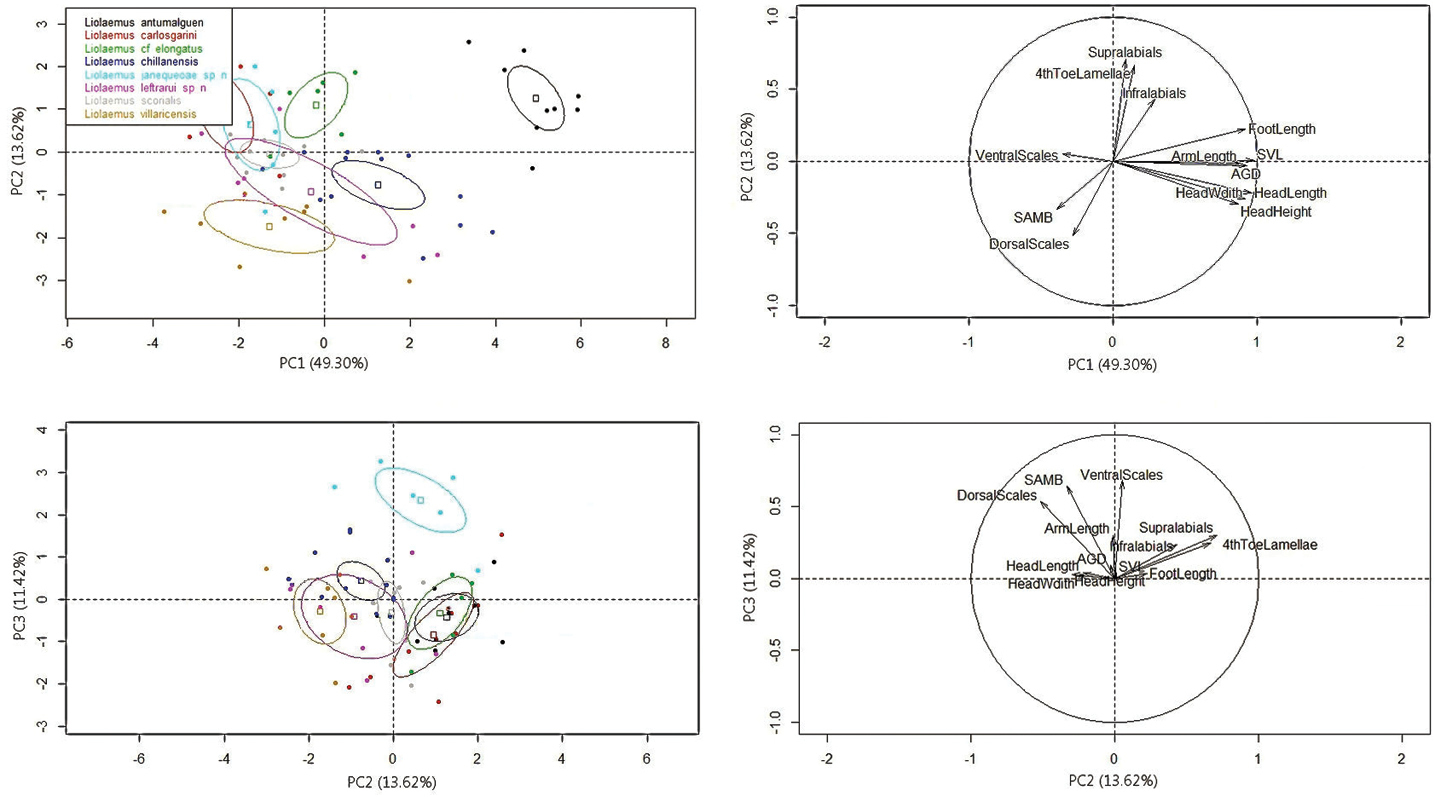
Principal Component Analysis (PCA) results. On the left, ellipses representing the 95% confidence interval around the centroid for each species. Axis correspond to the percentage of the total variance that each PC explains. On the right, contribution of each variable to the construction of the axes. |