|
||
|
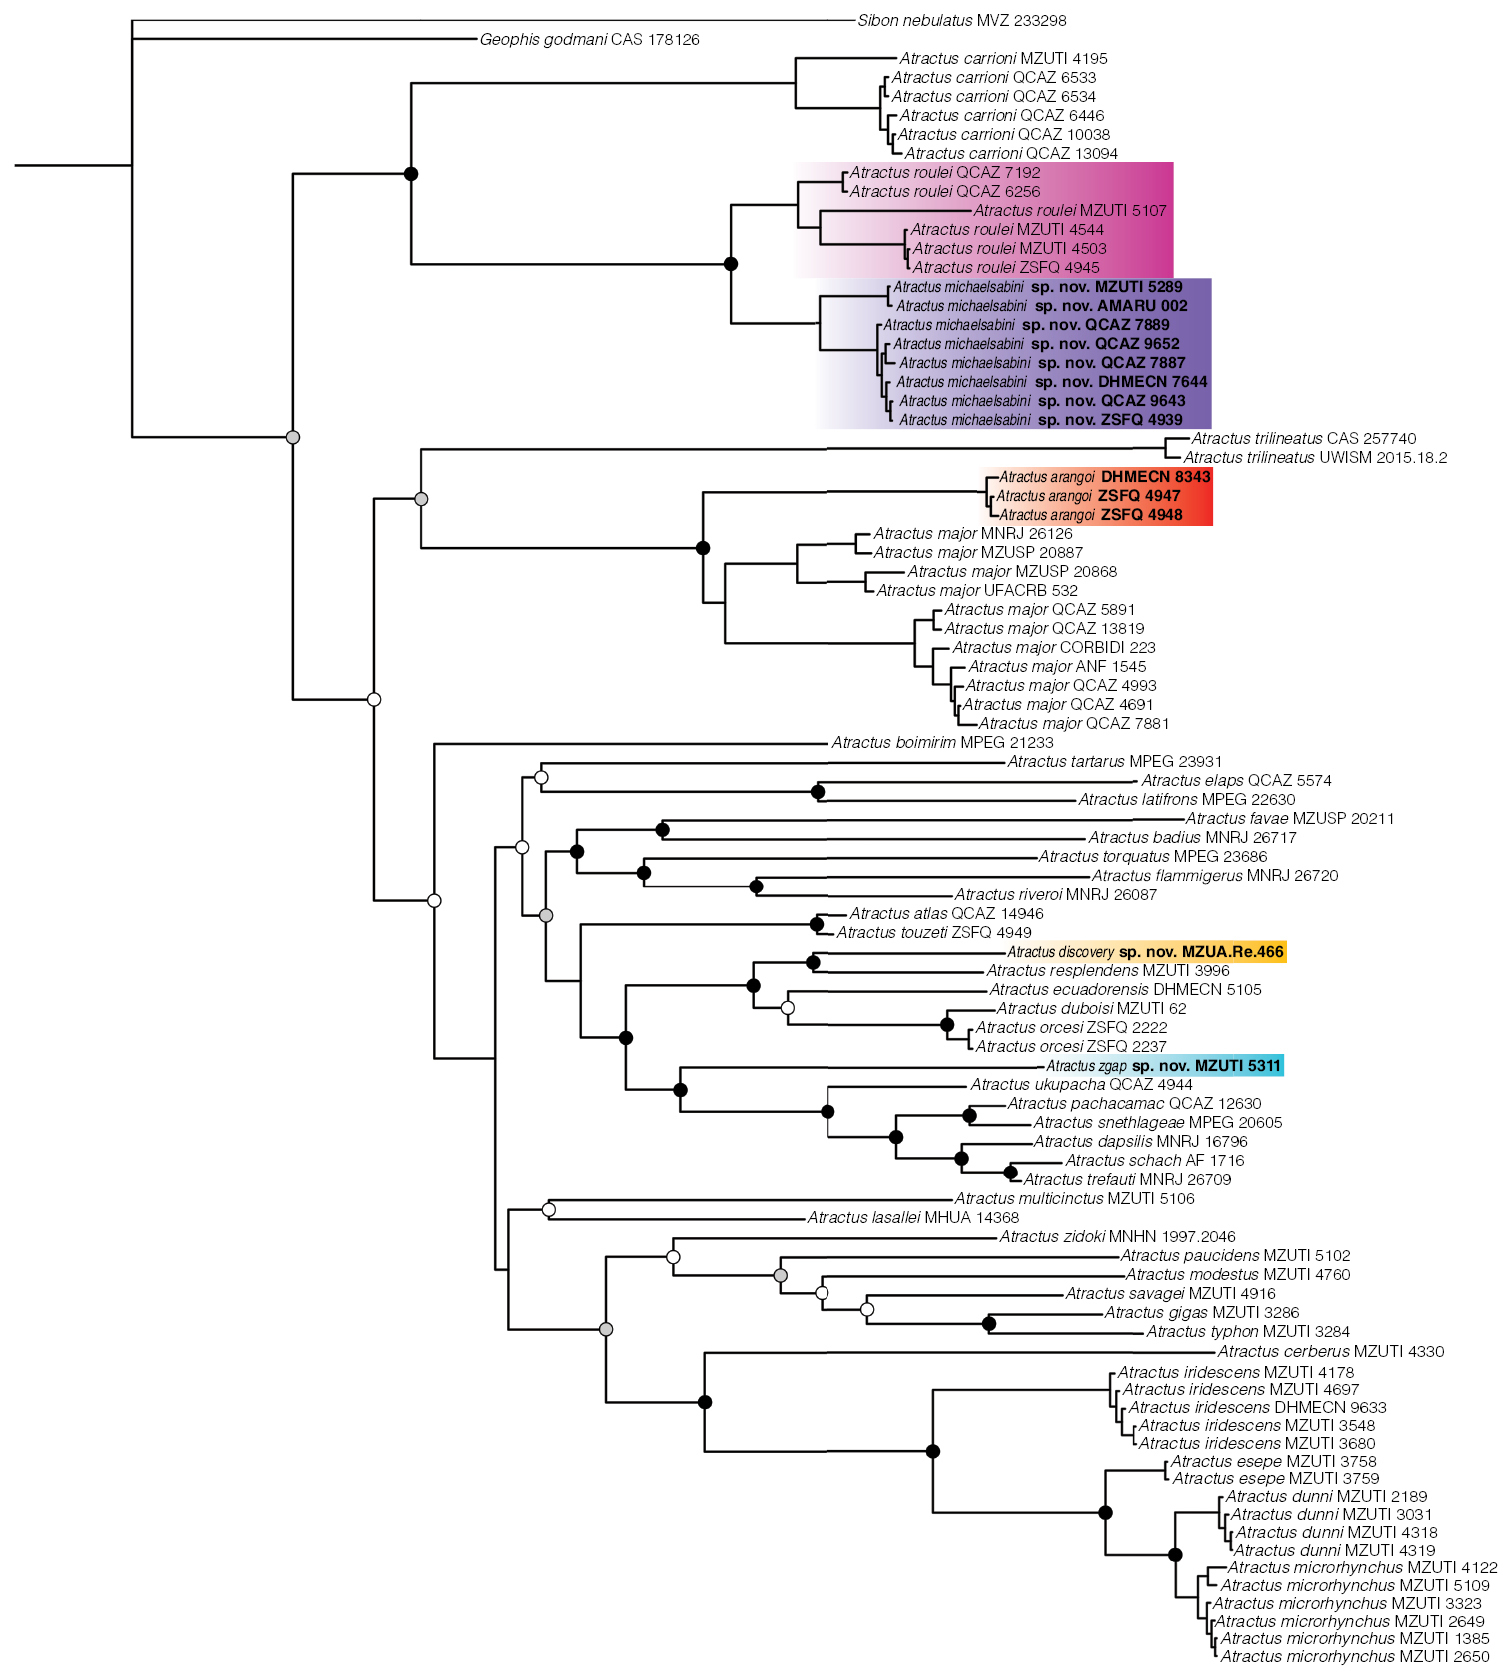
Phylogenetic relationships within Atractus inferred using a Bayesian inference and derived from analysis of 3,985 bp of DNA (gene fragments 16S, CYTB, ND4, C-MOS, NT3, and RAG1). Support values on intra-specific branches are not shown for clarity. Voucher numbers for sequences are indicated for each terminal. Black dots indicate clades with posterior probability values from 95–100%. Grey dots indicate values from 70–94%. White dots indicate values from 50–69% (values < 50% not shown). Colored clades correspond to the species’ distribution presented in the map of Fig. 2. New or resurrected species are indicated in bold type. |