|
||
|
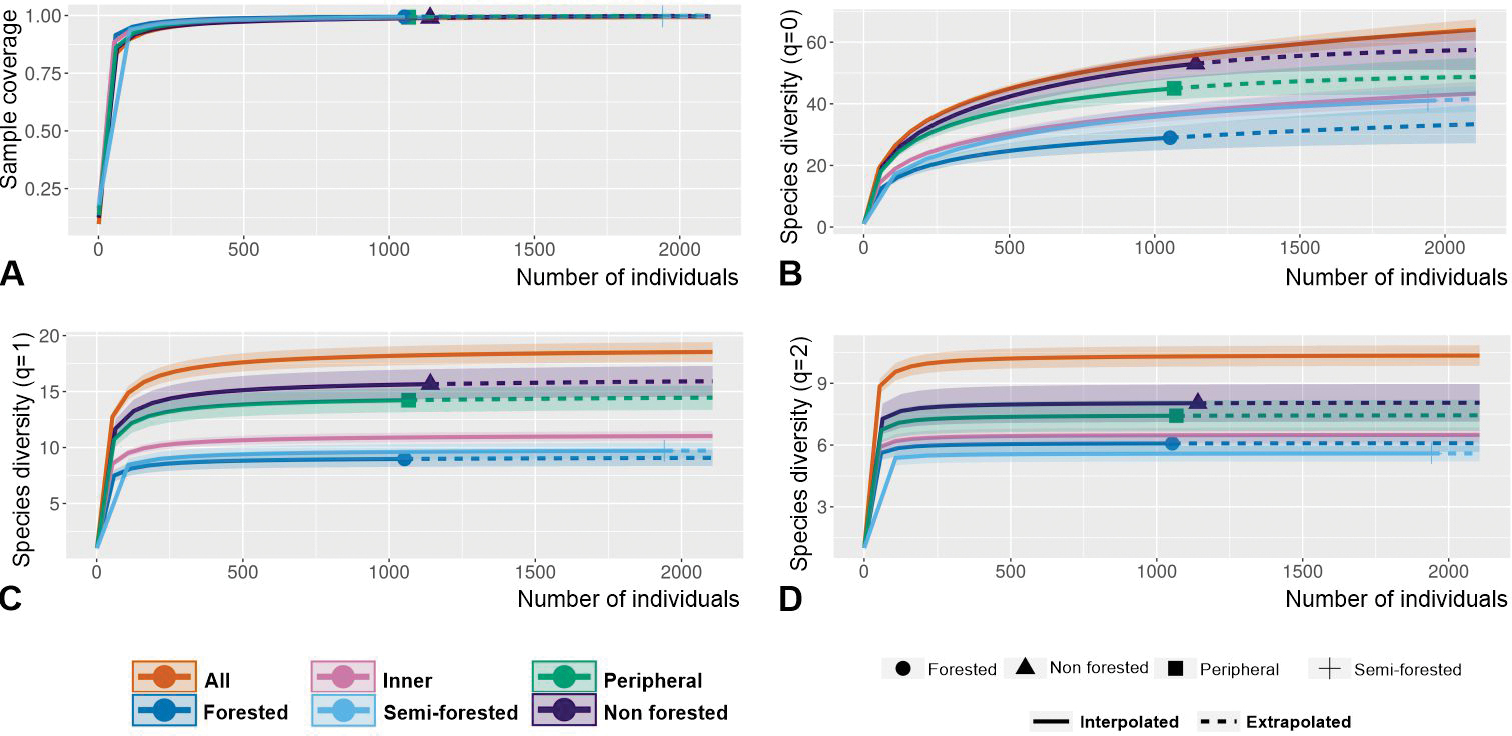
Interpolation-extrapolation graphs for the whole Makay dataset (All), for samplings in inner and in peripheral Makay, and for samplings in different vegetation contexts. Coloured lines represent the interpolated (solid line) or extrapolated (dashed line) estimate of the metric against number of individuals; the surface of lighter colour surrounding each curve materialises the 95% confidence interval A sample coverage B Hill number of order q=0 (H0 or species richness) C Hill number of order q = 1 (H1) D Hill number of order q = 2 (H2). |