|
||
|
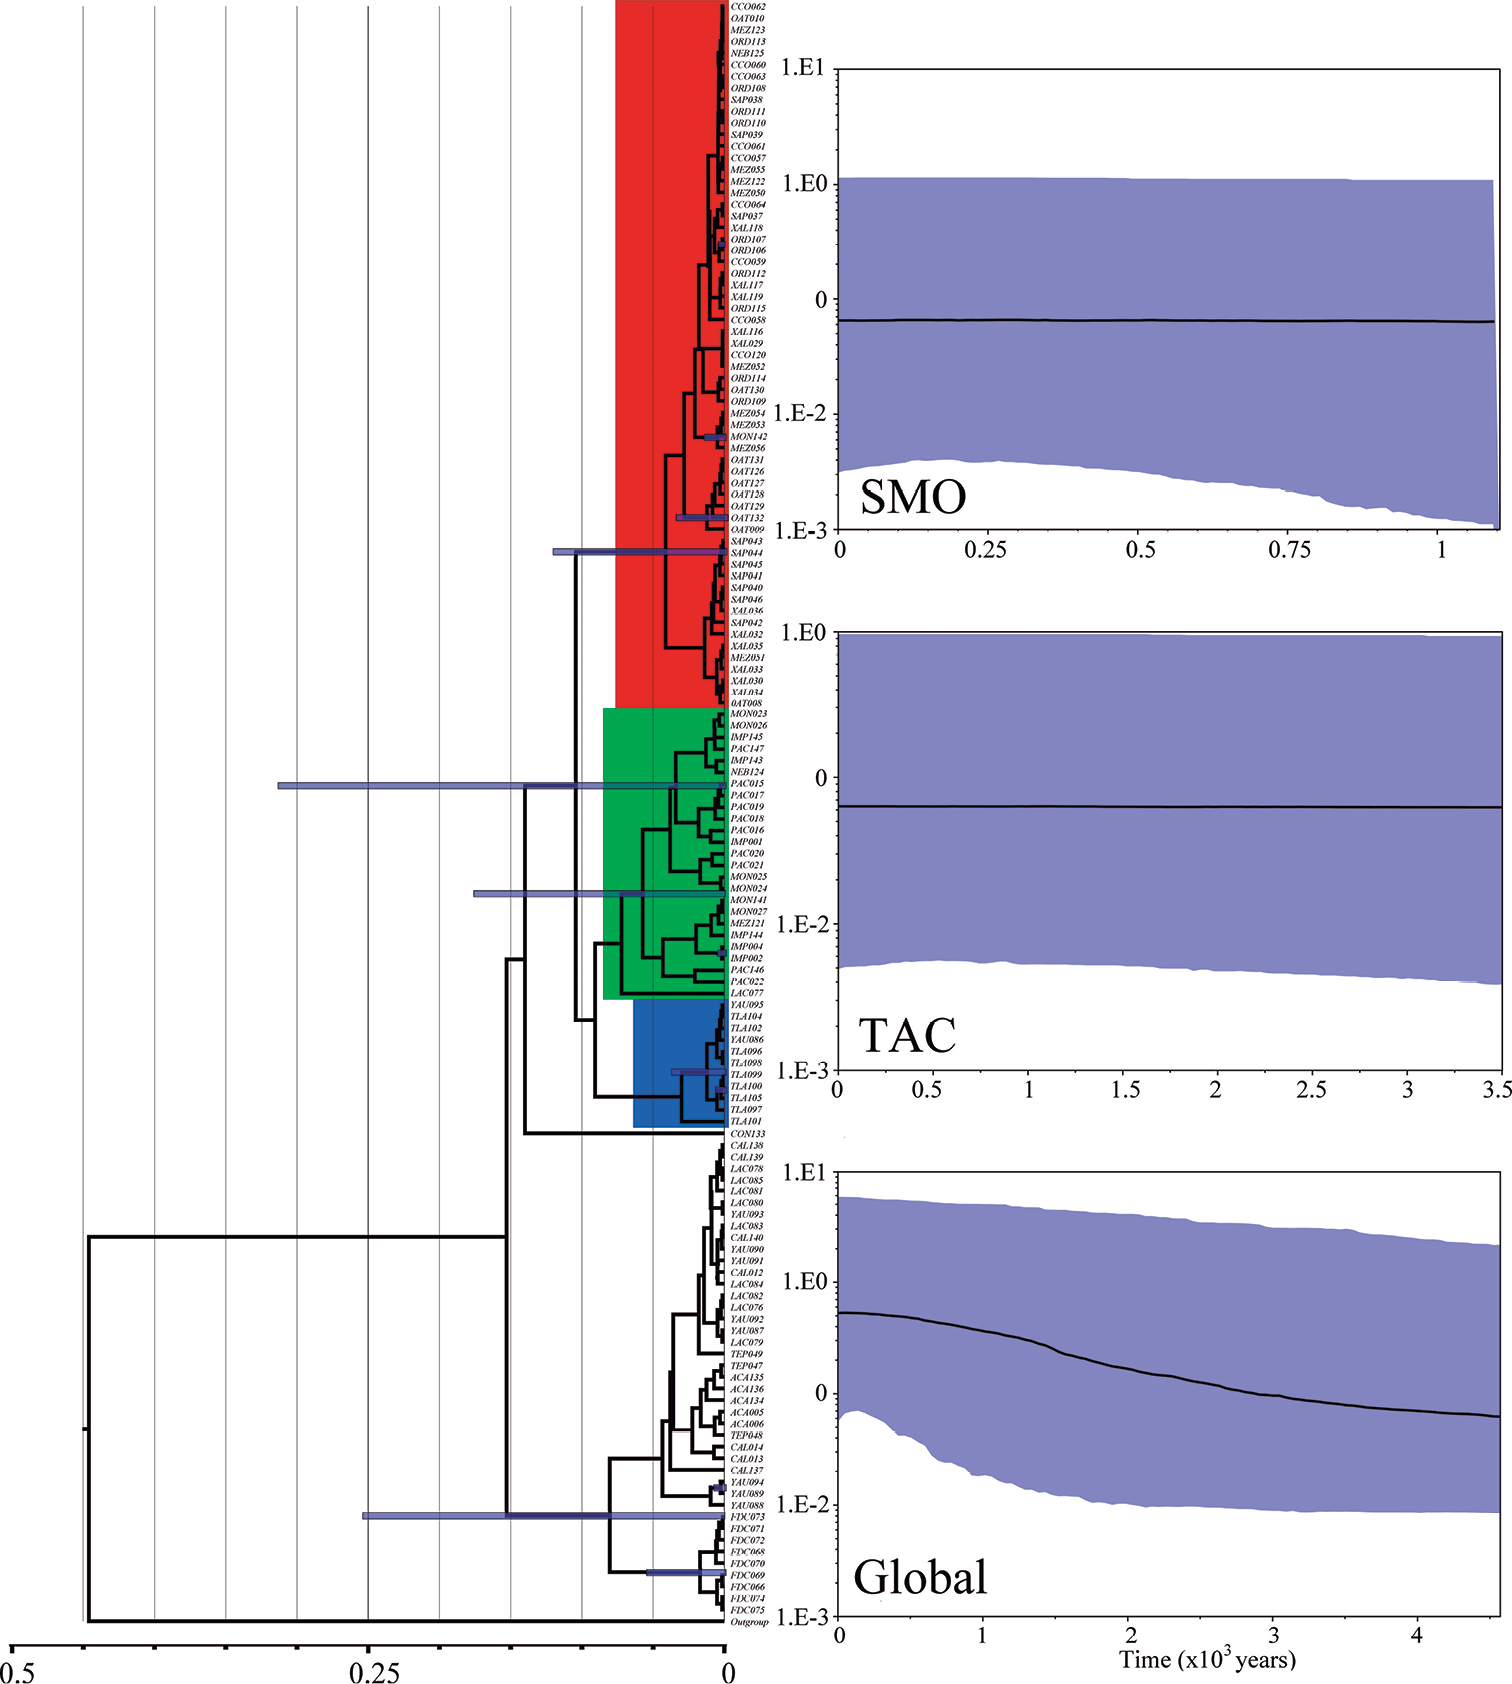
Chronogram and Skyline-plots based on COI sequences of Falagonia mexicana. For the chronogram the time is in millions of years. The Skyline-plots are shown for the clades going through demographic changes (SMO: Sierra Madre Oriental, TAC: Tierras Altas de Chiapas, and Global: Whole genealogy). Skyline-plots show mean Ne, plus 95% HDP confidence limit. |