|
||
|
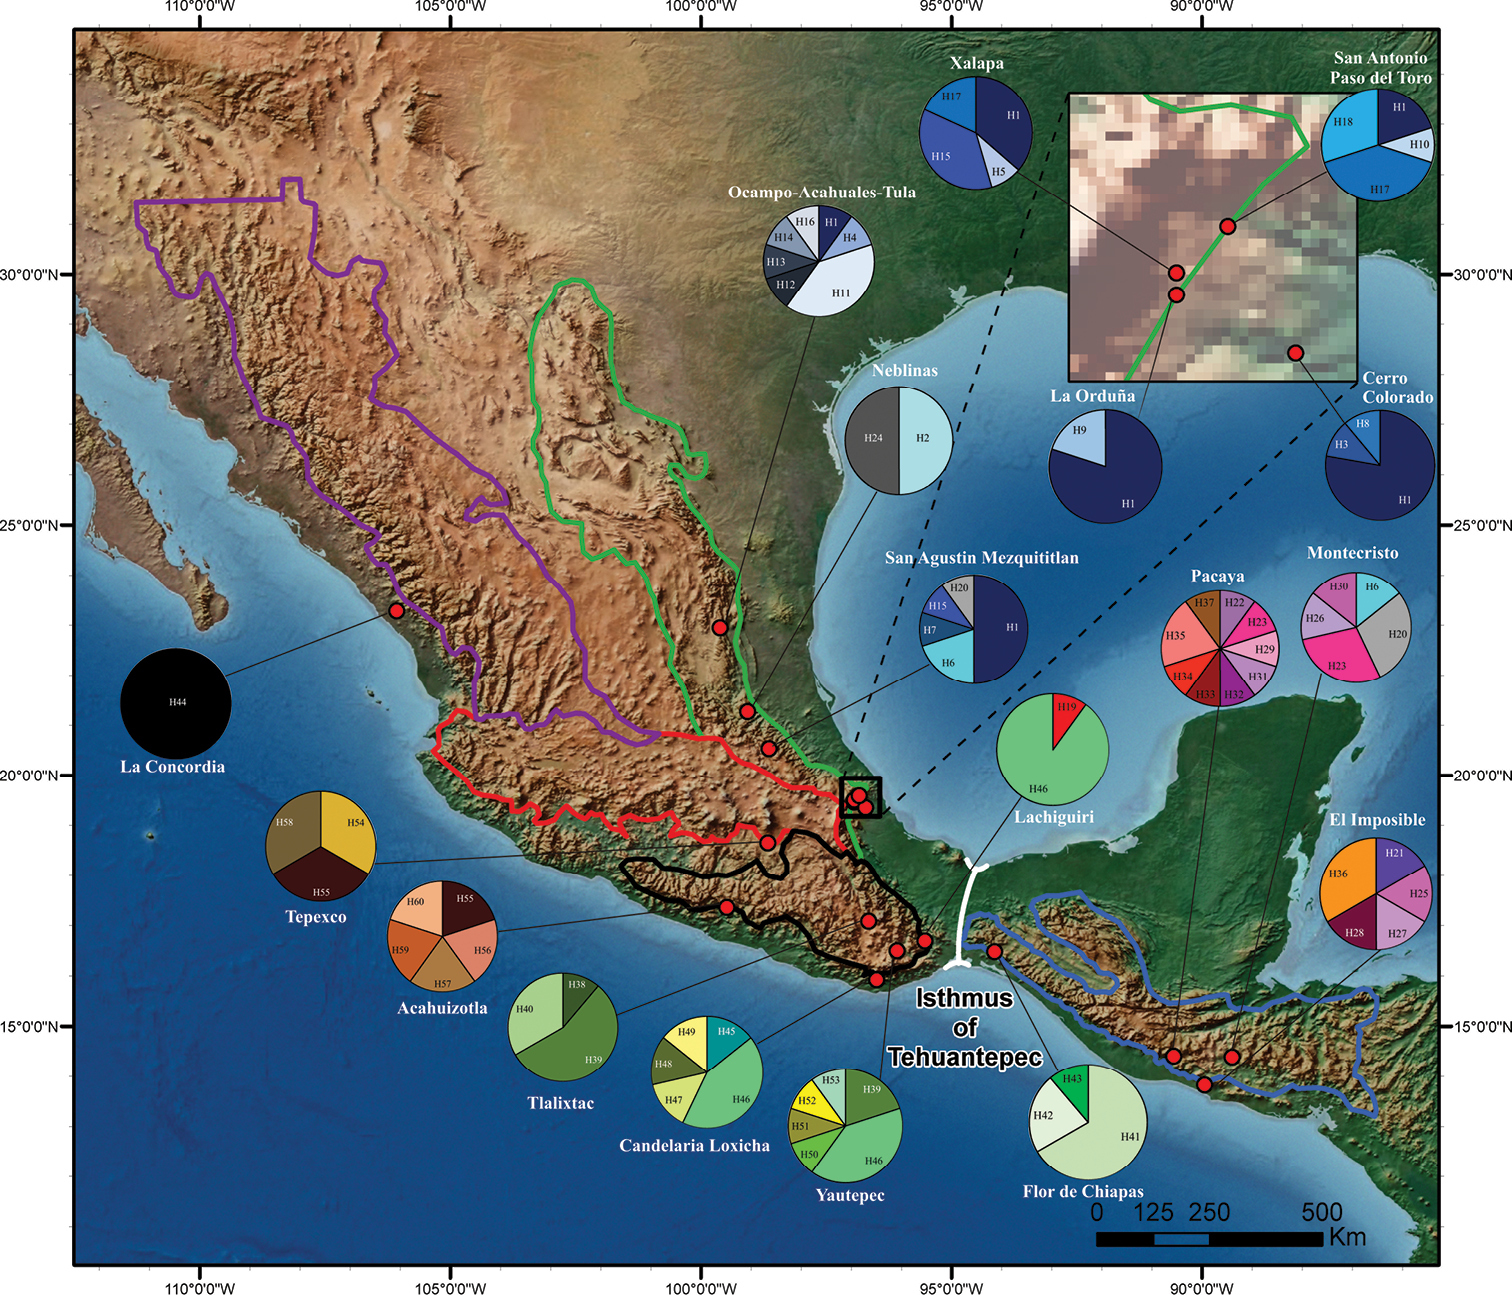
Distribution map showing the localities where individuals of Falagonia mexicana were sampled. Pie charts represent haplotypes sampled in each locality. Color on map indicates altitudinal changes every 500 m a.s.l. The polygons represent the main biogeographical regions: Sierra Madre del Sur (black), Sierra Madre Occidental (purple), Sierra Madre Oriental (green), Tierras Altas de Chiapas (blue), and Trans-Mexican Volcanic Belt (red). The white line represents the Isthmus of Tehuantepec. |