|
||
|
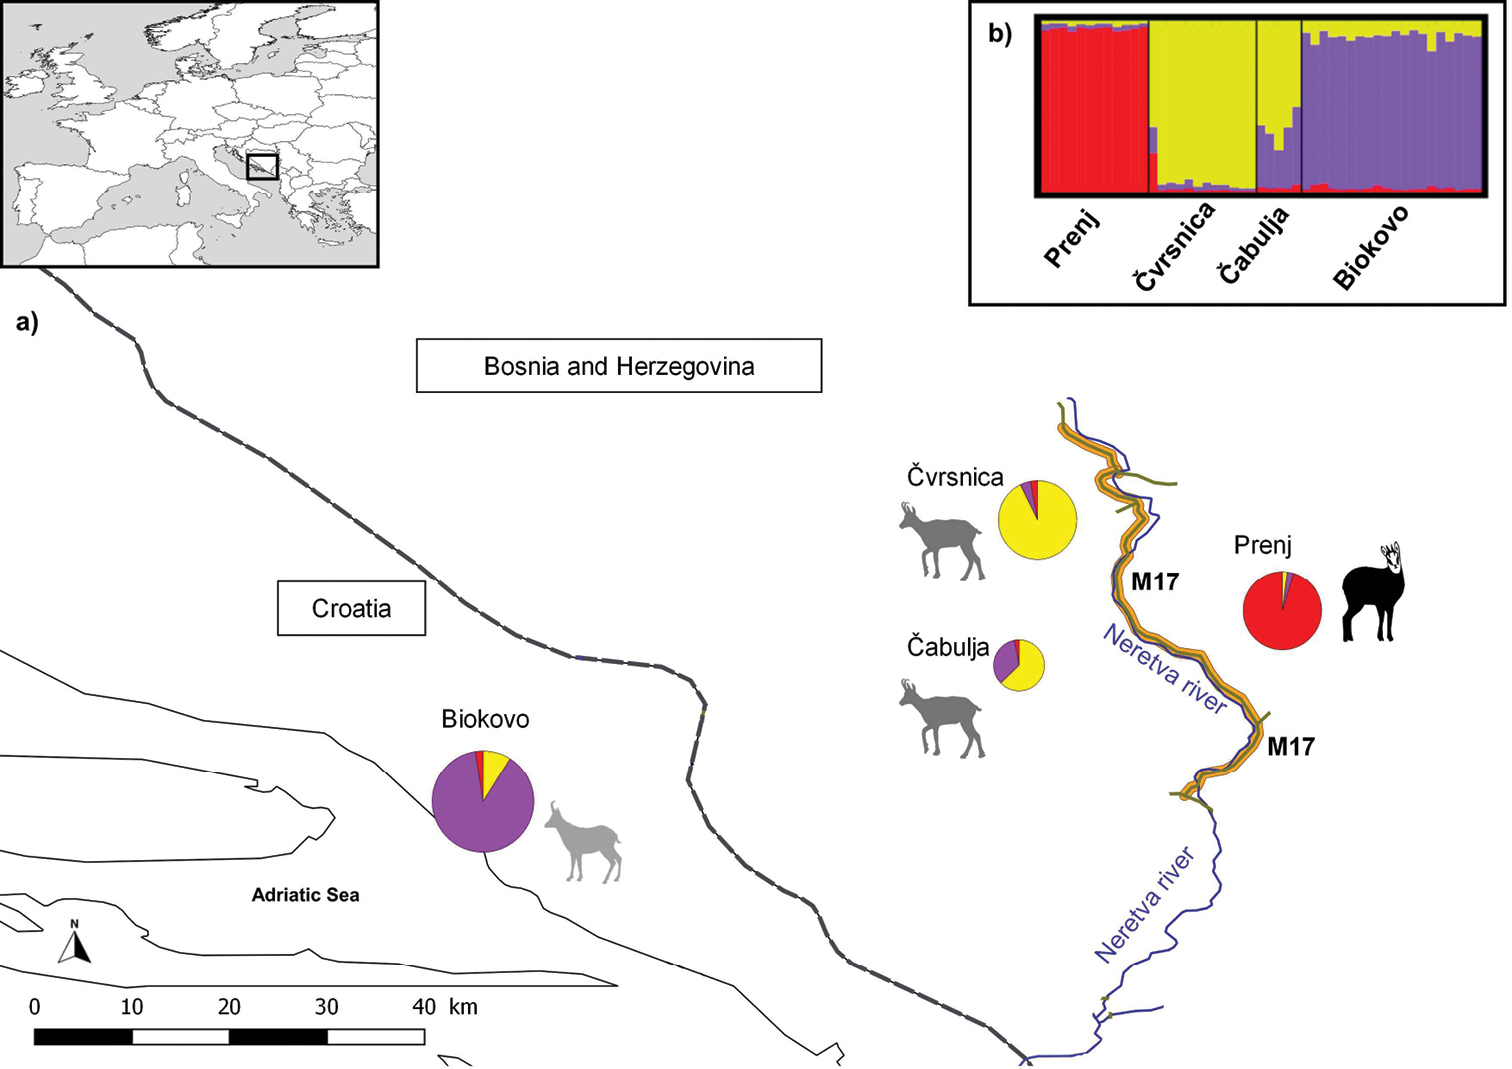
Results of the analysis of sixteen microsatellite loci in four Balkan chamois populations a geographical representation of results from STRUCTURE and GENELAND software. The pie charts show the results from STRUCTURE for K = 3. The different colours of the pie charts represent the proportions of each ancestral genotype per individual q (in %) in each of the four predefined Balkan chamois populations. The size of the pie charts indicates the number of samples collected at each location. The different shapes and colours of the chamois silhouettes represent the results of the spatial analysis under uncorrelated frequency model performed in GENELAND. The three spatial clusters are shown, while the assignment to the fourth ghost cluster was not shown because no individuals were assigned to it (see text for details). The dashed line indicates the national border, while the state road M17 in Bosnia and Herzegovina is marked with an orange line. The green lines represent connections with other main roads. The course of the river Neretva is marked by a blue line b genetic structure of the 49 Balkan chamois individuals analysed, shown as a bar plot from STRUCTURE at K = 3. Each vertical bar represents an individual, and the percentage of each colour corresponds to the percentage of the respective ancestral genotype. The studied populations are separated by a black line. |