|
||
|
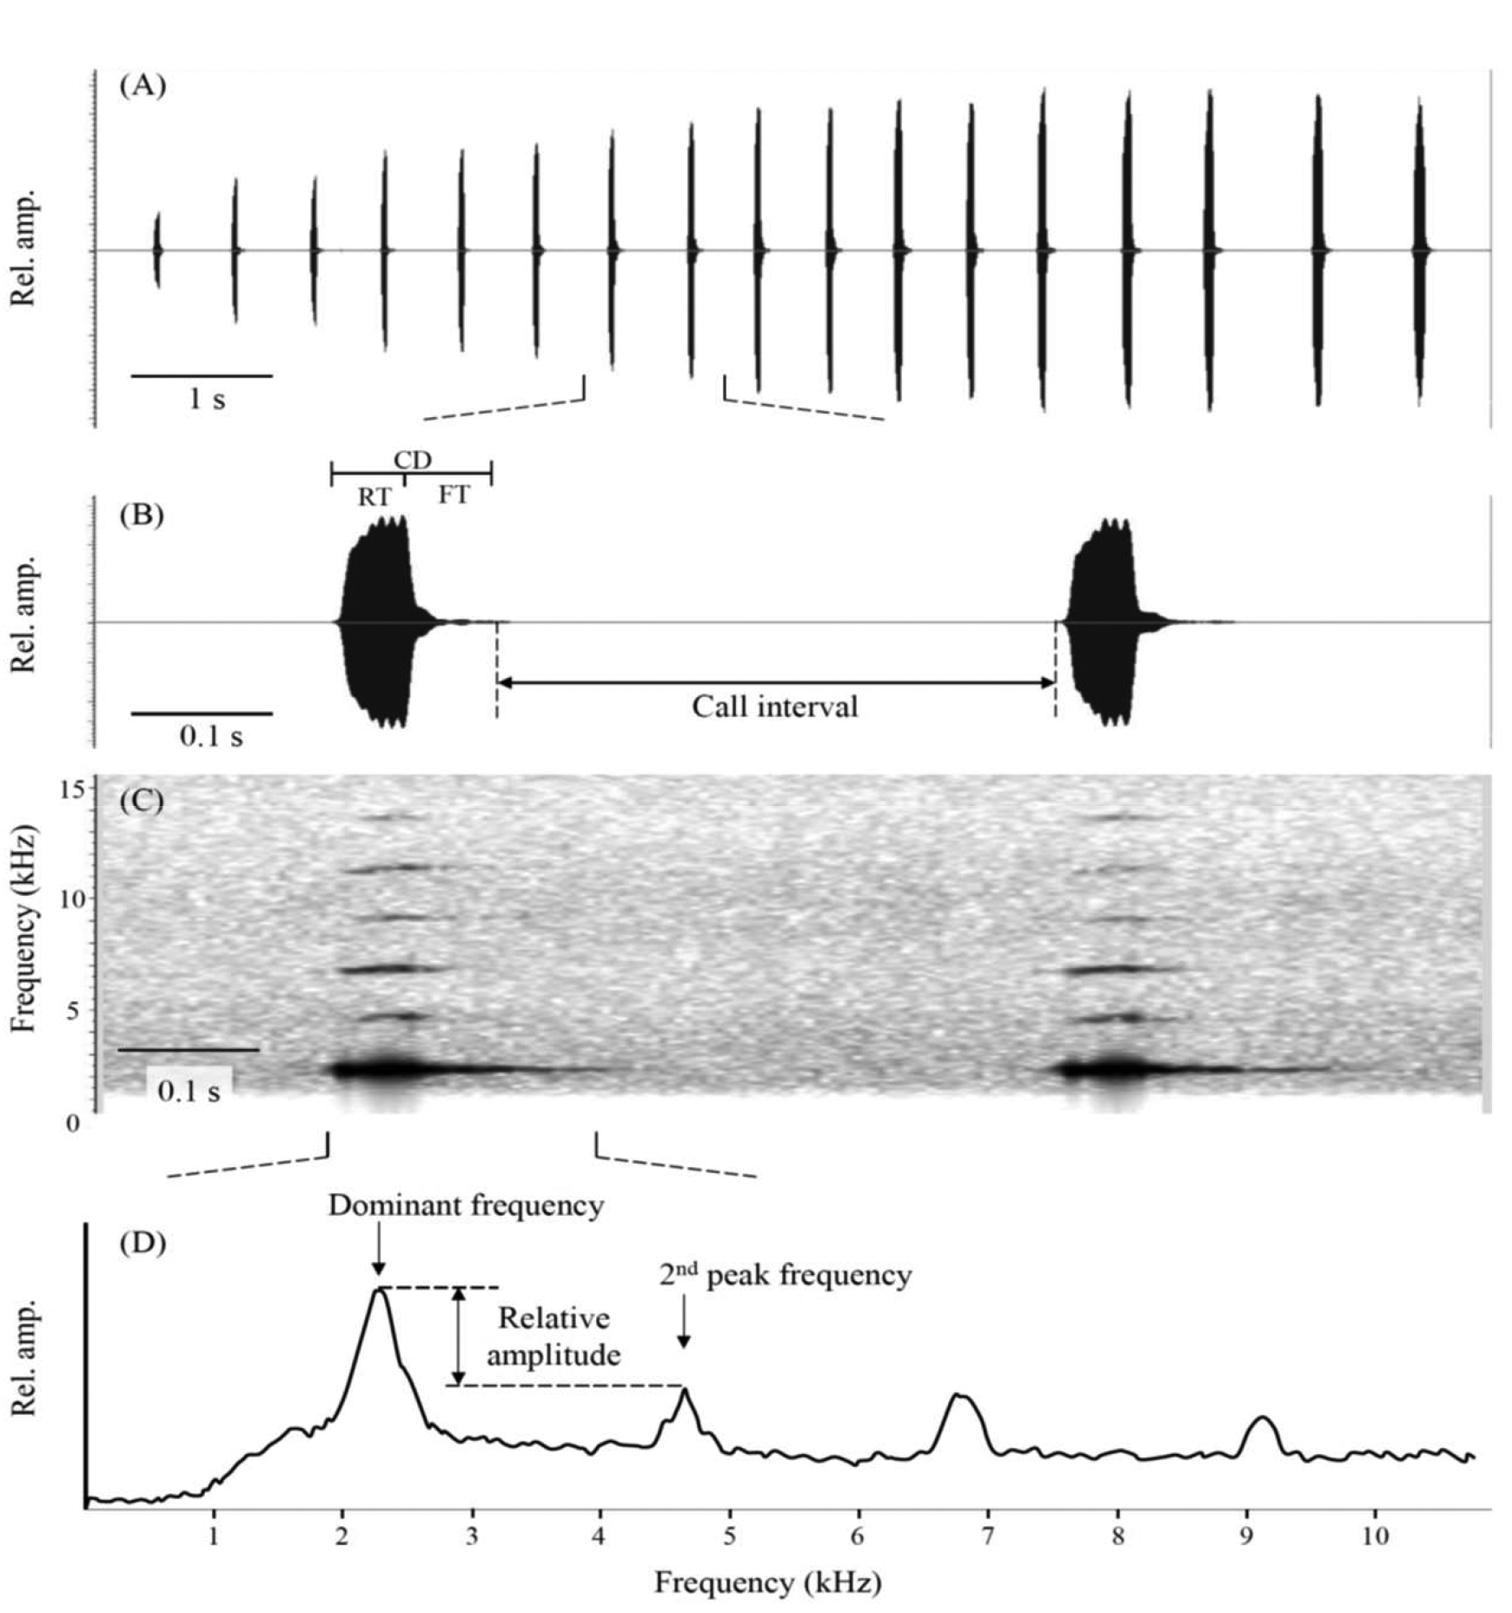
The call property measurements. This figure shows A the waveform of entire series of a consecutive call B the waveform C the spectrogram of two calls and D the spectral power distribution of a single call from the new Kurixalus population from Zhejiang, China. We extracted the number of calls in a bout, call interval, call duration (CD), rise time (RT), fall time (FT), dominant frequency (here also the max frequency), secondary peak frequency and the relative amplitude of two peaks. |