|
||
|
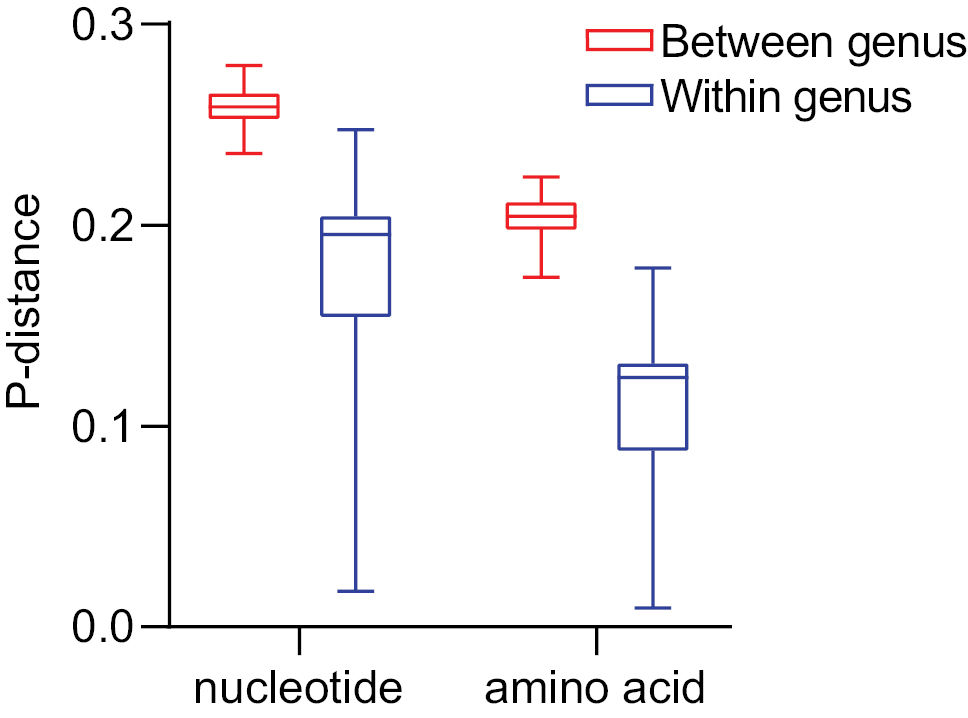
Genetic distance within and between genera. Each boxplot represents the p-distance based on the nucleotide and the amino acid datasets from 13 mitochondrial PCGs. The lower horizontal bar represents the smallest observation, the lower edge of the rectangle represents the 25 percentile, the central bar within the rectangle represents the median, the upper edge of the rectangle represents 75 percentile, and the upper horizontal bar represents the largest observation. |