|
||
|
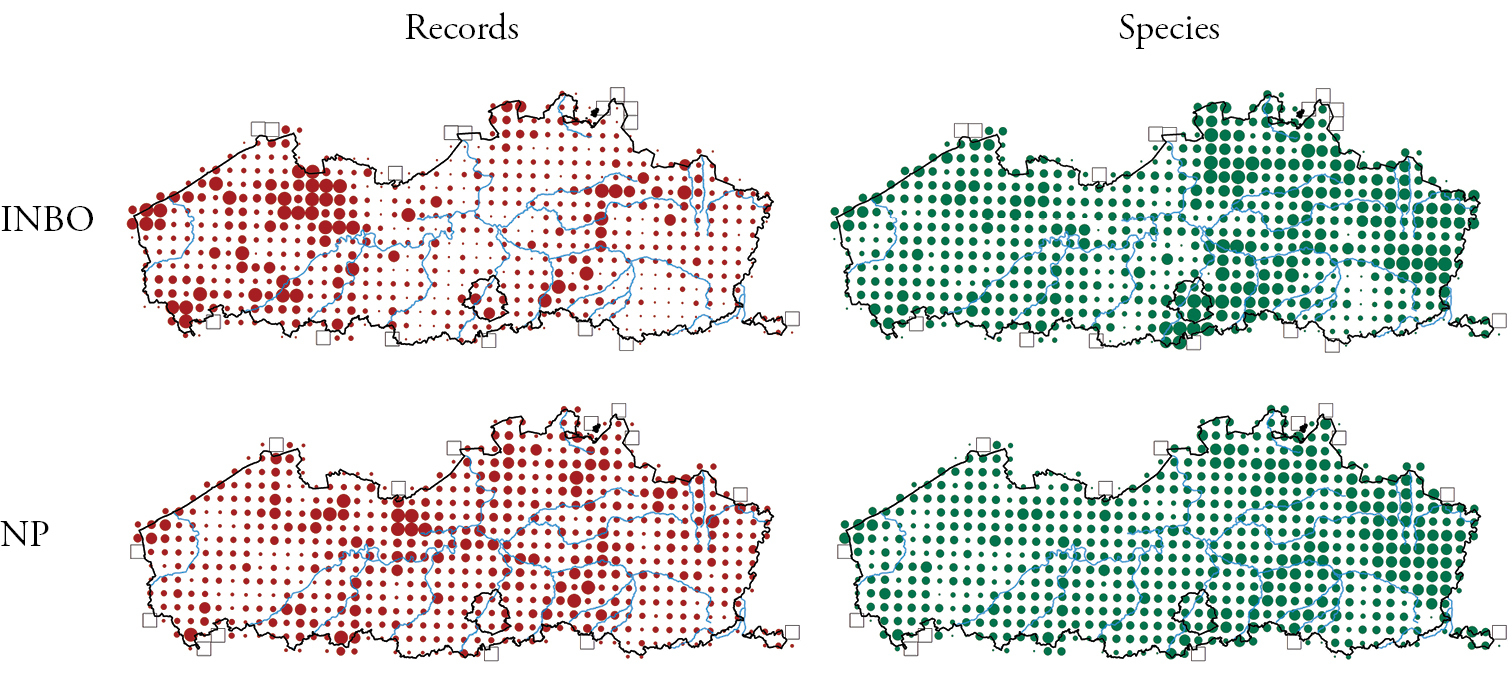
Number of records (left, increasing dot sizes represent 100, 1000, 2500, 5000 and >5000 records per grid cell) and species (right, increasing dot sizes represent 10, 20, 30, 40 and >40 species per grid cell) in the INBO dataset (1830–2014, top row) and in the NP dataset (1981–2014, bottom row). Squares indicate grid cells without records. |