|
||
|
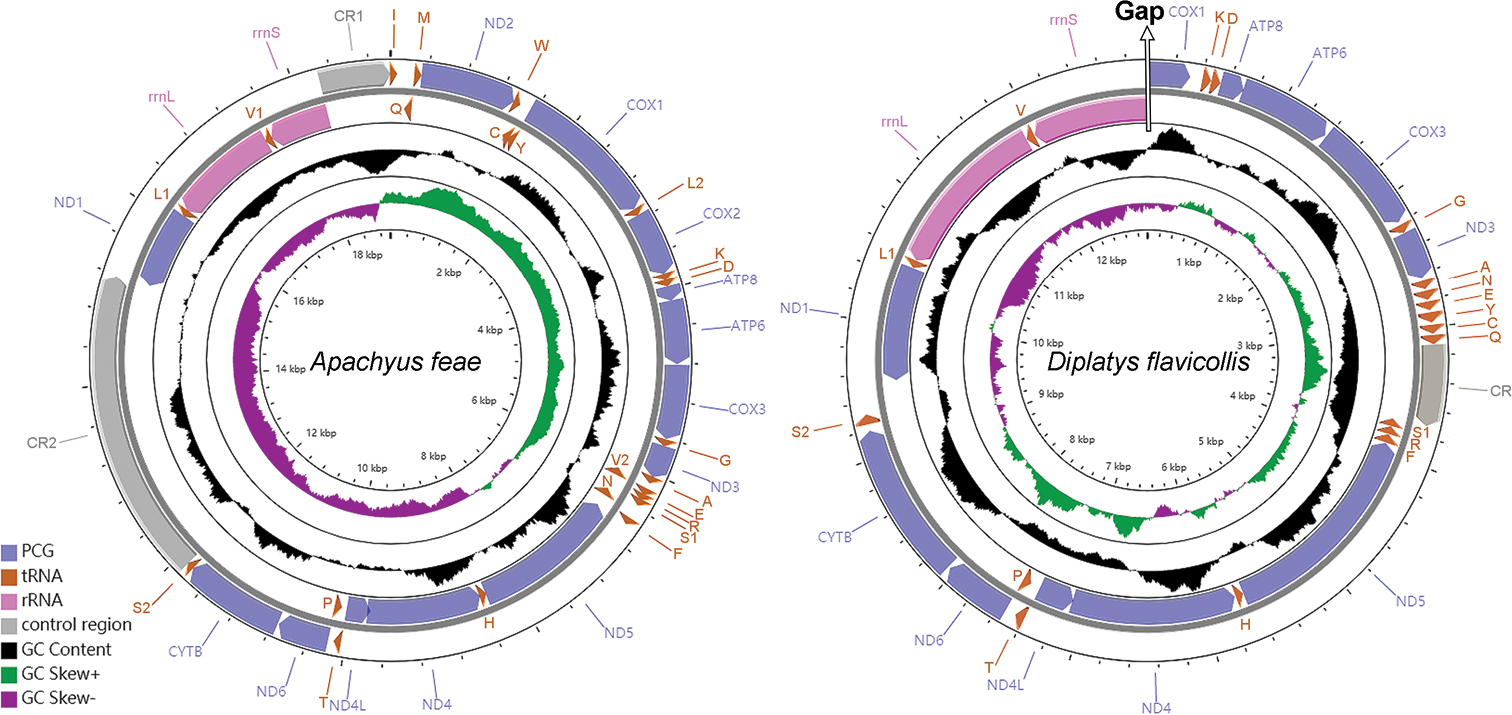
Mitochondrial maps of Apachyus feae and Diplatys flavicollis. Genes outside the map are transcribed clockwise, whereas those inside the map are transcribed counterclockwise. Names and other details of the genes are listed in Tables 2 and 3. The inside circles show the GC content and the GC skew. GC content and GC skew are plotted as the deviation from the average value of the entire sequence. |