|
||
|
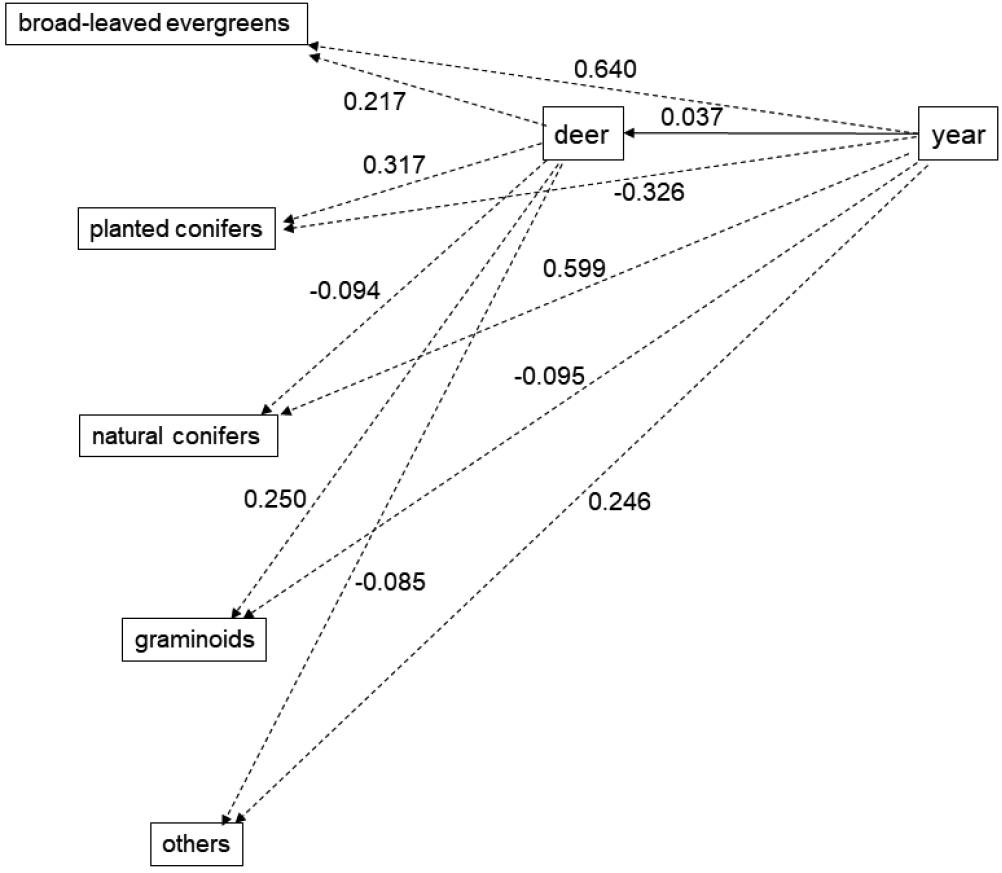
Directed acyclic graph depicting the year and deer density that are not important in the path analysis of serow food habits. Solid lines: 95% credible intervals (CIs) whose path coefficients do not overlap with zero (see Table 2). Dash lines: coefficients whose 95% CIs overlap with zero. The larger the absolute value of the coefficient, the stronger the effect. |