|
||
|
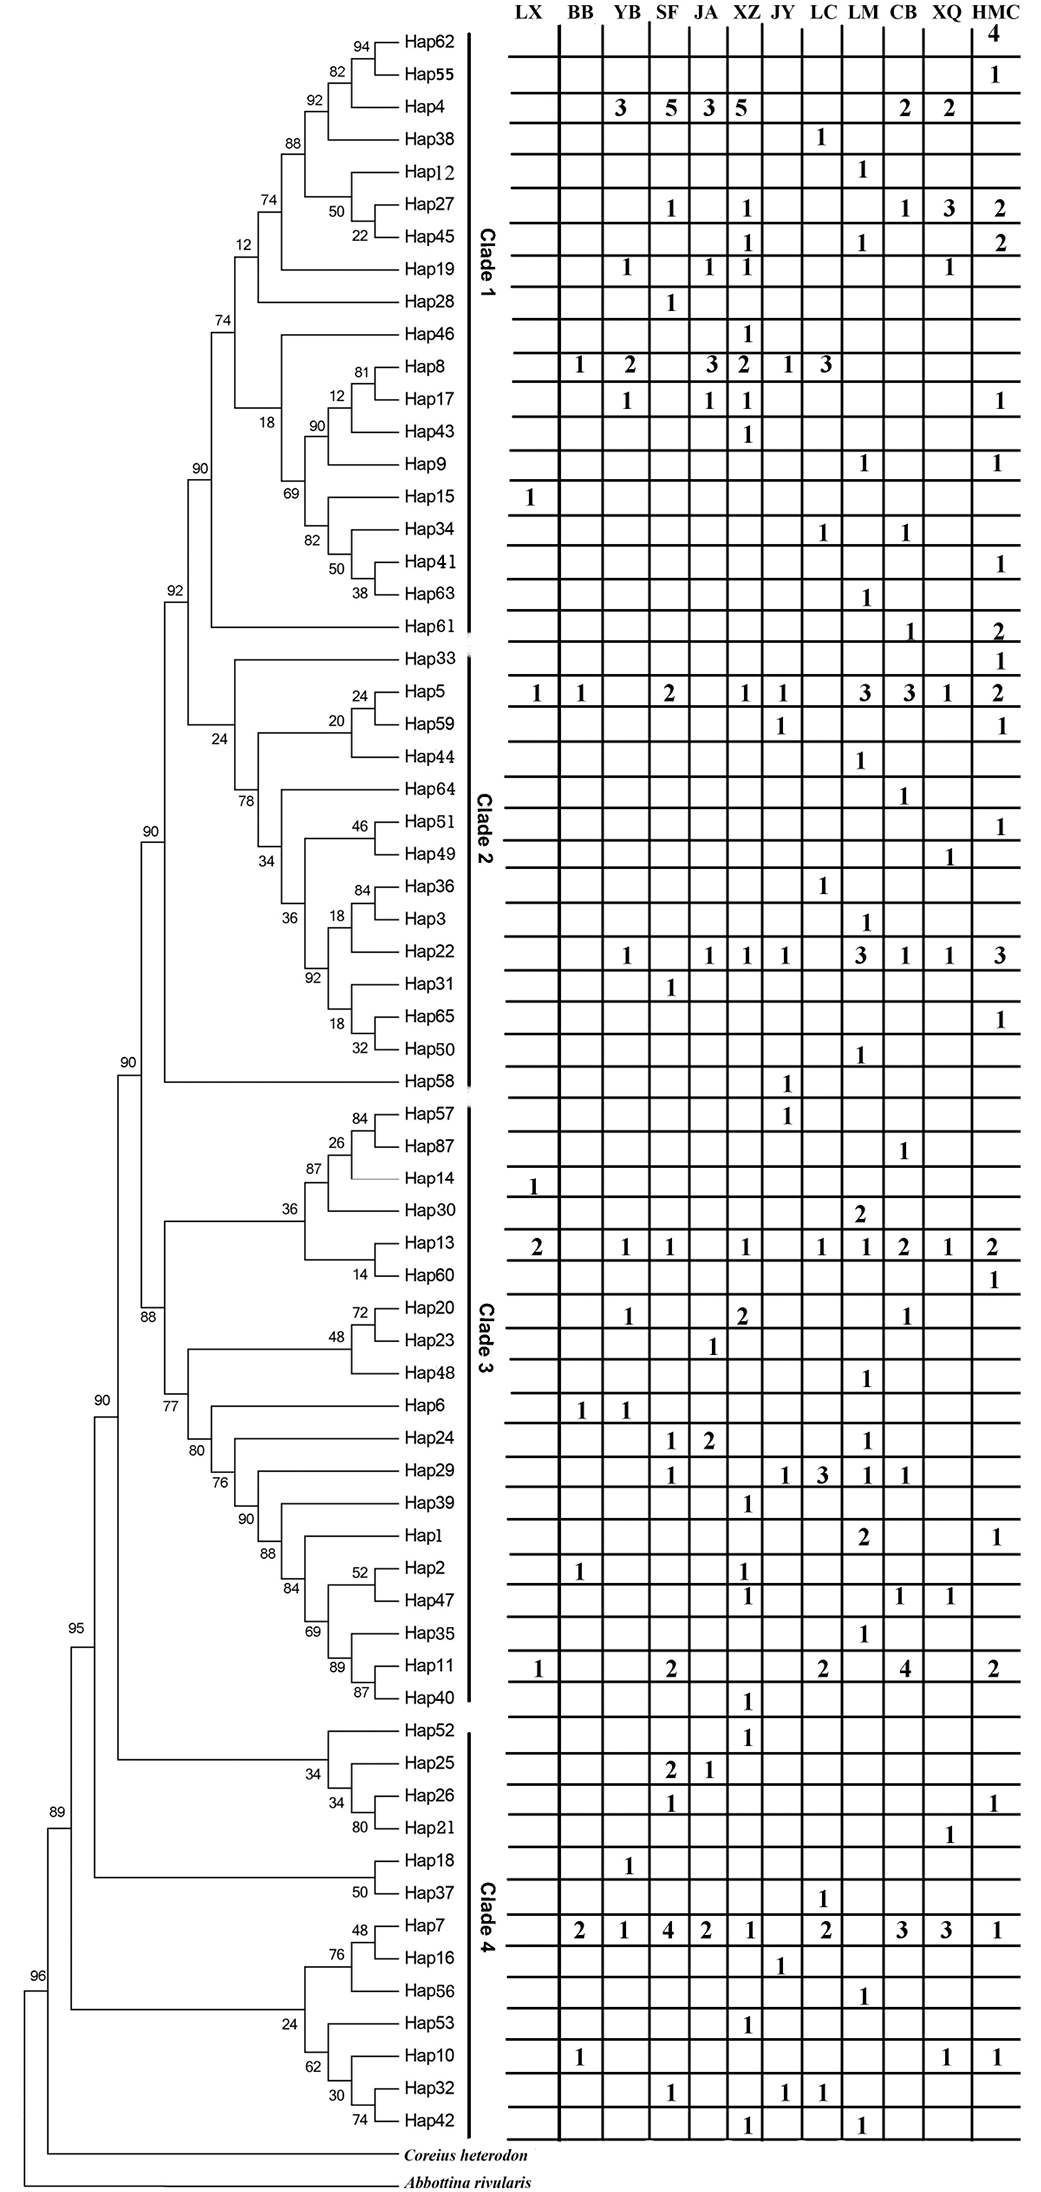
Phylogenetic trees of the mtDNA control region haplotypes in C. guichenoti reconstructed with Bayesian inference. Numbers at nodes represent Bayesian posterior probabilities and neighbor-joining tree. At the right side of the figure, the numbers represent the total of individuals from different sampling locations in each haplotype. |