|
||
|
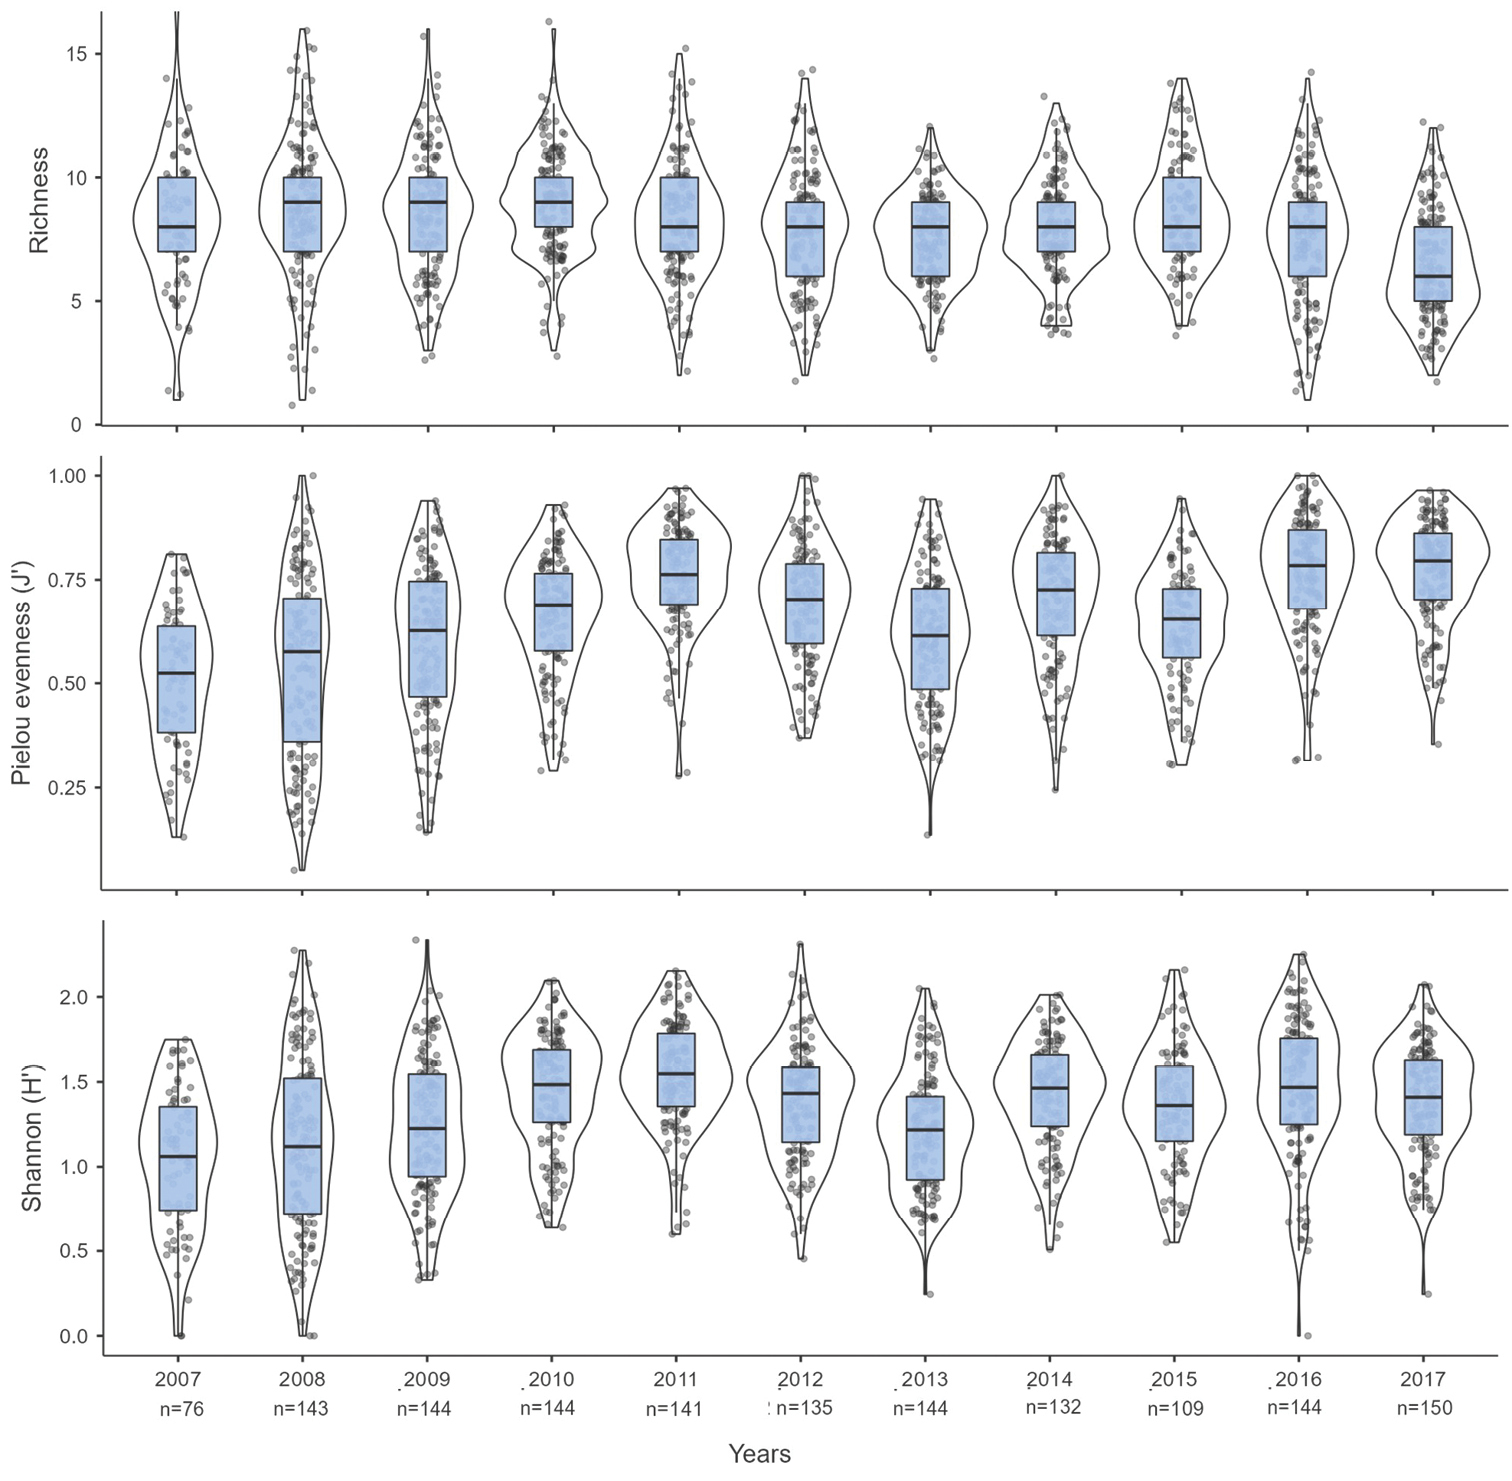
Ecological indicators of fish species richness (S), Shannon-Wiener diversity (H‘), and Pielou evenness (J’) by transect. The inferior and superior sides of each blue rectangle represent the first and third quartiles (P25 and P75), respectively, and the median is represented by the horizontal black line. The points indicate the values of each data point, while the line surrounding each box plot shows the probability density. |