|
||
|
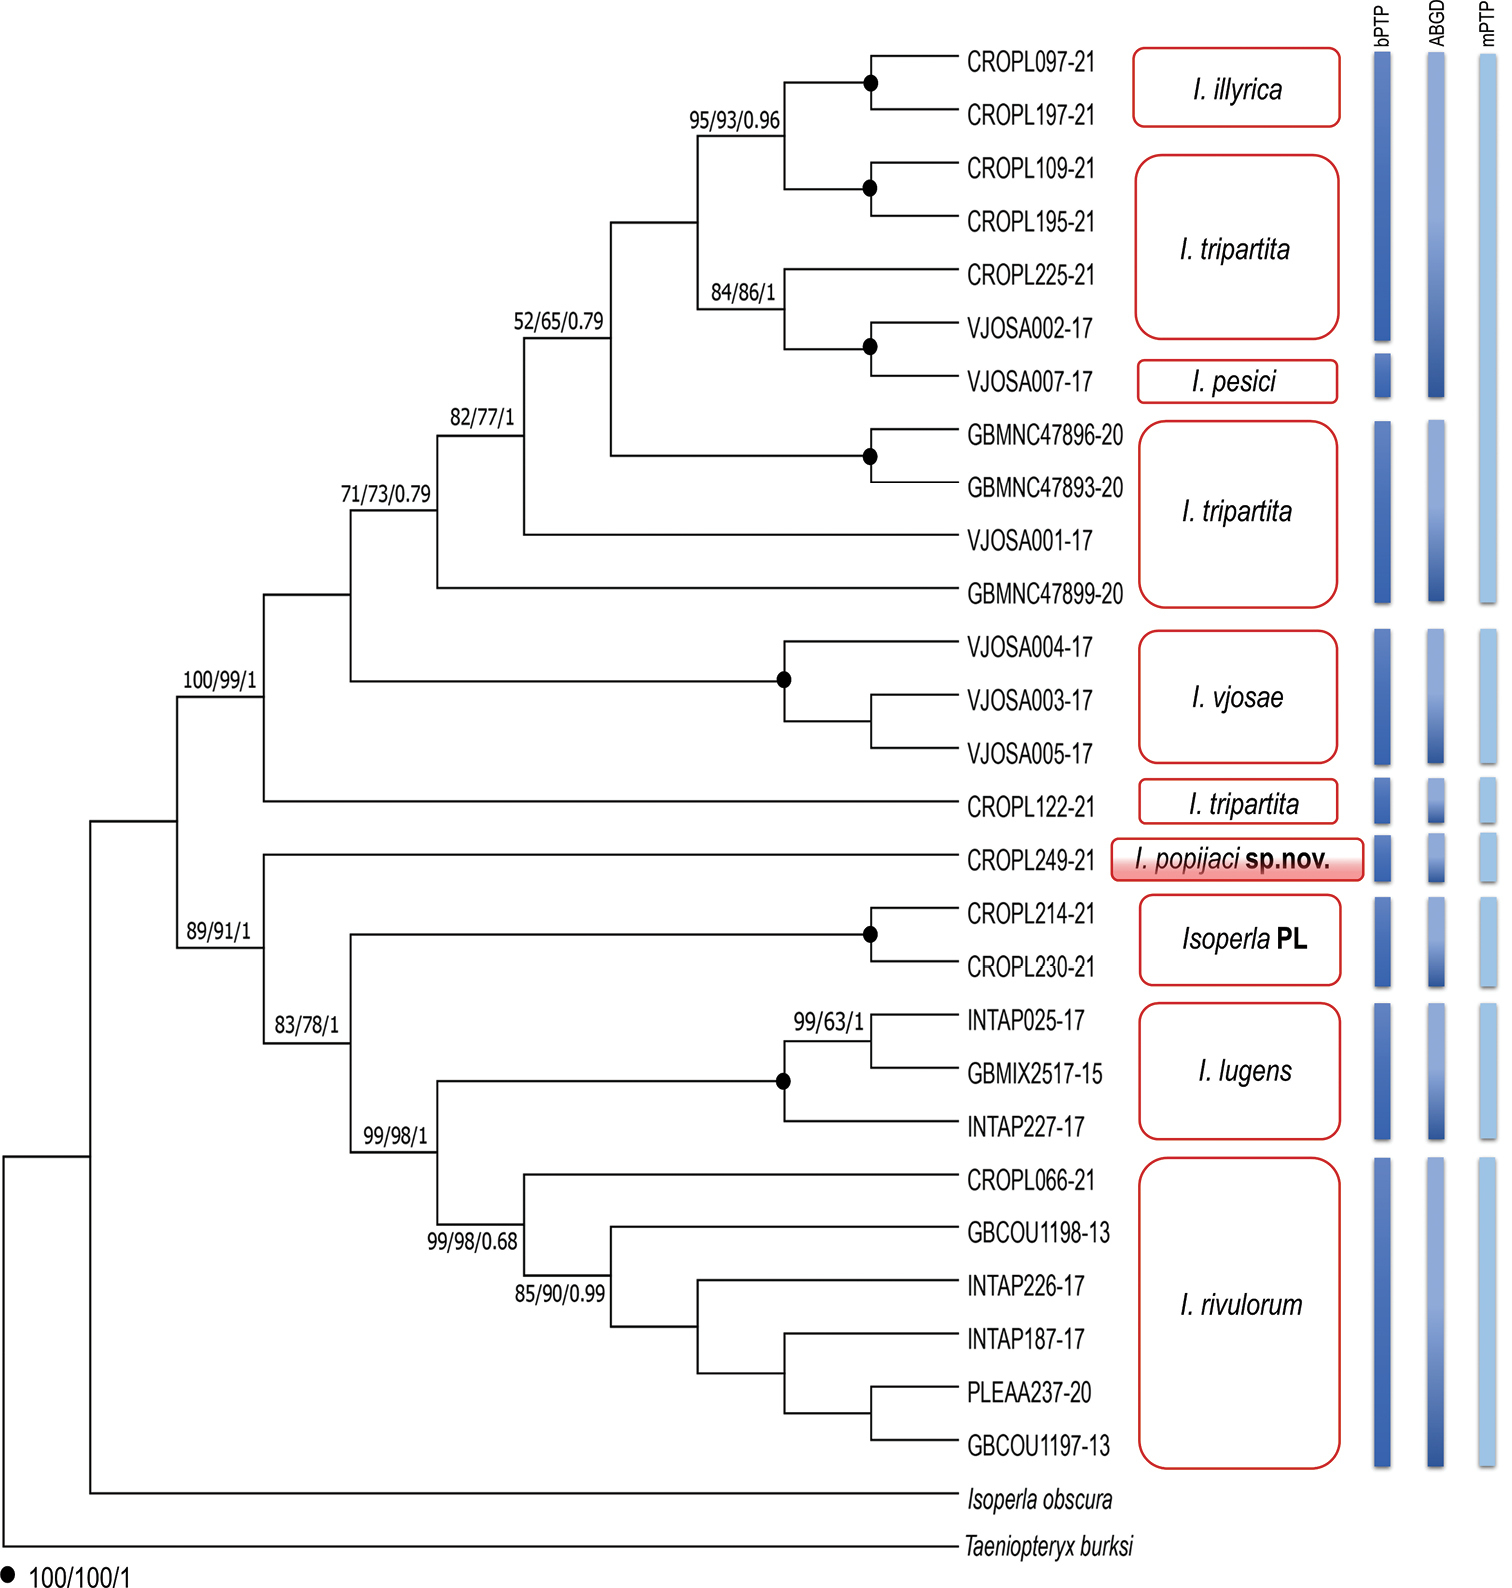
Maximum Likelihood cladogram, based on the analysis of the COI haplotypes of Isoperla species. Numbers at the nodes indicate Neighbour-Joining (NJ), Maximum Likelihood (ML) bootstrap support values (BS) and Bayesian posterior probabilities (BPP), respectively. The results of species delimitations are represented with the vertical bars, from left to right, indicate the OTUs inferred by bPTP, ABGD and mPTP. “Isoperla PL” indicates additional separate lineage obtained in this study. Terminal codes present BOLD/GenBank Process ID, as in Table 1. |