|
||
|
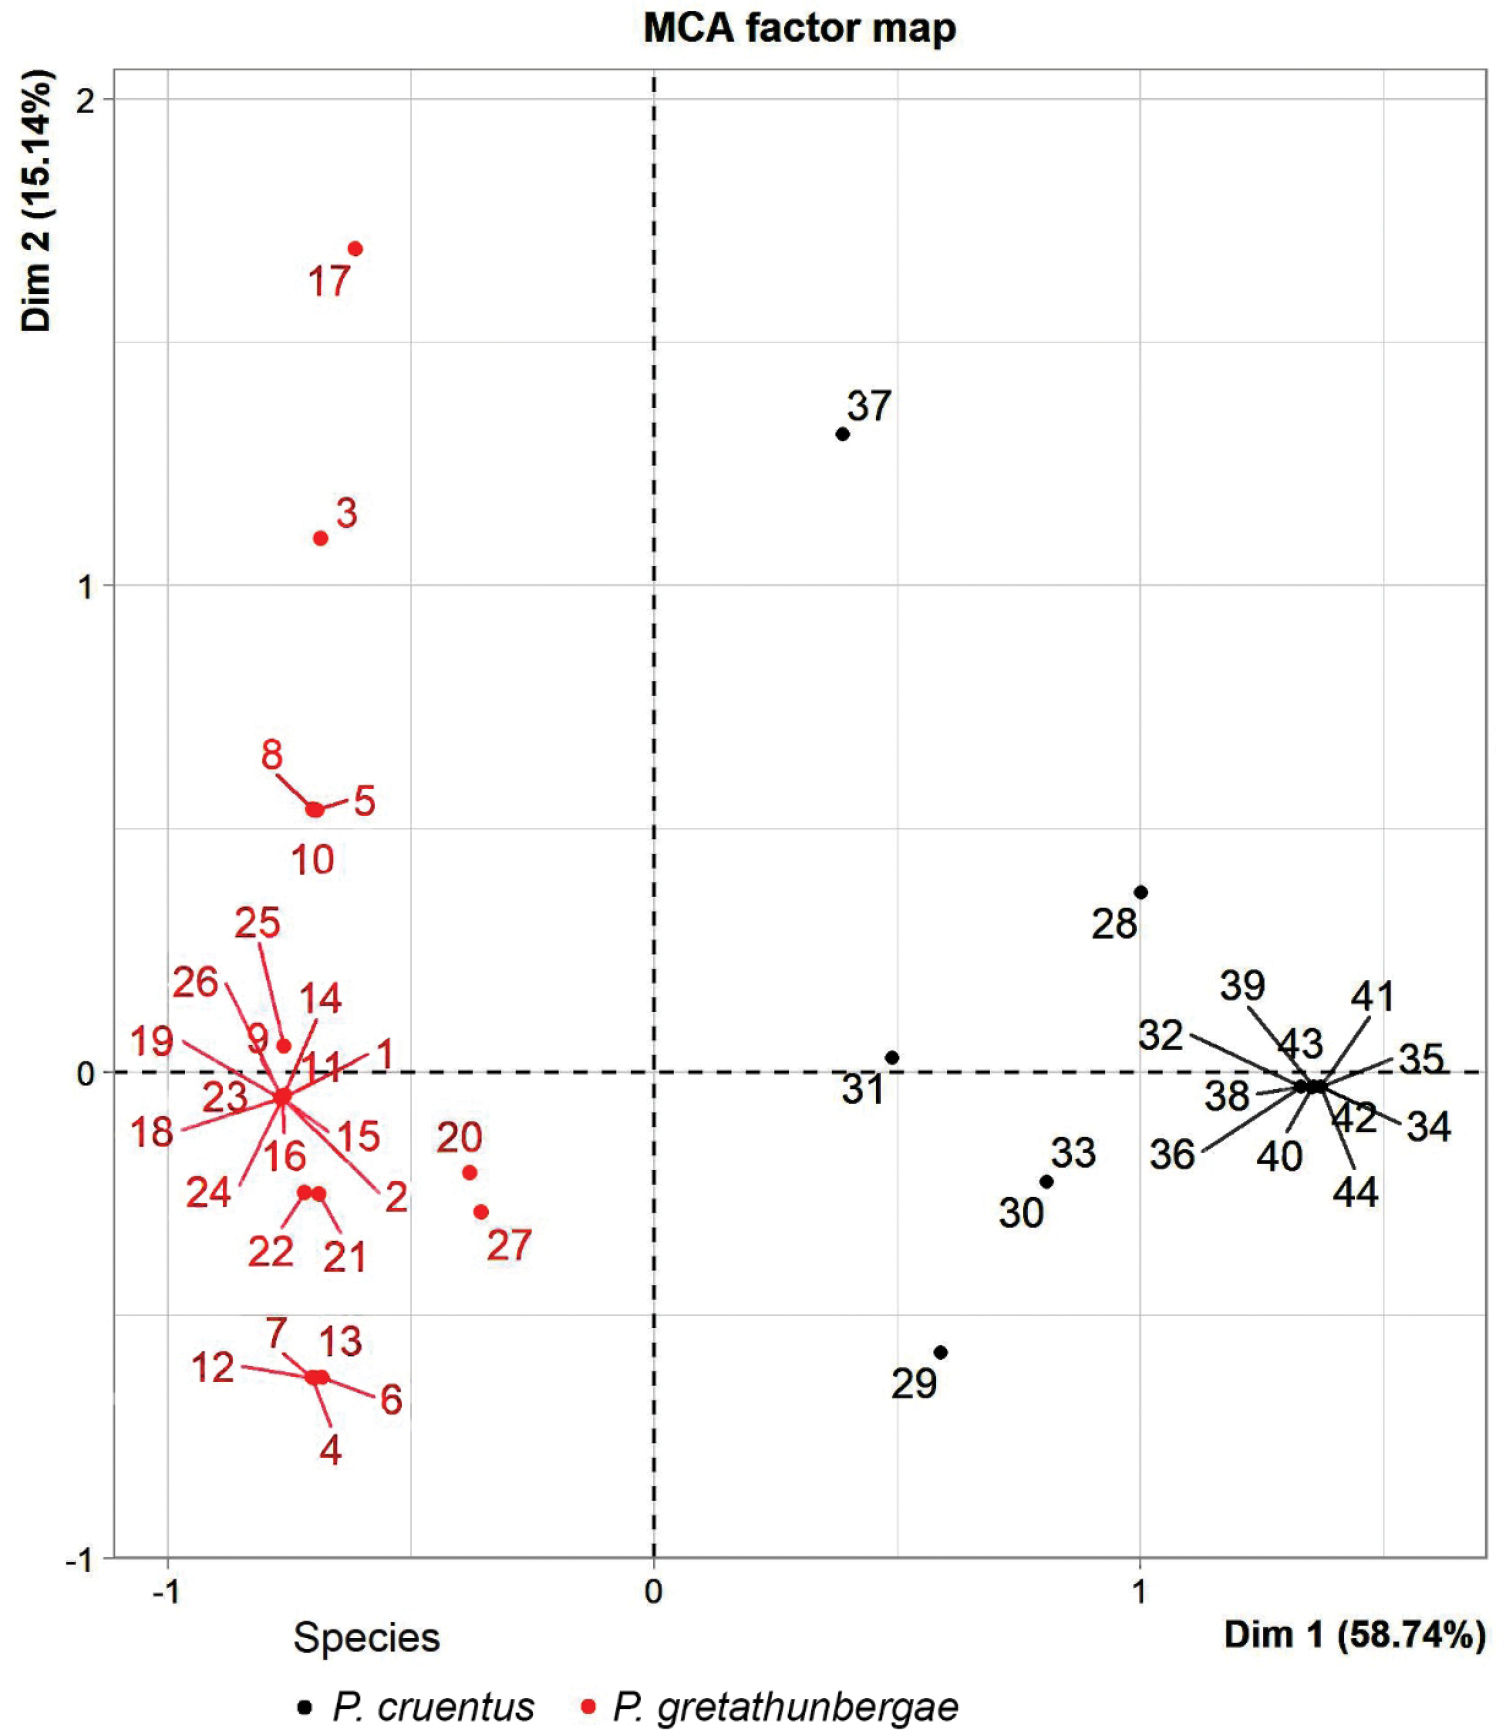
Map of the Multiple Correspondence Analysis (MCA) of P. gretathunbergae sp. nov. (red dots) and P. cruentus (black dots): Number labels for individual frog with lines pointing to specimen location on the map. Following correlation ratio (Dimension 1/Dimension 2) resulted from the MCA: iris coloration 0.937/0.001; iris reticulation 0.933/0.637; upper eyelid tubercle 0.751/0.331; upper lip coloration 0.735/0.326; groin coloration 0.852/0; ventral coloration 0.810/0.001. The qualitative scoring of the variables and its species-specific expression is explained in the methods. |