|
||
|
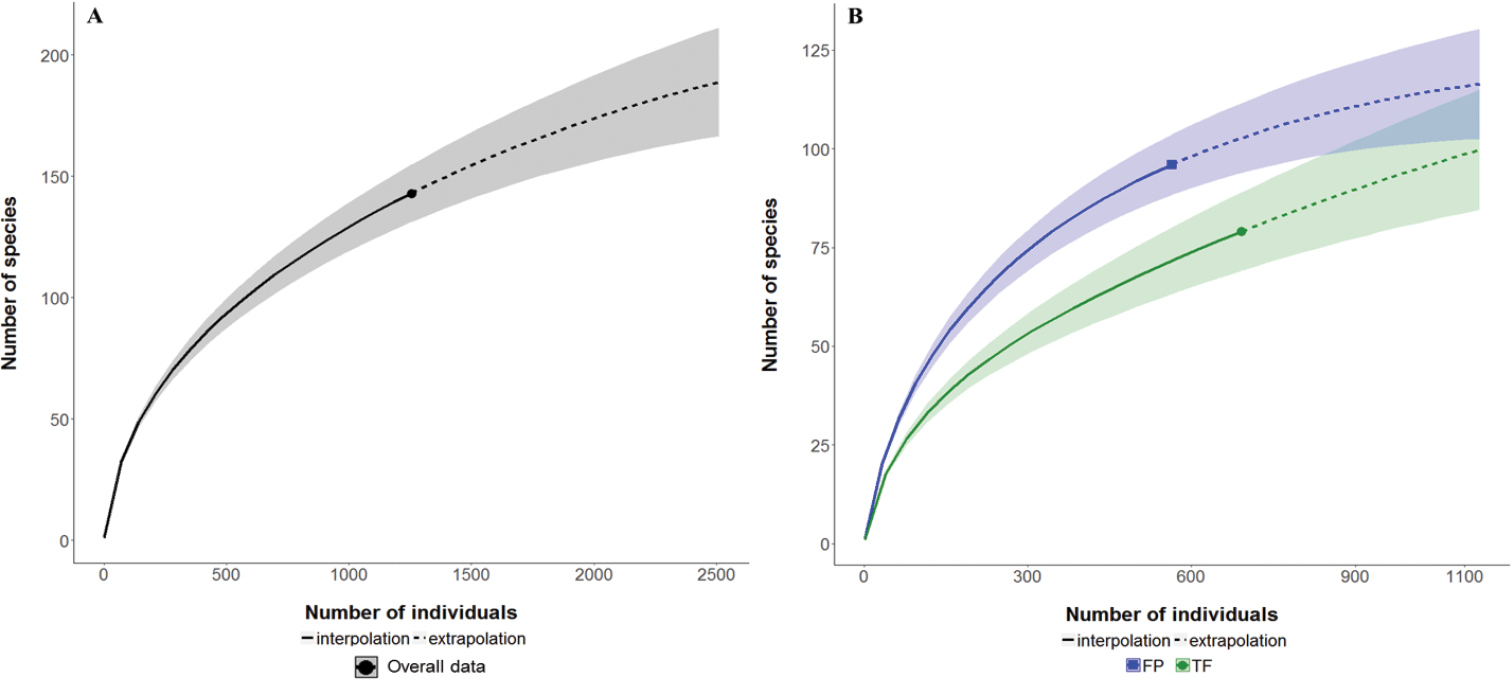
Carabid beetle rarefaction curves. Interpolation (solid lines) indicated by filled point markers represents the sampling extent of the current study. Extrapolation curves based on the Chao1 nonparametric diversity estimator are shown (dashed lines). Shaded areas depict unconditional 95% confidence intervals A the overall dataset with both forest types combined and richness extrapolated to n = 2,510 (twice the number of individuals collected) B rarefaction curves for FP forests (blue square) and TF forests (green circle) with sample size extrapolated to n = 1,128 (twice the number of individuals collected in FP forests). FP forests (96 ± 8.0) were significantly more species rich than TF forests (72 ± 8.1) at the rarefied sample size (n = 564). The extrapolated rarefaction curves suggest the difference in cumulative morphospecies richness between FP and TF will decrease as sample size increases. |