|
||
|
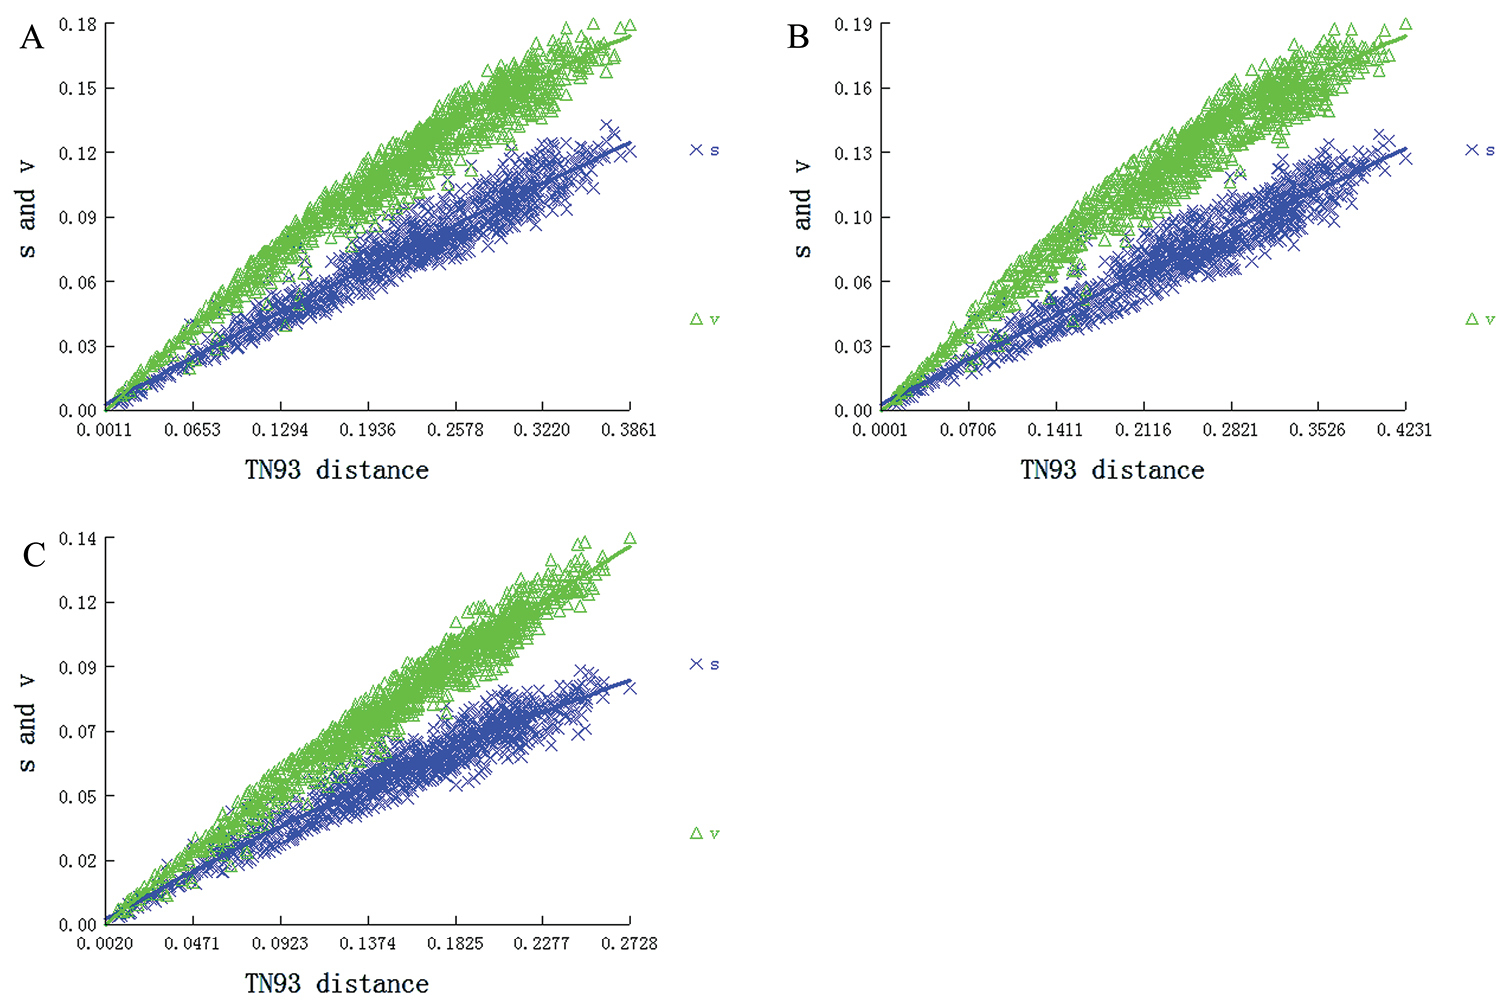
Substitution patterns of PCGRNA, PCG and PCG12 matrices. The graphs represent the increase in TN93 distance A PCGRNA saturation plot B PCG saturation plot C PCG12 saturation plot. |
|
||||||||
| Part of: Zhao L, Wei J, Zhao W, Chen C, Gao X, Zhao Q (2021) The complete mitochondrial genome of Pentatoma rufipes (Hemiptera, Pentatomidae) and its phylogenetic implications. ZooKeys 1042: 51-72. https://doi.org/10.3897/zookeys.1042.62302 |