|
||
|
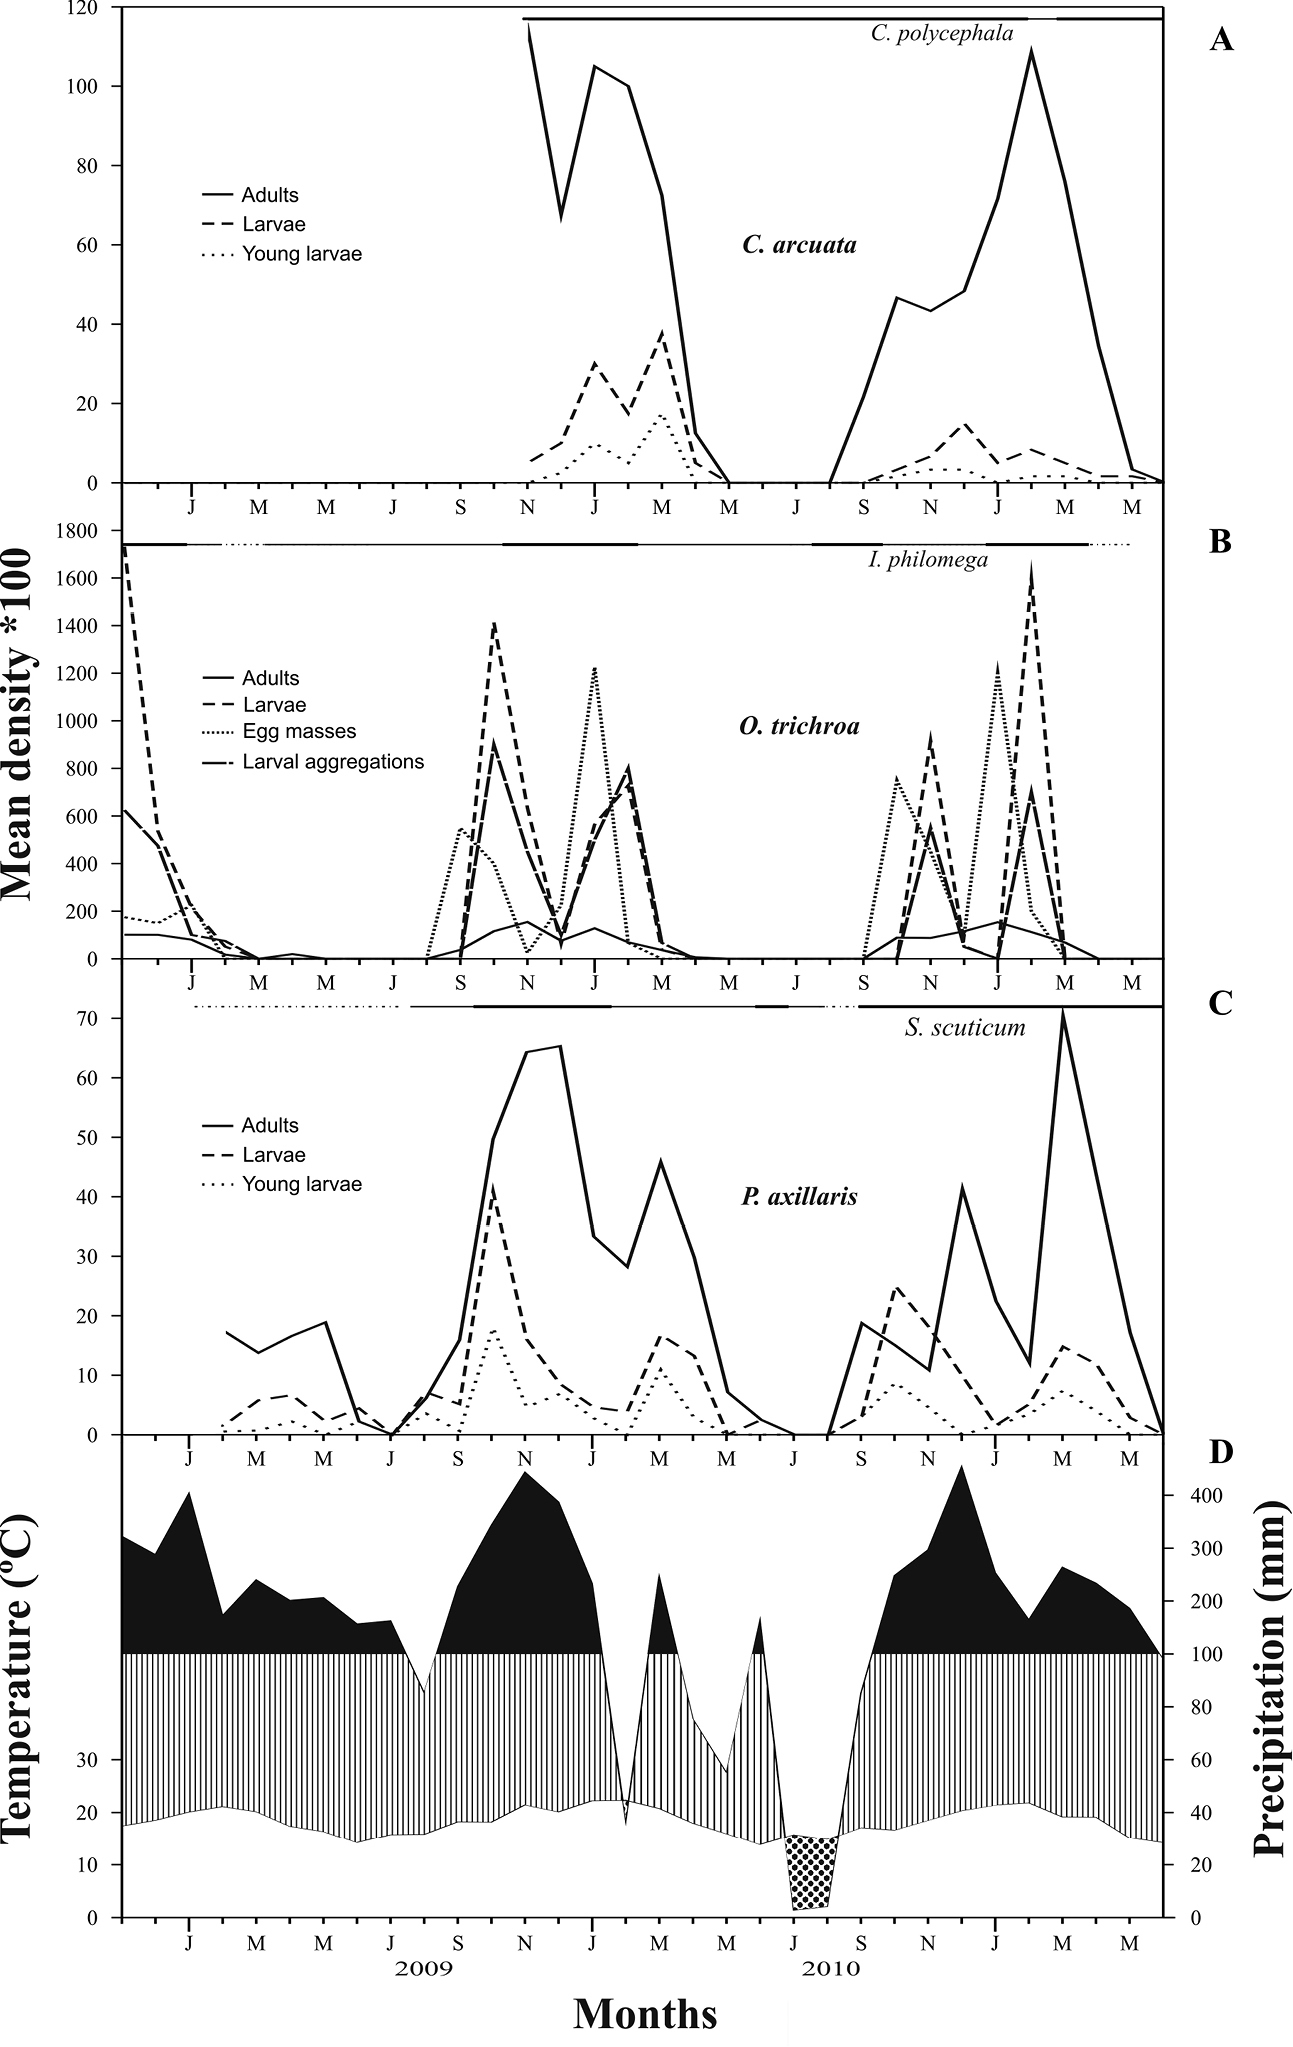
Population phenology of C. arcuata (A), O. trichroa (B) and P. axillaris (C) in a montane forest at 1000 m altitude between November 2008 and June 2011. A climatic diagram (data obtained from a meteorological station in the same site) is given for the same period as surveys (D). Dotted area = dry period; striped area = humid period; black area = super-humid period. The line above species fluctuations represents the percentage of host plant with new leaf shoots, the dotted line being < 25% of plants in this phase; fine line between 25% and 75%; thick line > 75%. |