|
||
|
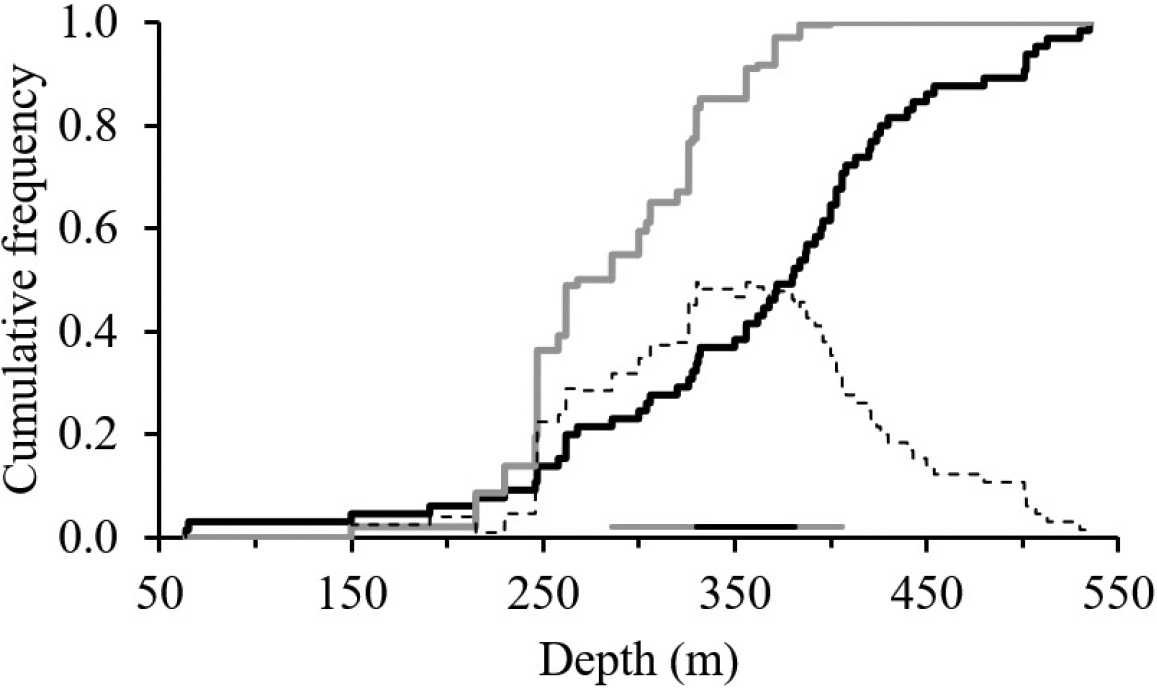
Cumulative density functions (CFDs) of the depth (f(t)) and the weighted biomass (kg/km2) of Solenocera acuminata. f(t) is shown by the thick black line, g(t) is shown by the thin grey line and the dotted line (d) is the absolute difference between g(t) and f(t). The depth preferences are shown as the grey and black straight lines. |