|
||
|
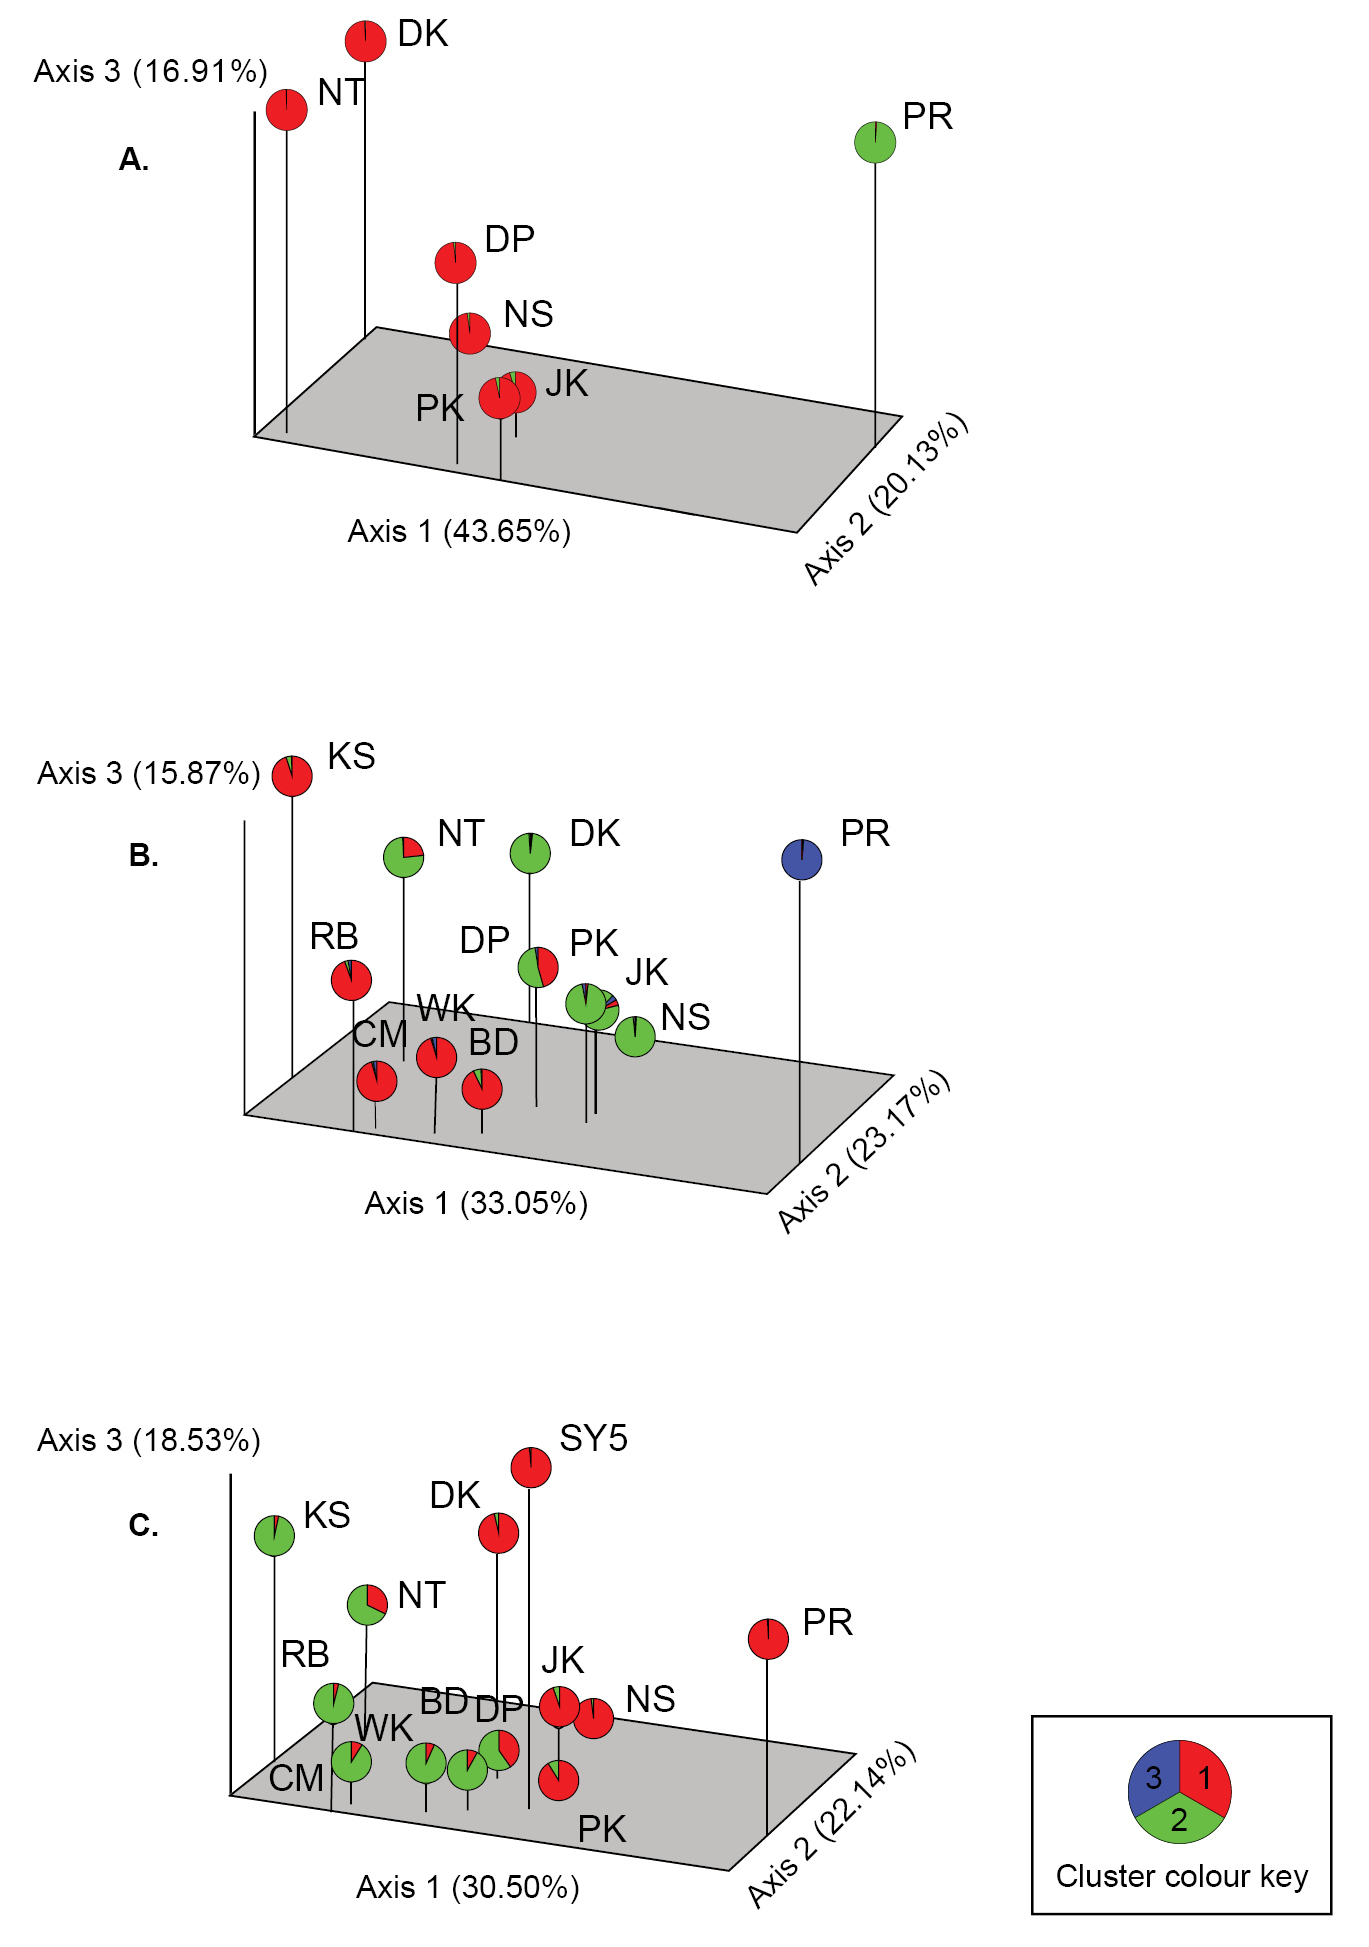
Three-dimensional plot of Principal Coordinate Analysis (PCoA) and STRUCTURE analysis. A the planes of the first three principal coordinates explain 43.65%, 20.13%, and 16.91% of total genetic variation, respectively, for seven B. carambolae populations using eight SSRs B the planes of the first three principal coordinates explain 33.05%, 23.17%, and 15.87%, respectively, for B. carambolae and B. dorsalis groups using eight SSRs C the planes of the first three principal coordinates explain 30.50%, 22.14%, and 18.53%, respectively, for the SY5 strain and wild populations using seven SSRs. Pie graphs, consisting of different colored sections, represent co-ancestor distribution of 185, 289, and 321 individuals in A two, B three, and C two hypothetical clusters, respectively. |