|
||
|
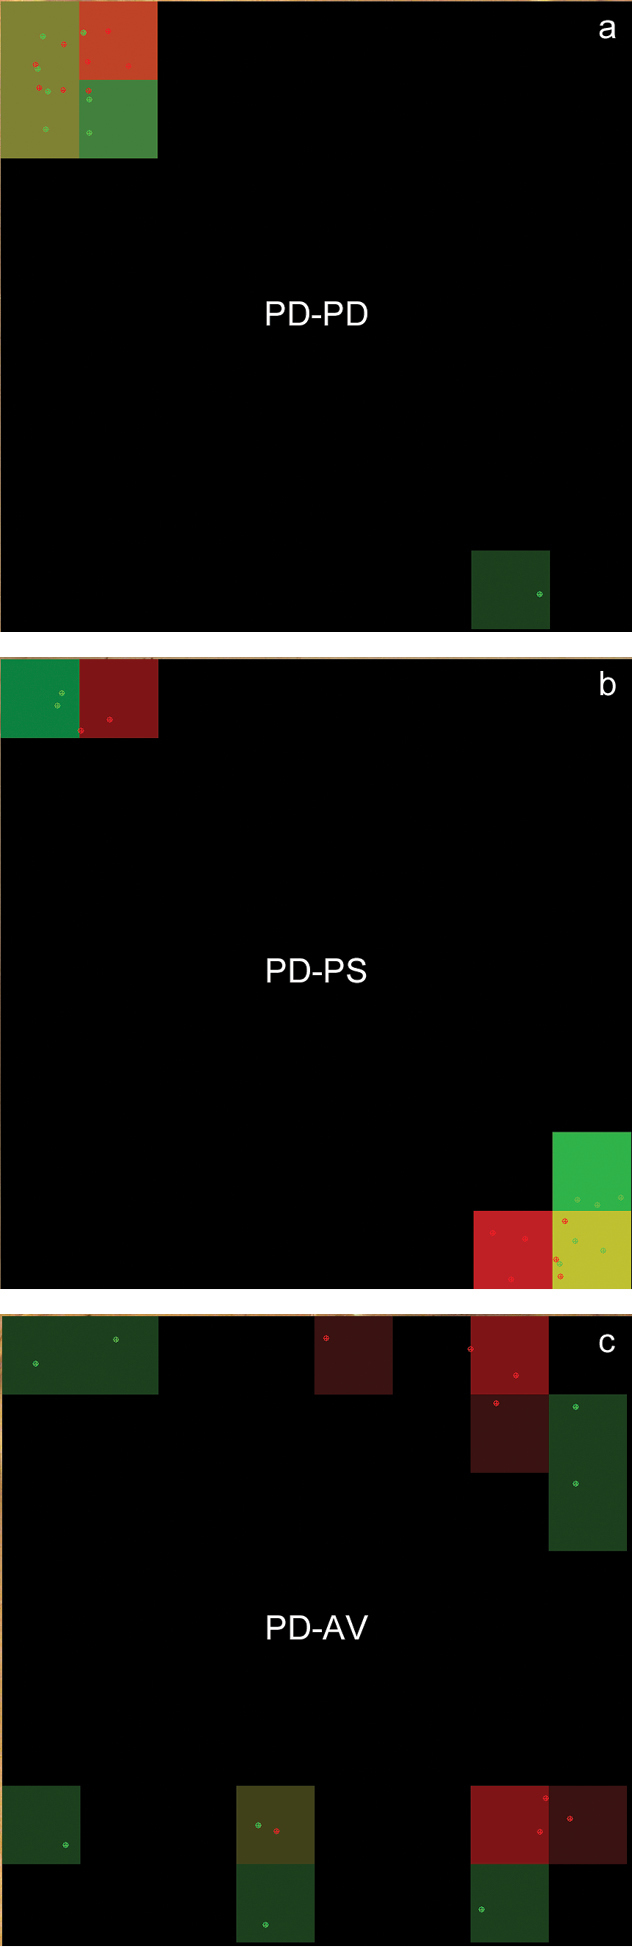
Spatial distribution in woodlice. Graphic outputs of spatial distribution patterns obtained in three configurations with monospecific or bispecific populations including two groups of eight individuals: a PD-PD: The two groups are P. dilatatus (red and green) b PD-PS: P. dilatatus (red) and P. scaber (green) c PD-AV: P. dilatatus (red) and A. vulgare (green). The outputs show 64 cells. Each cell is represented with a colour corresponding to the individual(s) in that cell. The colour is mixed using green and red proportional to the number of green and red individuals. If the cell is empty, the colour is black. The intensity of the colour reflects the number of individuals. The position of the individual is determined by its point G (centre-point). |