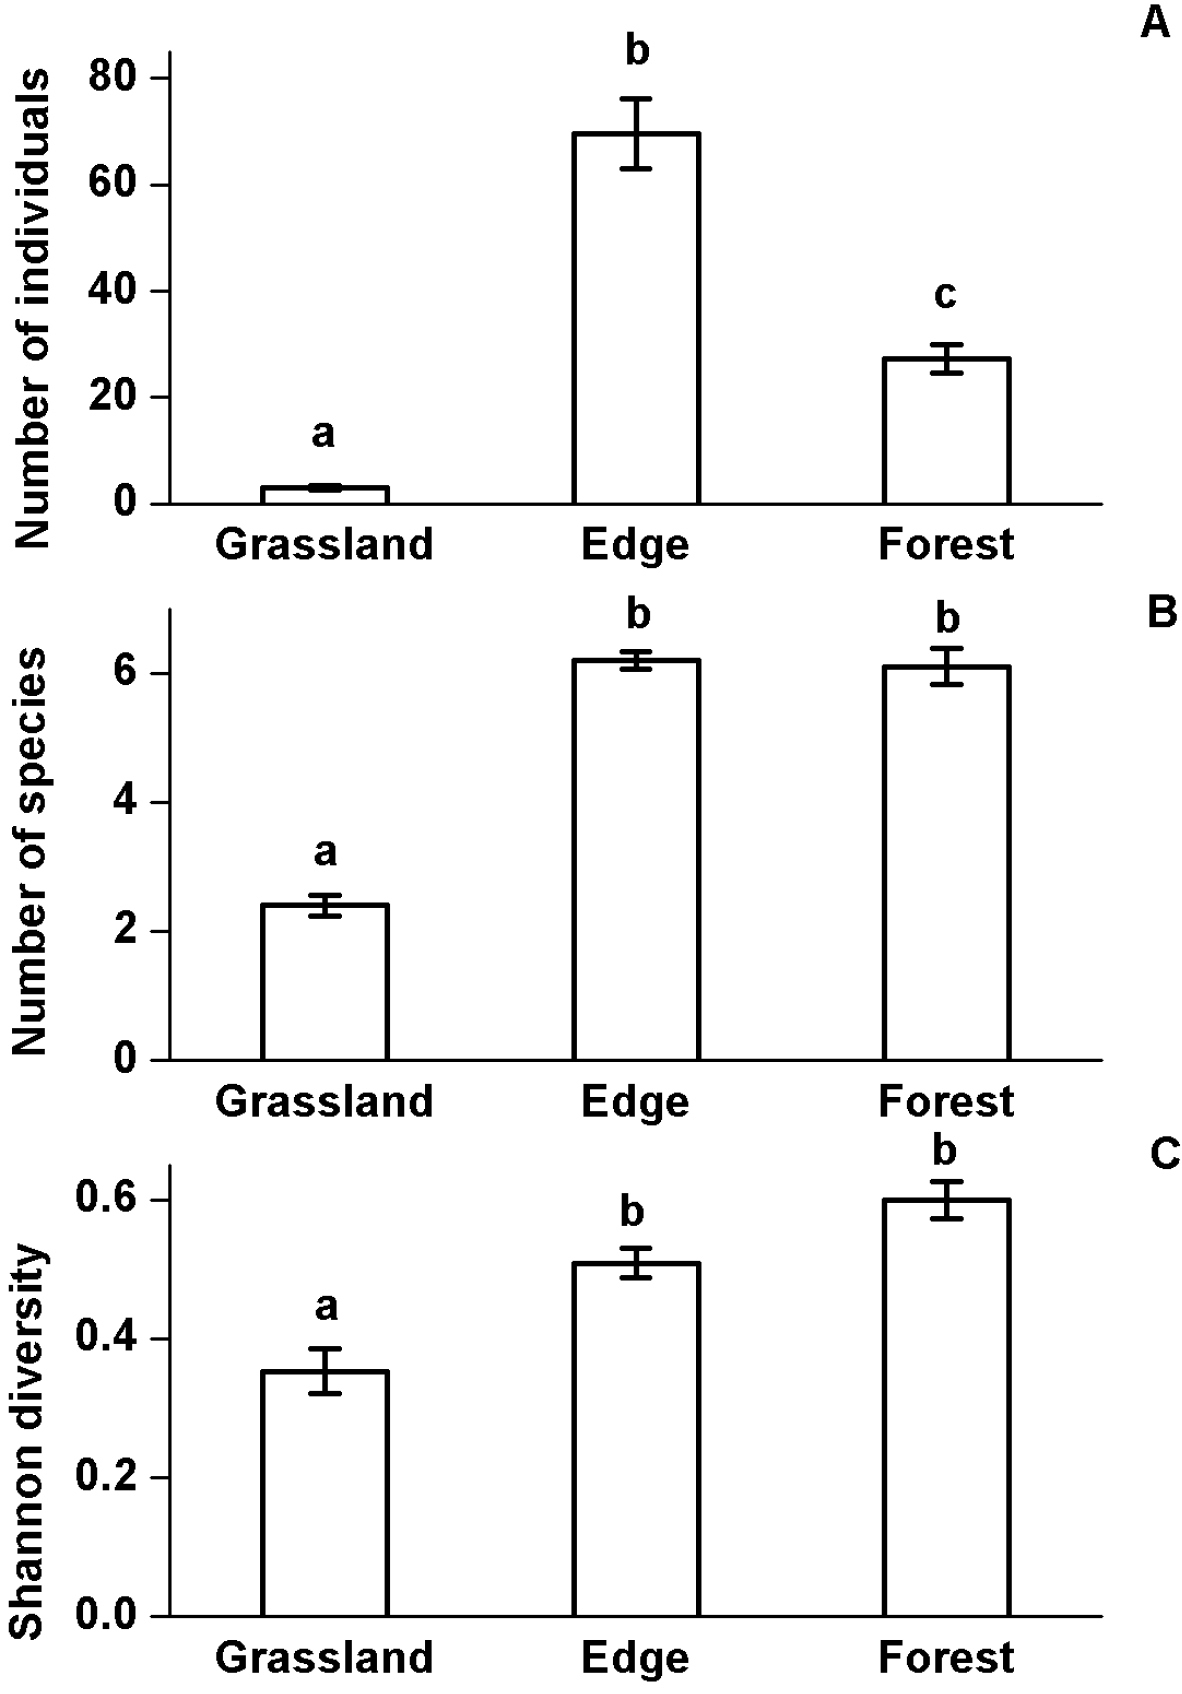
Millipede abundance, species richness and Shannon diversity at the studied habitats. Mean values (±SD) of the overall millipede abundance (A), species richness (B) and Shannon diversity (C) per samples at the studied habitats. Different letters indicate significant differences by Tukey test.


  Part of: Bogyó D, Magura T, Nagy DD, Tóthmérész B (2015) Distribution of millipedes (Myriapoda, Diplopoda) along a forest interior – forest edge – grassland habitat complex. In: Tuf IH, Tajovský K (Eds) Proceedings of the 16th International Congress of Myriapodology, Olomouc, Czech Republic. ZooKeys 510: 181-195. https://doi.org/10.3897/zookeys.510.8657