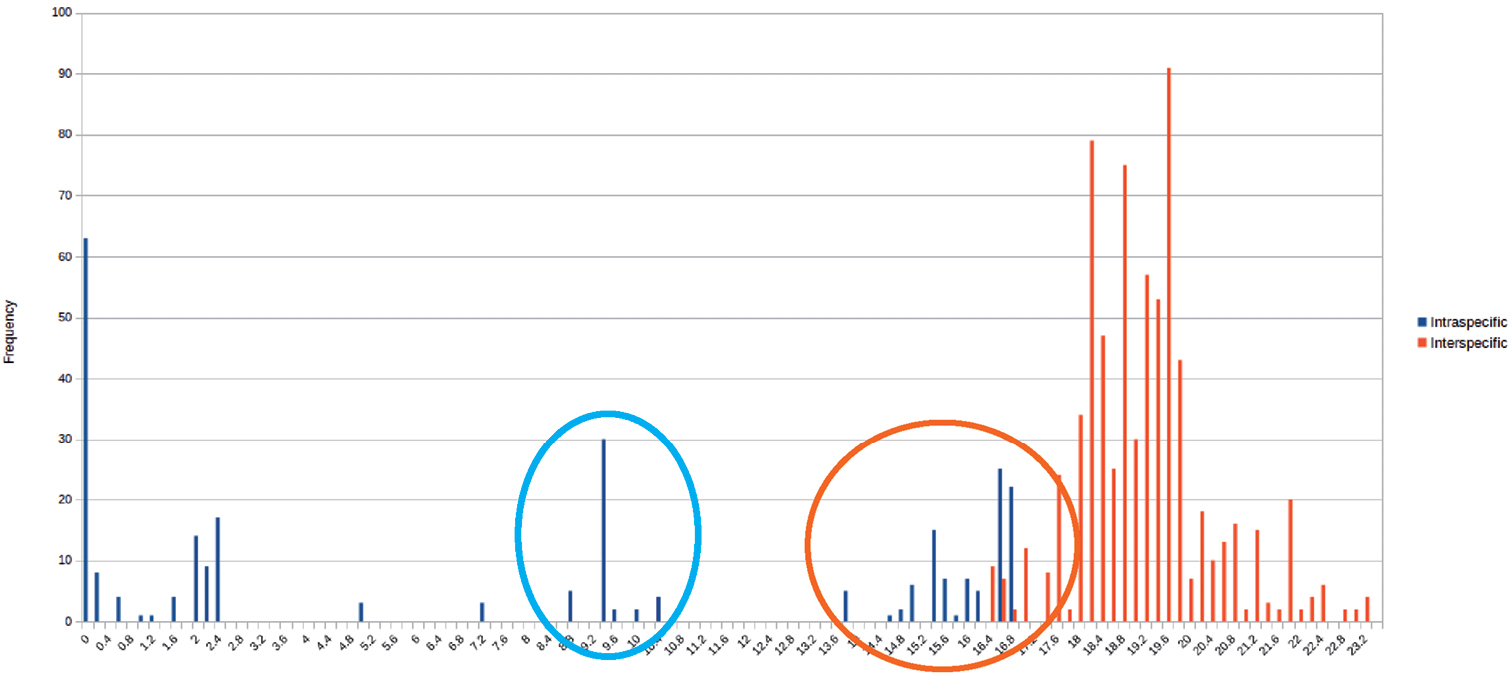
Frequency distribution of pairwise intraspecific (blue) and interspecific (red) distances. Blue circle = intraspecific distances of G. alpinus and among S. linearis L3; Red circle = interspecific distances and distances between S. linearis lineages. Basic table see Suppl. material 1.


  Part of: Wesener T, Voigtländer K, Decker P, Oeyen JF, Spelda J, Lindner N (2015) First results of the German Barcode of Life (GBOL) – Myriapoda project: Cryptic lineages in German Stenotaenia linearis (Koch, 1835) (Chilopoda, Geophilomorpha). In: Tuf IH, Tajovský K (Eds) Proceedings of the 16th International Congress of Myriapodology, Olomouc, Czech Republic. ZooKeys 510: 15-29. https://doi.org/10.3897/zookeys.510.8852