|
||
|
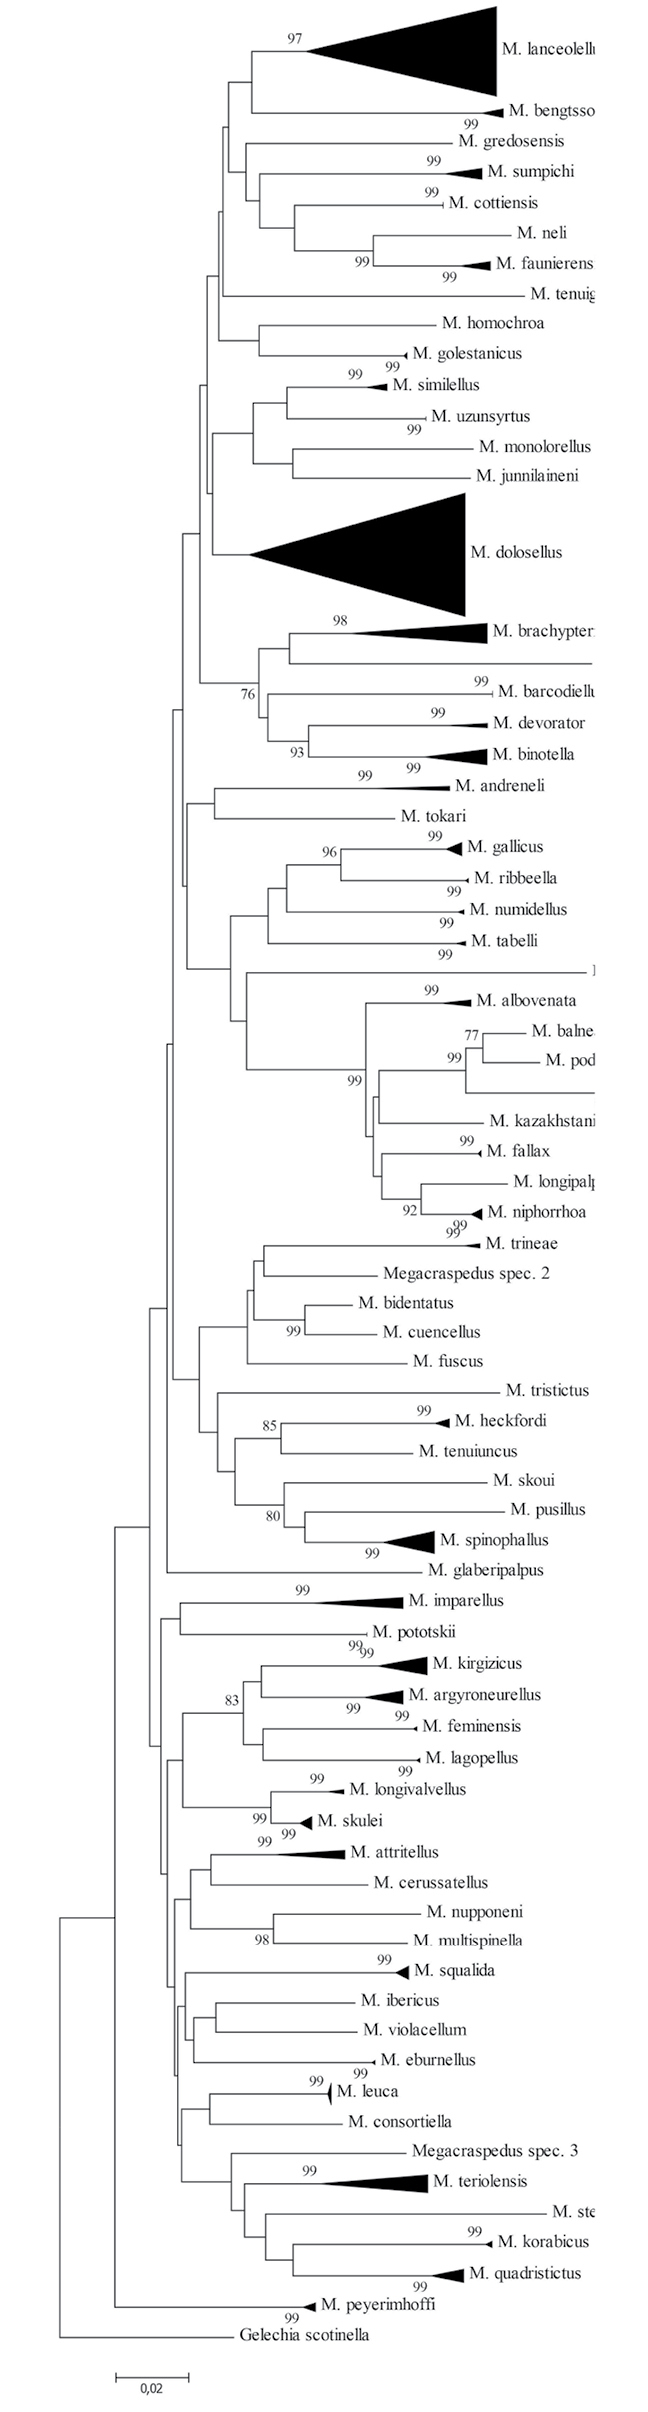
Neighbor-Joining tree (built with MEGA7) of cytochrome c oxidase subunit I (COI) barcode fragments. Values on branches represent bootstrap values of ≥ 75 % inferred from 500 replicates, scale bar represents substitutions per site. Note: the scale bar only applies to internal branches between species. The width of the triangles represents the sample size, and the depth the relative genetic variation within the cluster (2× scale bar). Source: DNA Barcode data from BOLD (Barcode of Life Database, cf. Ratnasingham and Hebert 2007). |