|
||
|
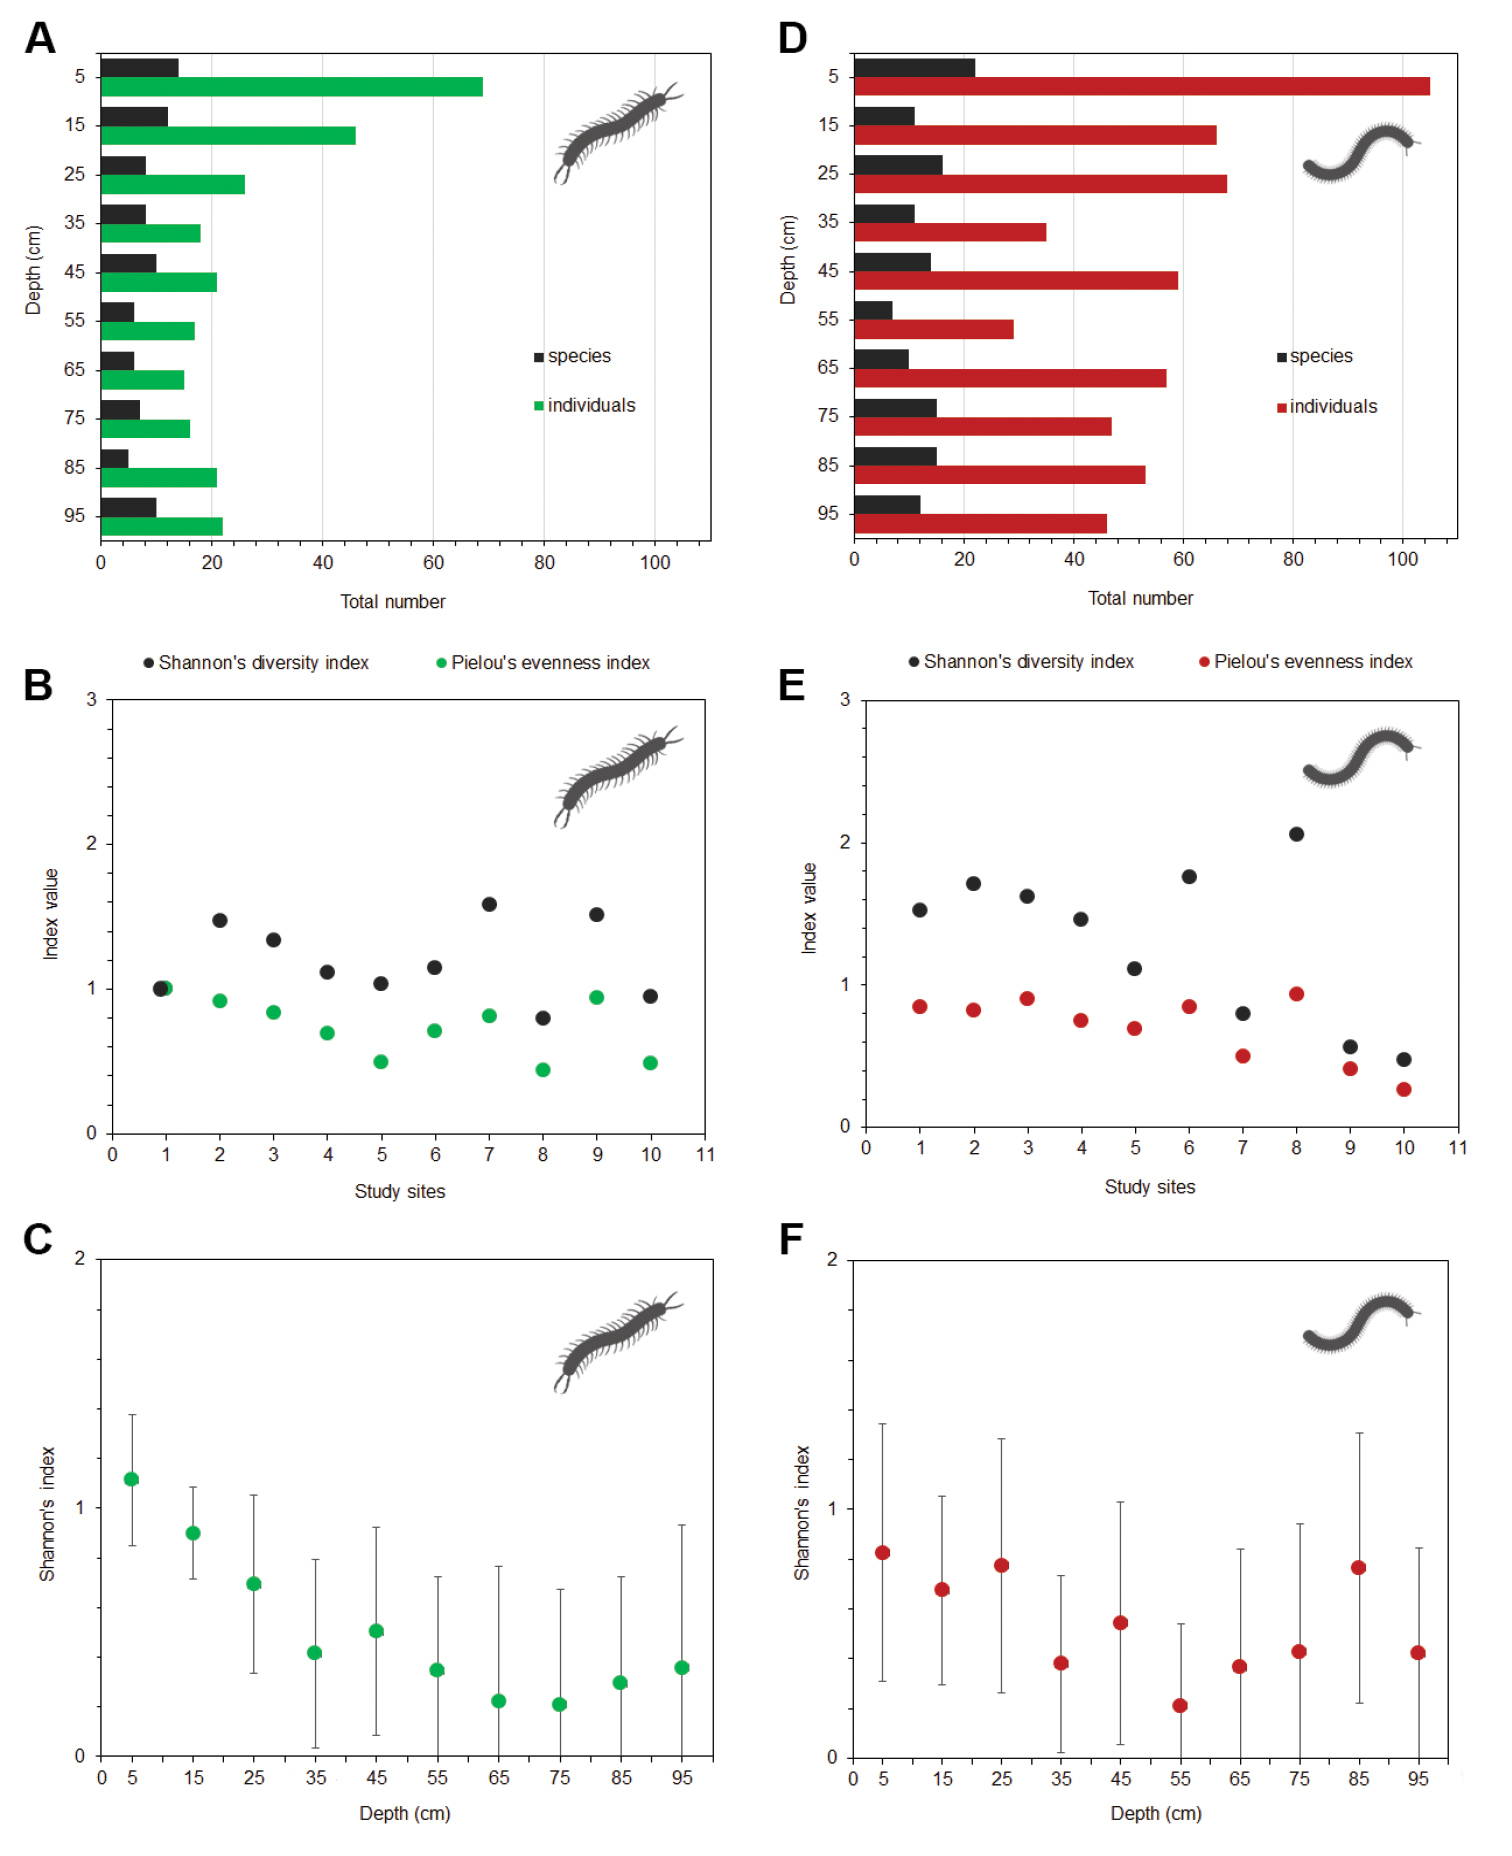
A Overall depth distribution of centipede individuals and species B values of Shannon’s diversity index and Pielou’s evenness index, calculated for centipedes, at each of the study sites C mean values of Shannon’s diversity index (±SD) calculated for centipedes, at each depth of the gradient (summarised data from all localities) D overall depth distribution of millipede individuals and species E values of Shannon’s diversity index and Pielou’s evenness index, calculated for millipedes, at each of the study sites F mean values of Shannon’s diversity index (±SD) calculated for millipedes, at each depth of the gradient. |