|
||
|
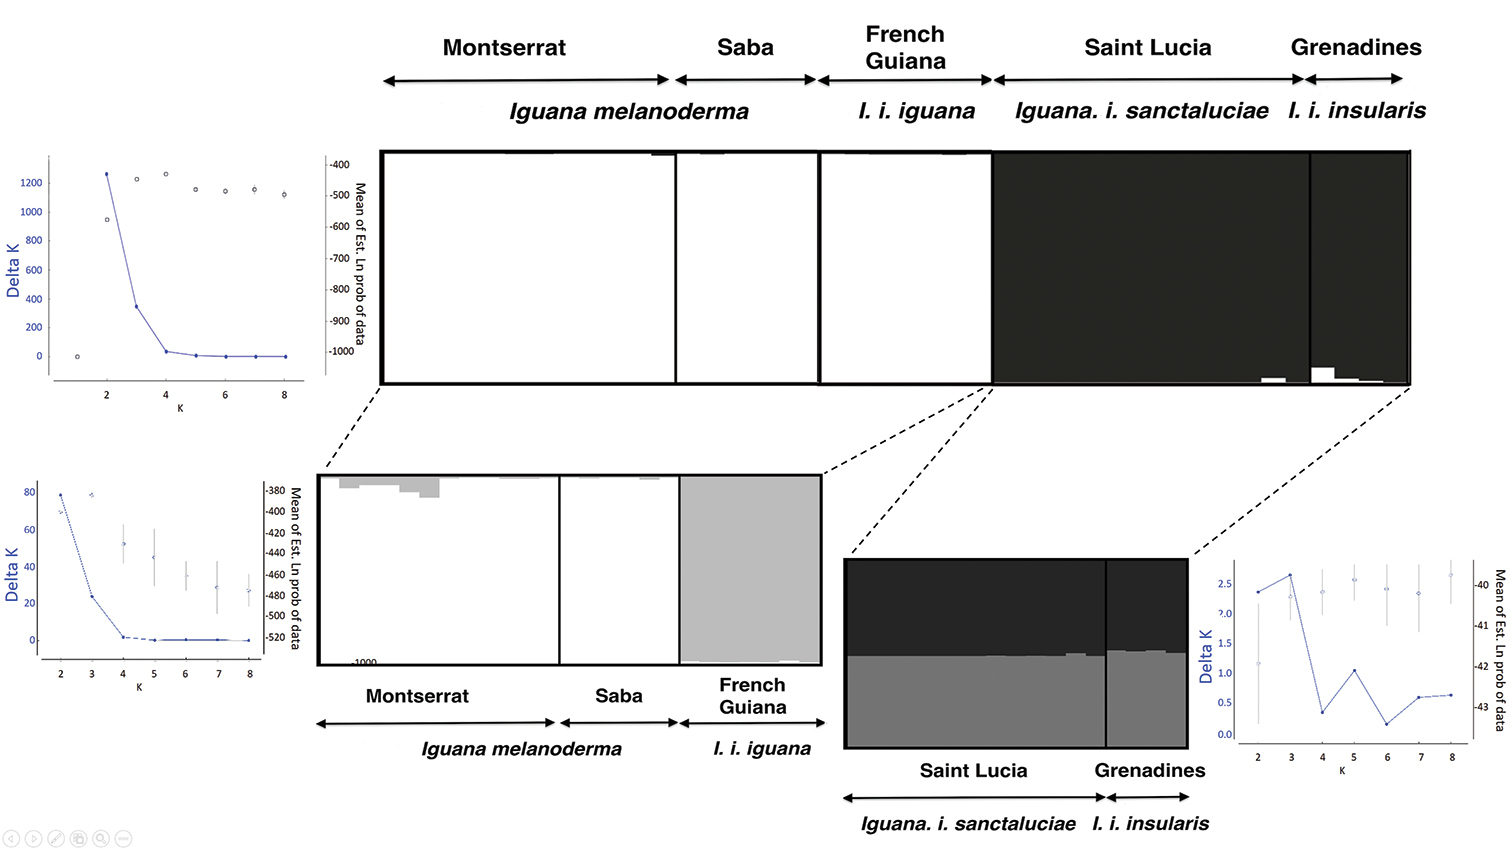
Hierarchical genetic structure of Iguana inferred by Structure and Structure harvester. Bar plots show admixture coefficient of each analyzed individuals (represented by each vertical bar) for the inferred genetic clusters K (represented by a different color). The graphs show Delta K values (Evanno et al. 2005) as a function of K (number of clusters) and calculated from posterior probabilities of the data (i.e., ln [P(D|K)]). The results inferred K = 2 genetic clusters when they were initially based on the overall sampling. A subsequent run, including individuals from Montserrat-Saba and French Guiana, revealed significant genetic substructure (i.e., K = 2) separating individuals from Montserrat-Saba and those from French Guiana. Independently, another subsequent run including only individuals from Saint Lucia and the Grenadines revealed no genetic substructure. The bar plots were produced using Distruct 1.1 program (Rosenberg 2004) from the average of the 15 replicates. The names of the taxa are given according to Breuil et al. (2019) and to the conclusion of this work for Saba and Montserrat. |