|
||
|
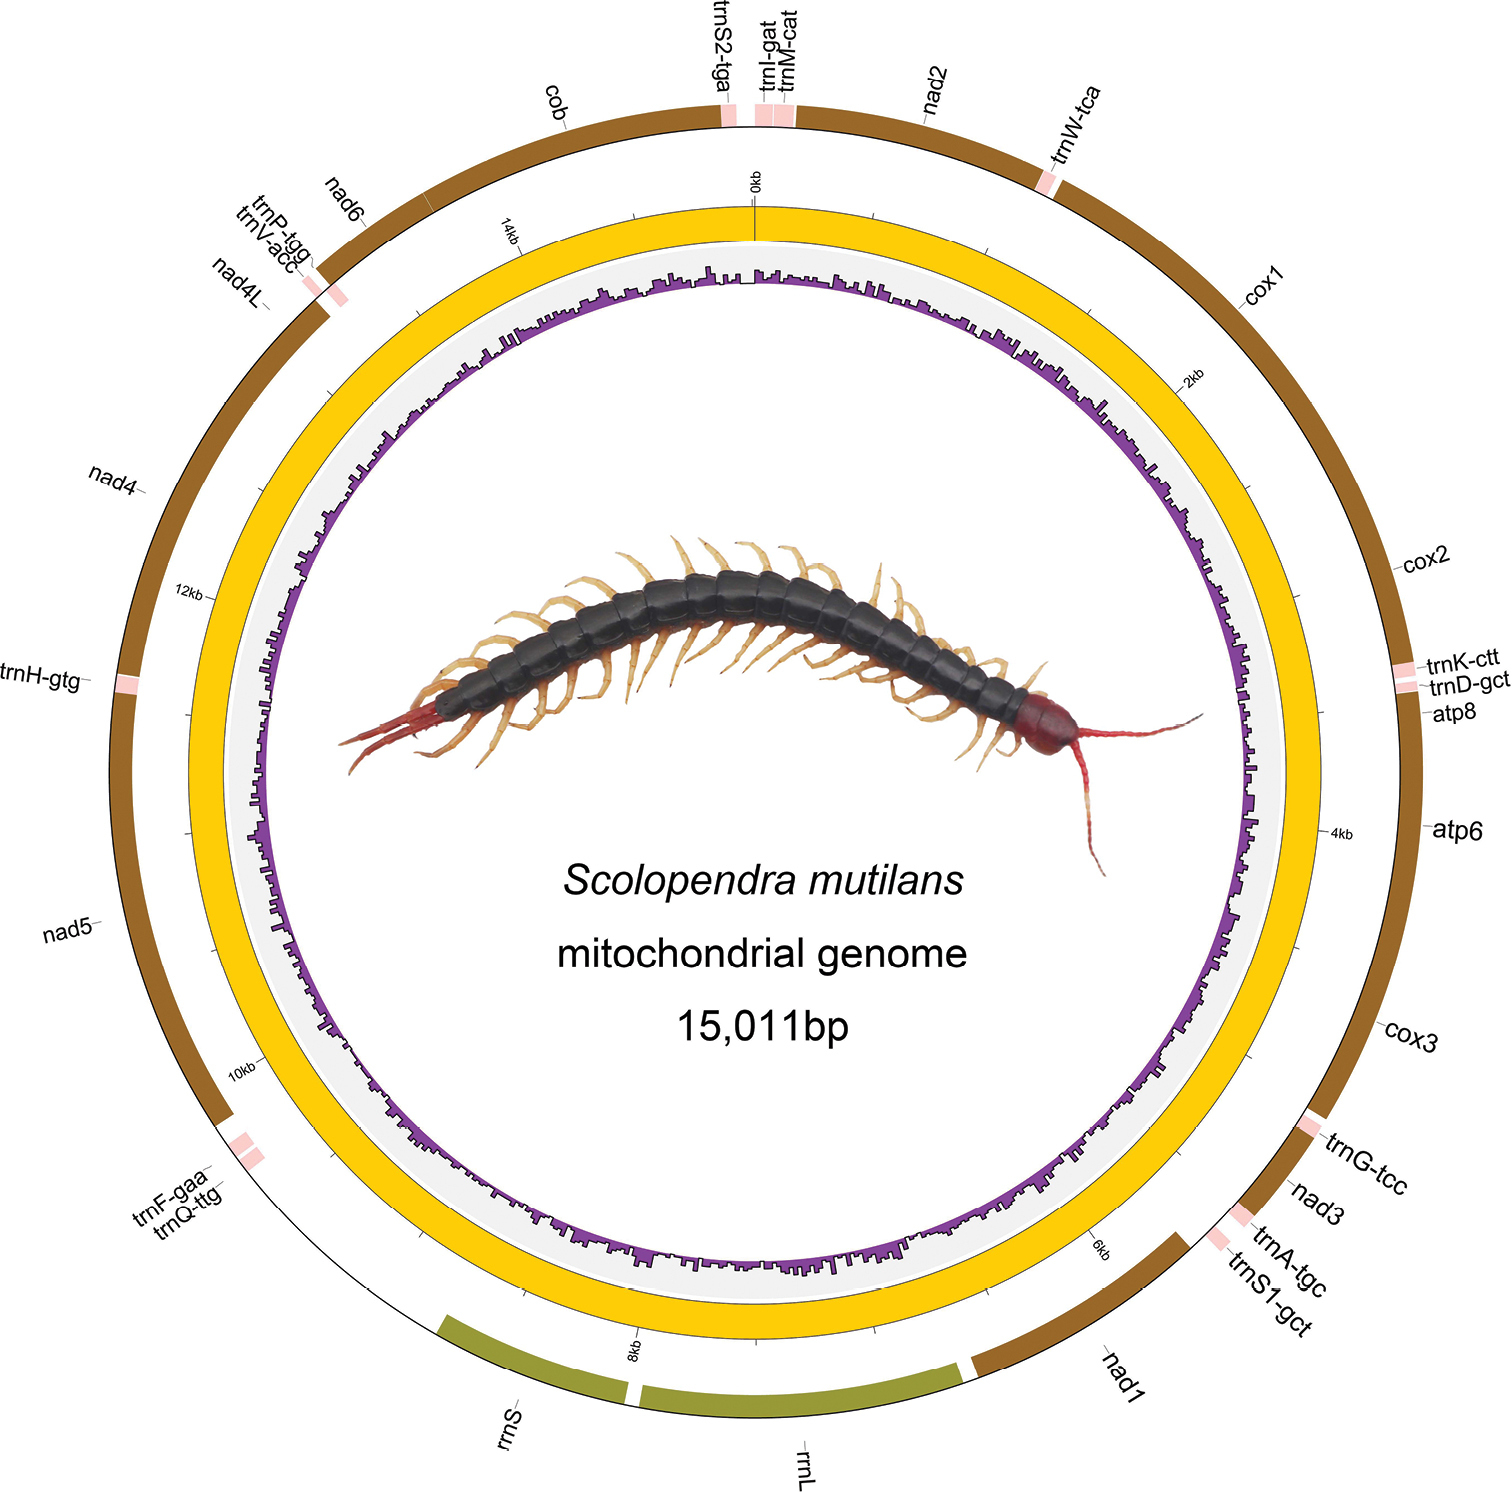
Mitochondrial genome map of the Scolopendra mutilans. Genes drawn inside the circle are transcribed clockwise, and those outside are counterclockwise. PCGs are shown as brown arrows, rRNA genes as green arrows, tRNA genes as pink arrows. The innermost circle shows the GC content. GC content is plotted as the deviation from the average value of the entire sequence. |